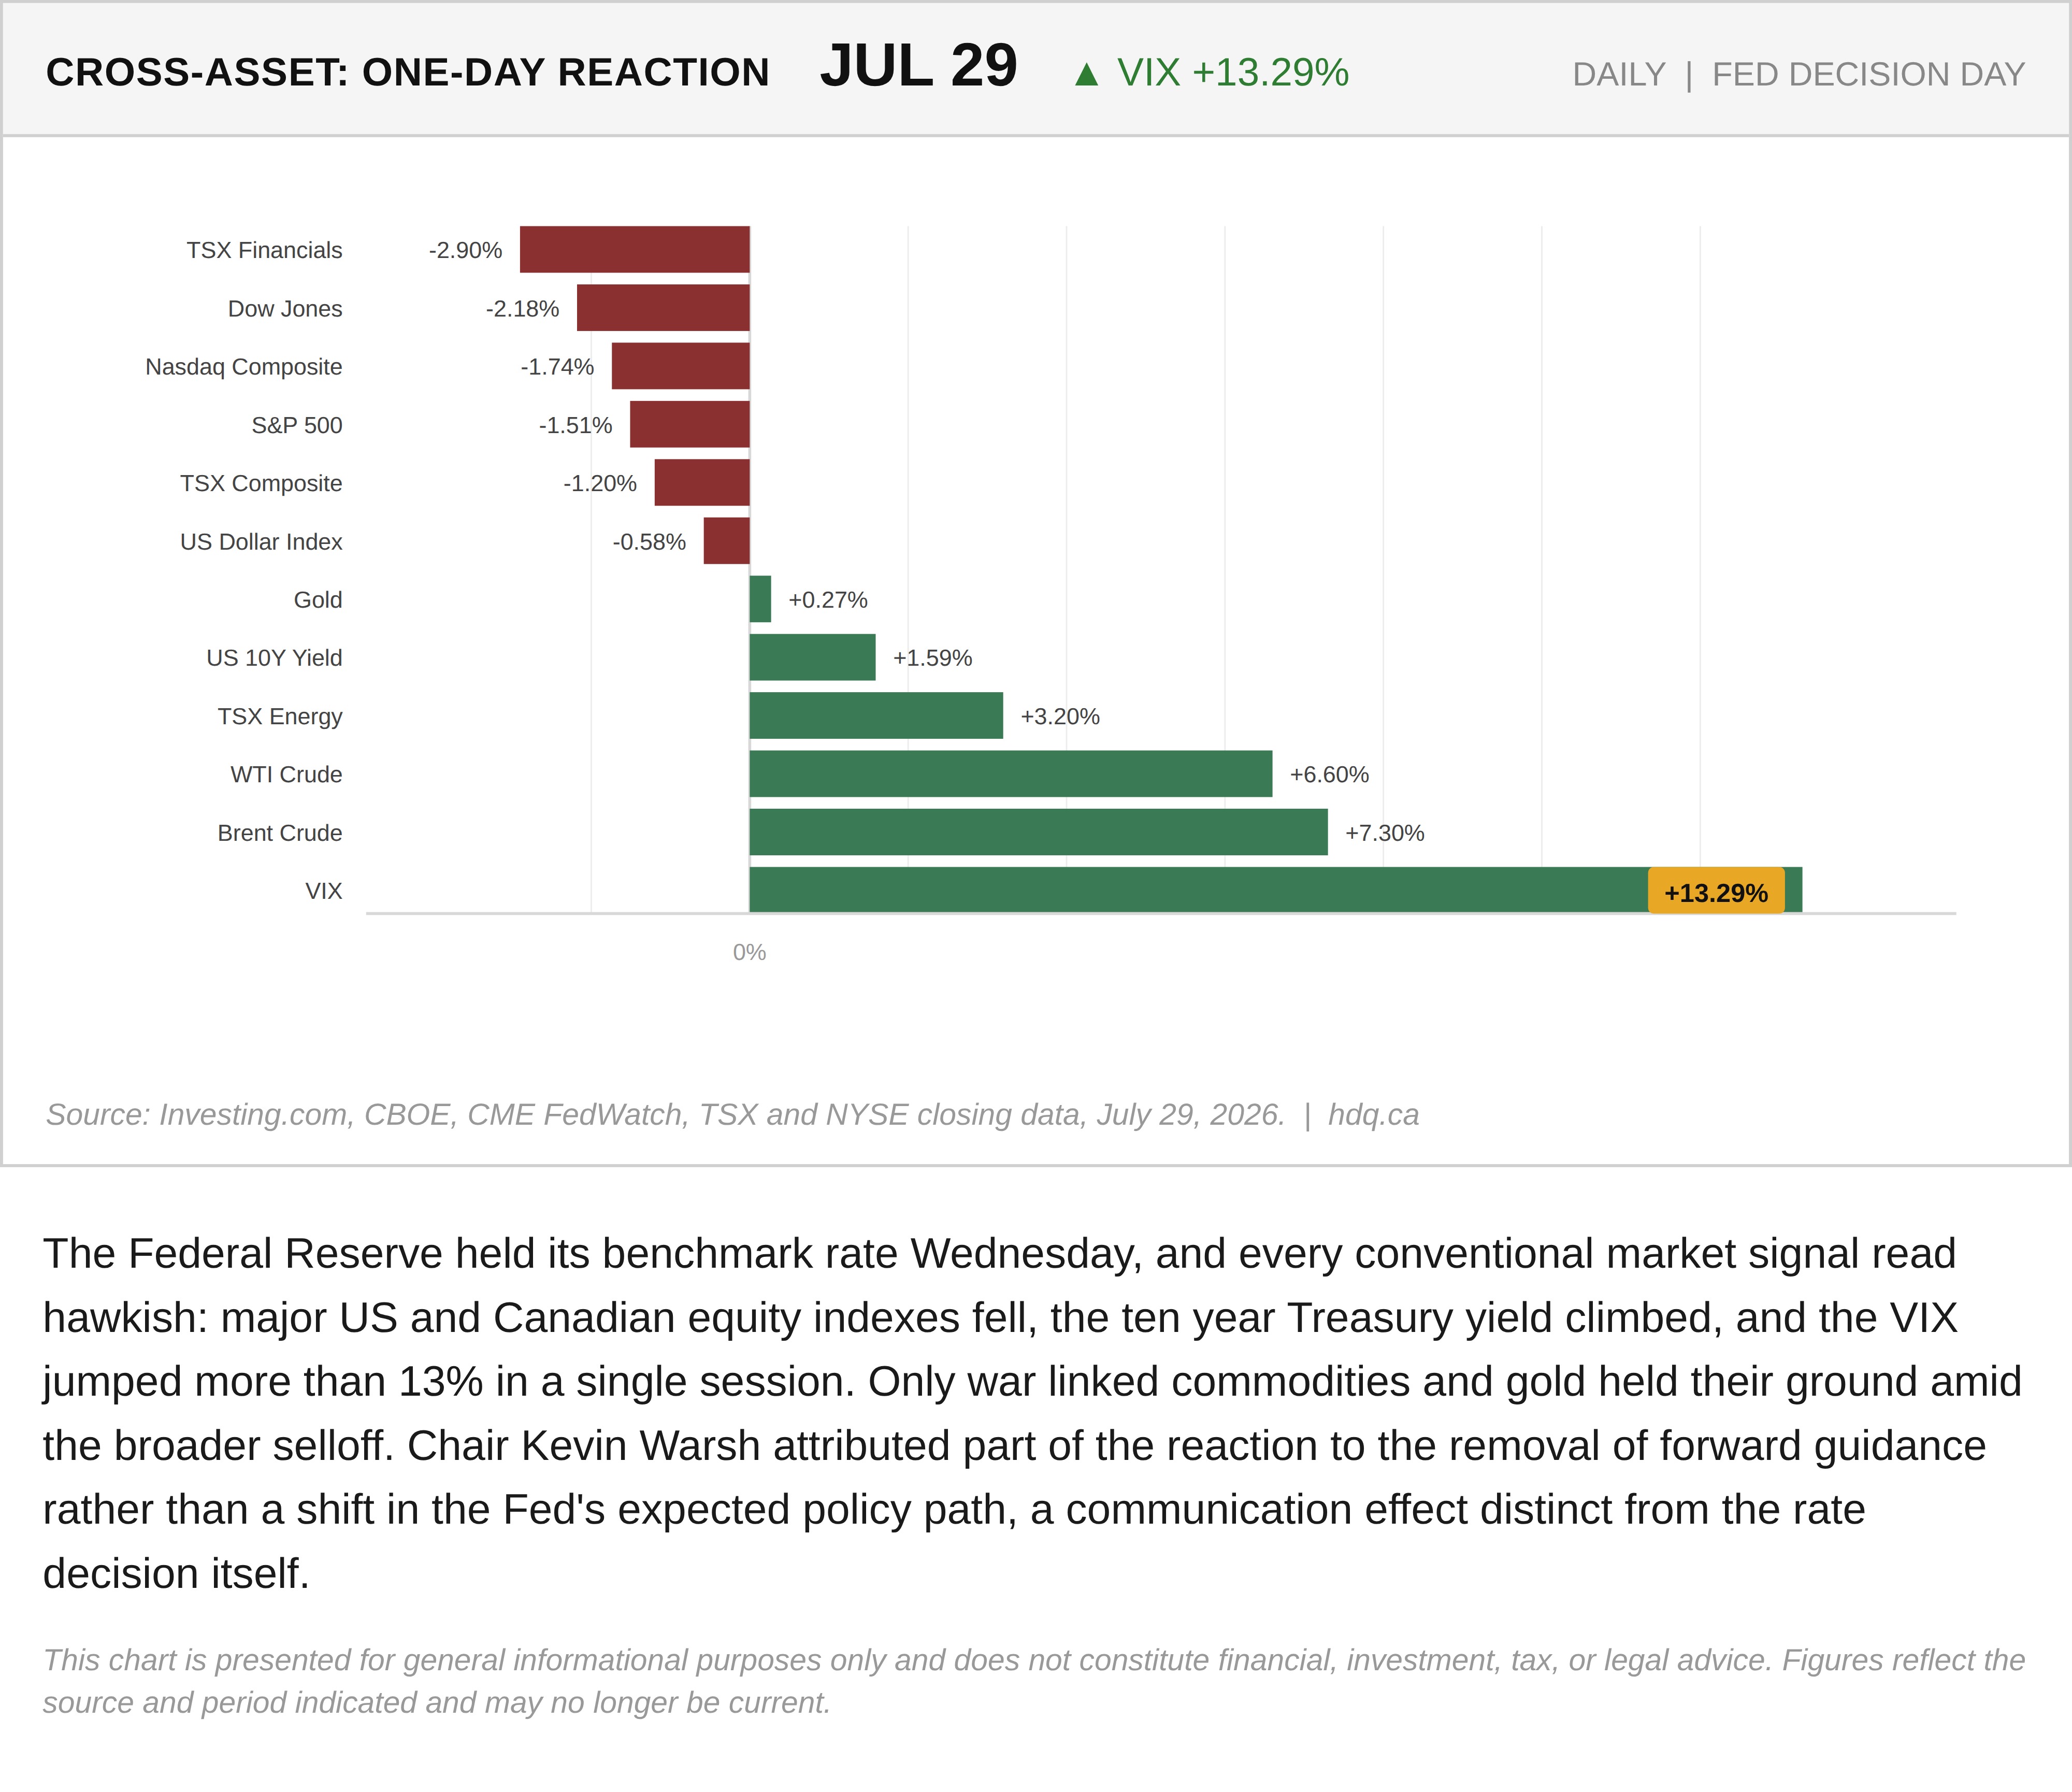
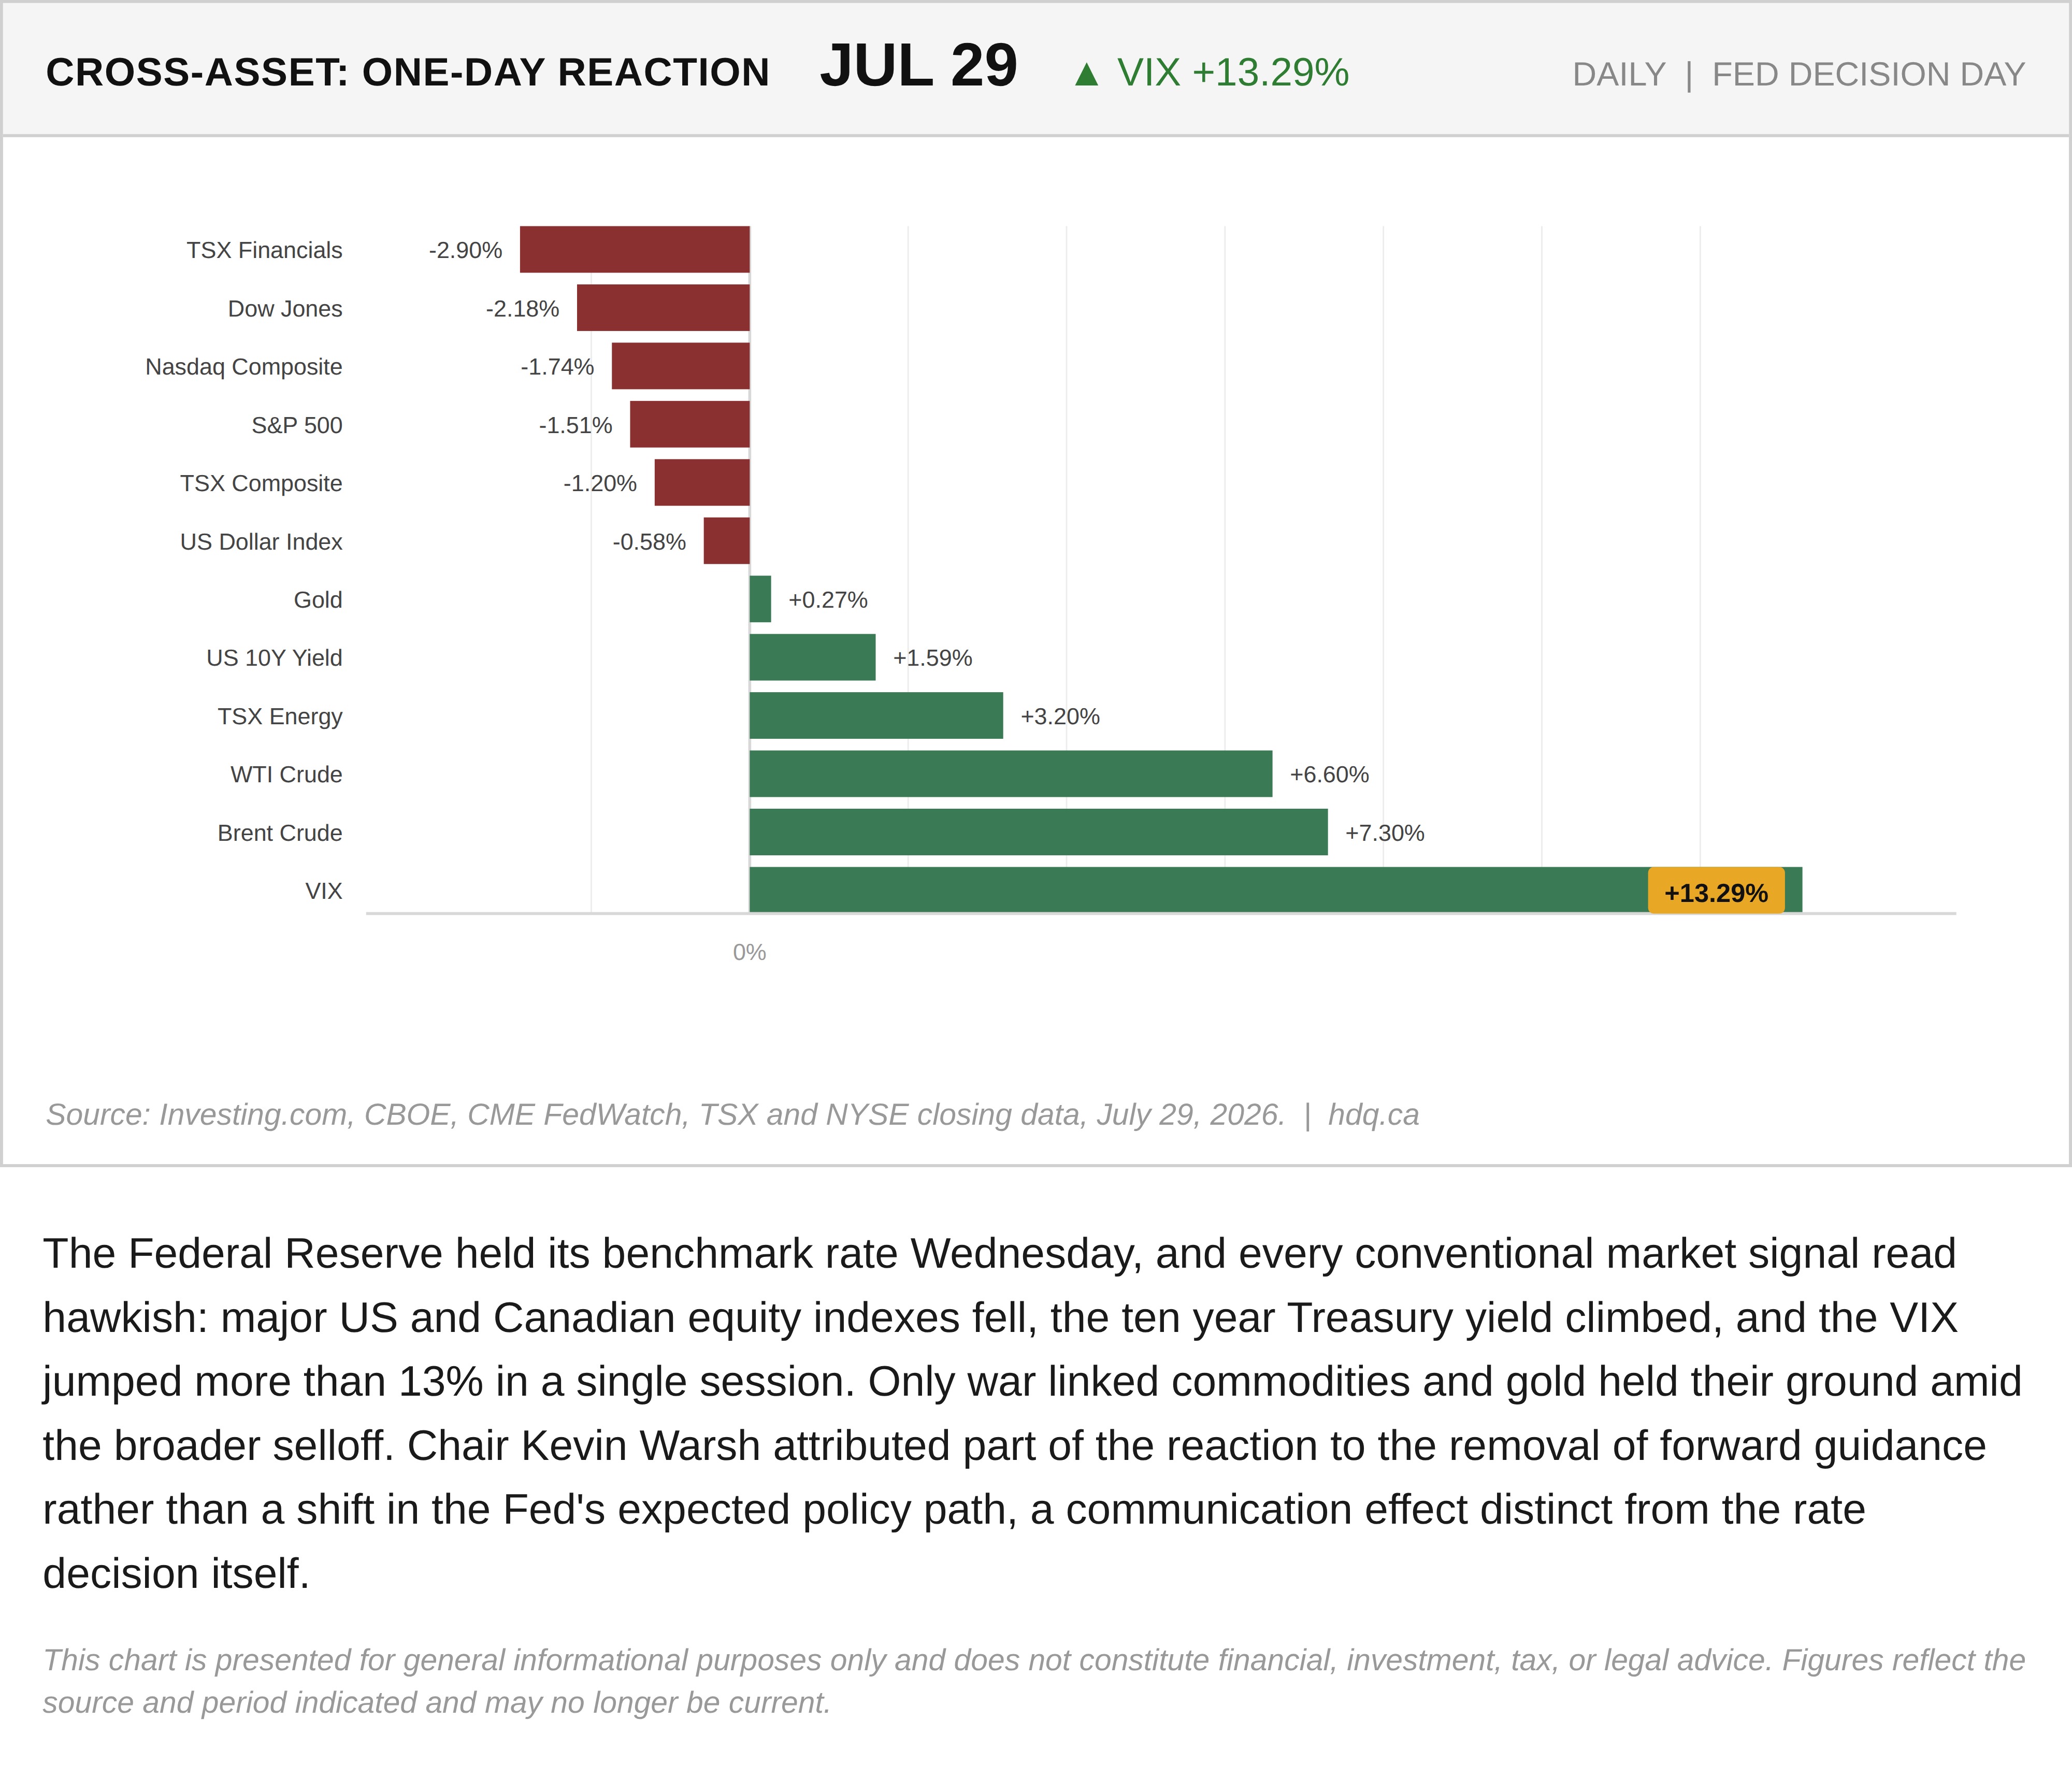
The Federal Reserve held its benchmark rate Wednesday, and every conventional market signal read hawkish: major US and Canadian equity indexes fell, the ten year Treasury yield climbed, and the VIX jumped more than 13% in a single session. Only war linked commodities and gold held their ground amid the broader selloff. Chair Kevin Warsh attributed part of the reaction to the removal of forward guidance rather than a shift in the Fed's expected policy path, a communication effect distinct from the rate decision itself.
This chart is presented for general informational purposes only and does not constitute financial, investment, tax, or legal advice. Figures reflect the source and period indicated and may no longer be current.
Related charts
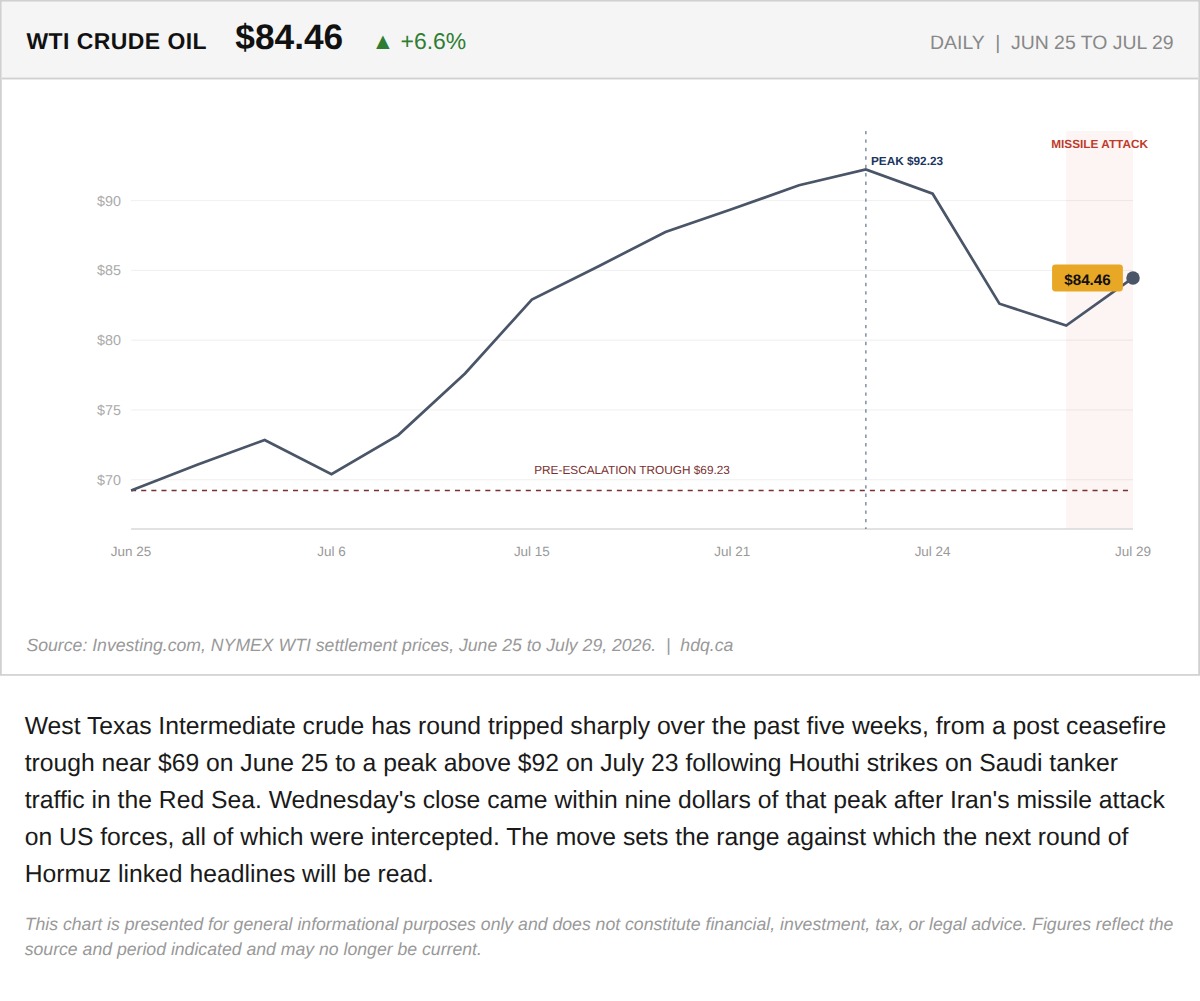
West Texas Intermediate crude has round tripped sharply over the past five weeks, from a post ceasefire trough near $69 on June 25 to a…
WTI Crude's Five-Week Round Trip, From Post-Ceasefire Low to War-Driven Rebound
July 29, 2026
View chart & download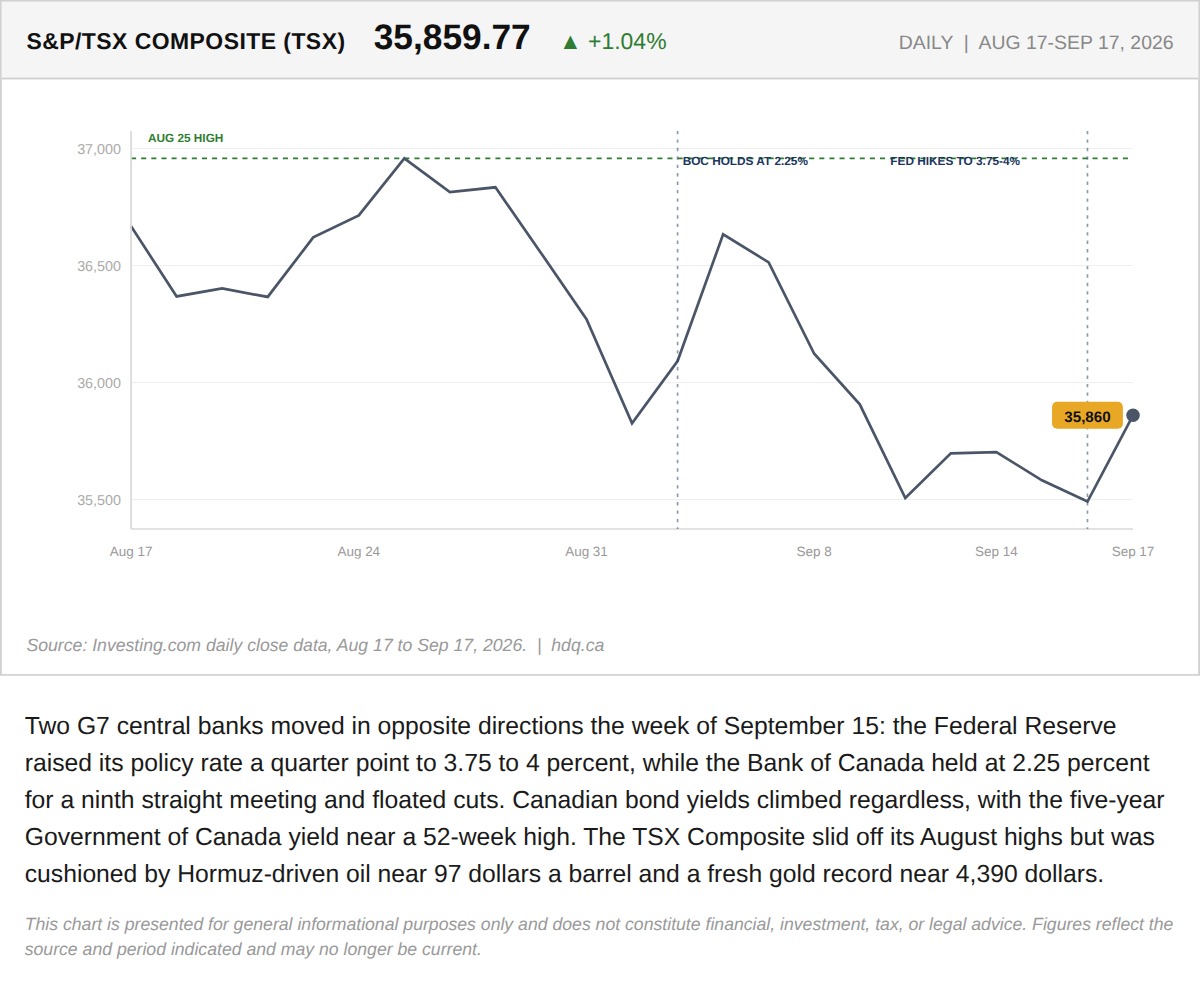
Two G7 central banks moved in opposite directions the week of September 15: the Federal Reserve raised its policy rate a quarter point to…
The Week the Bank of Canada's Own Rate Stopped Setting Canadian Borrowing Costs
September 19, 2026
View chart & download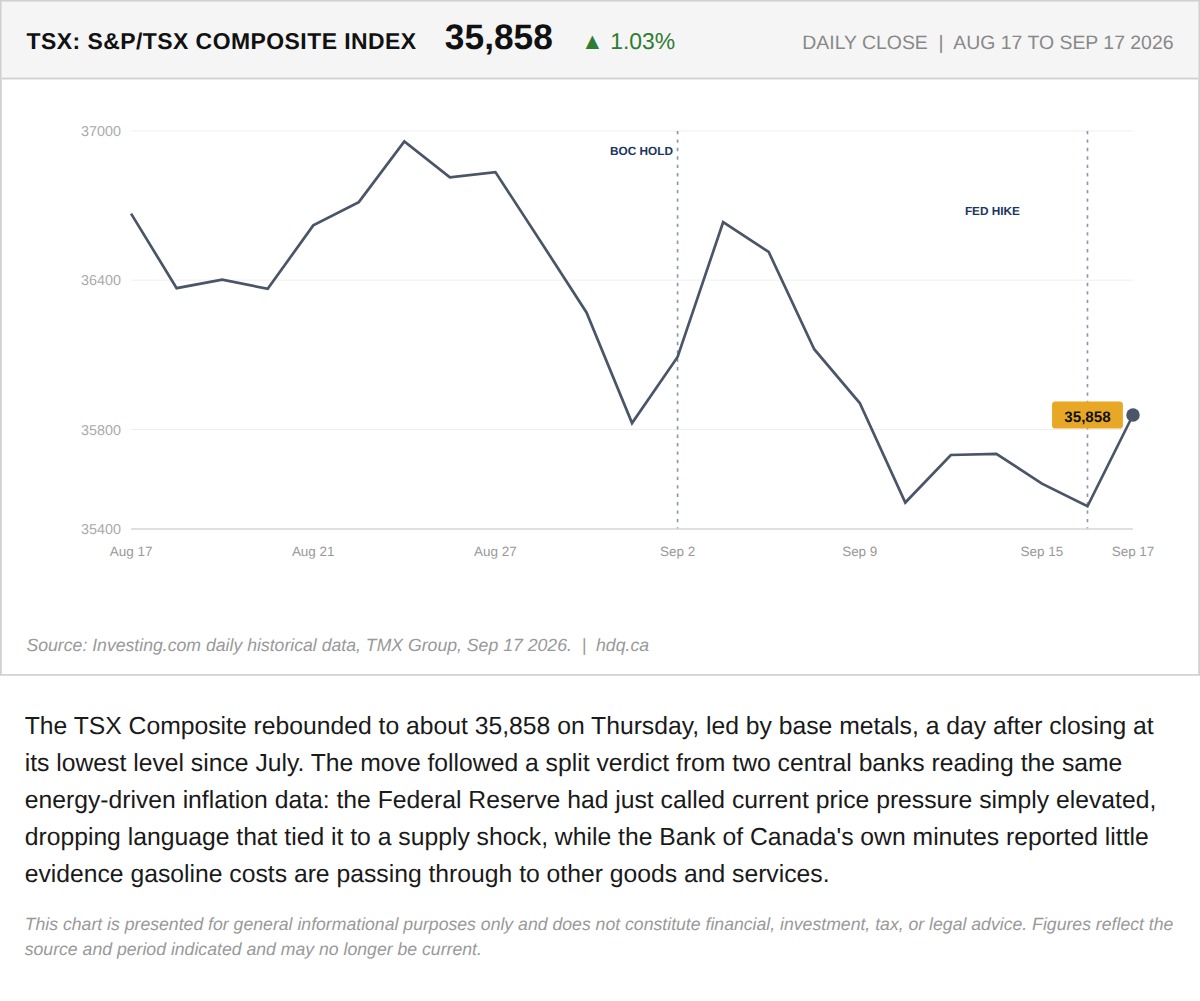
The TSX Composite rebounded to about 35,858 on Thursday, led by base metals, a day after closing at its lowest level since July.
The Fed Called an Oil Shock Elevated the Same Day the BoC Found No Sign It Has Spread
September 17, 2026
View chart & download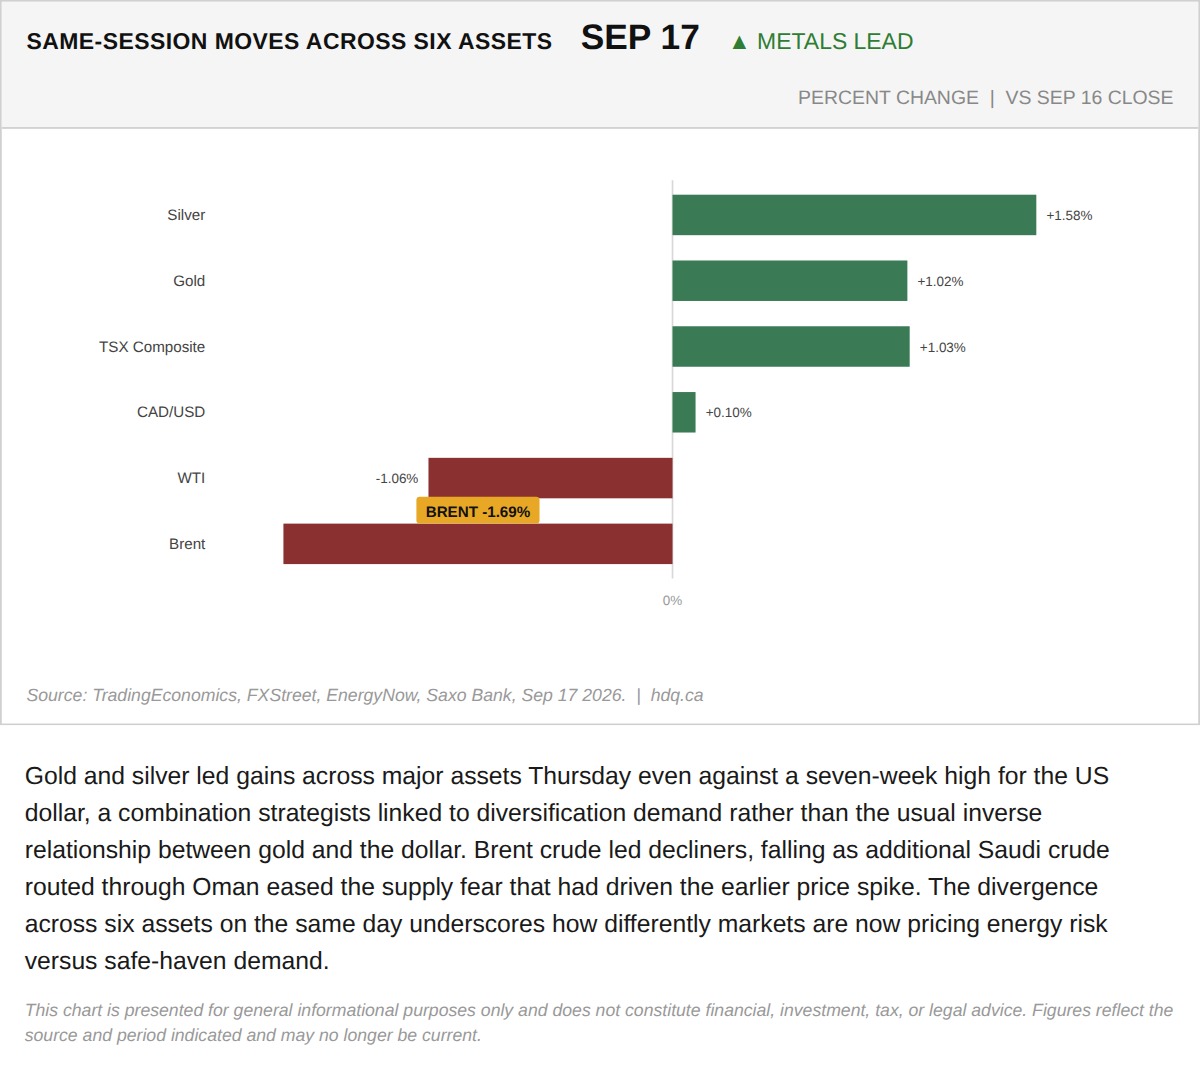
Gold and silver led gains across major assets Thursday even against a seven-week high for the US dollar, a combination strategists linked…
The Fed Called an Oil Shock Elevated the Same Day the BoC Found No Sign It Has Spread
September 17, 2026
View chart & download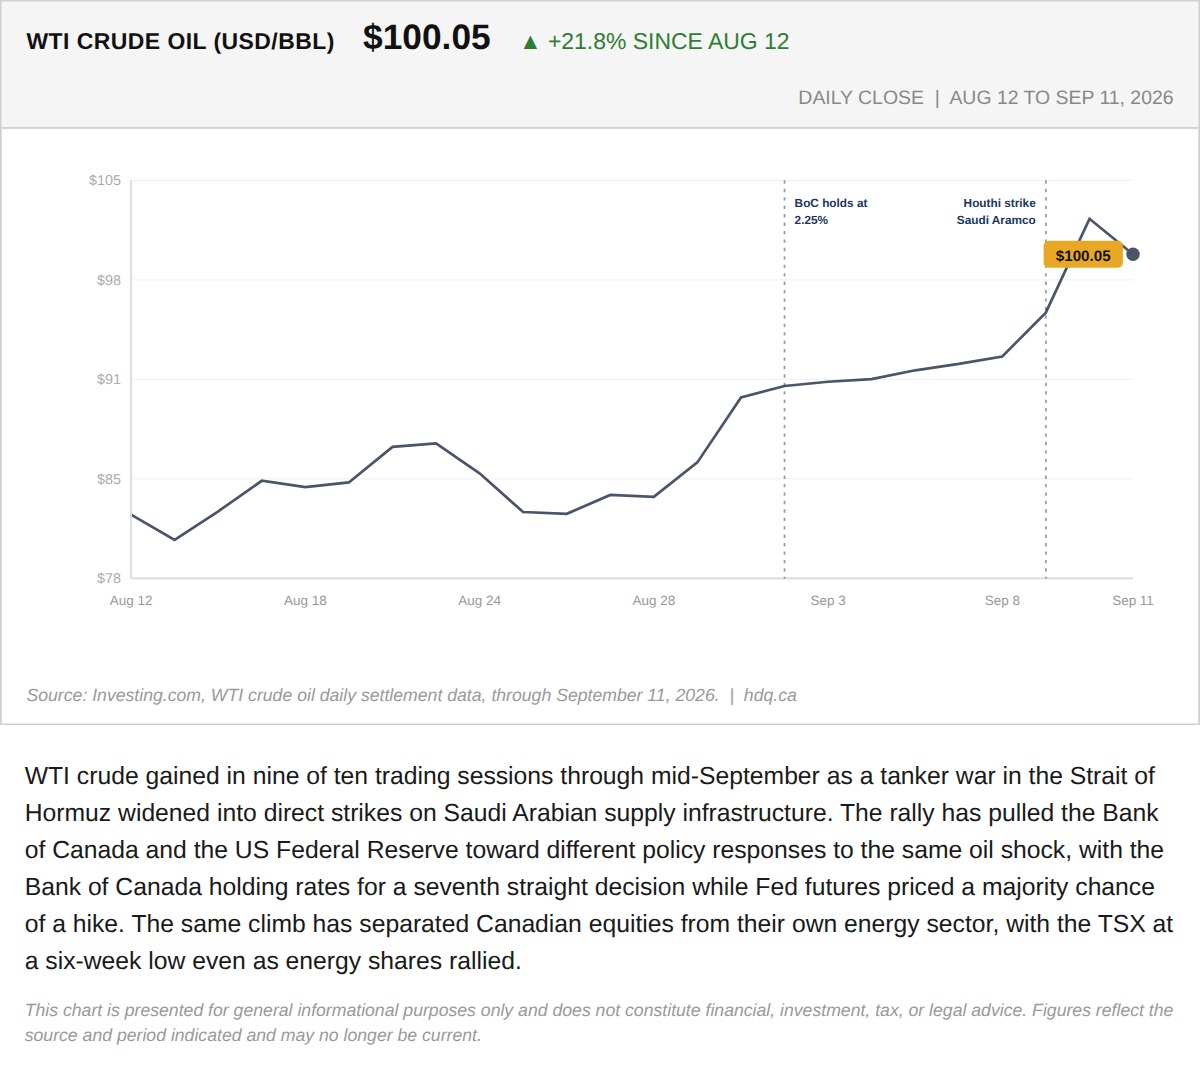
WTI crude gained in nine of ten trading sessions through mid-September as a tanker war in the Strait of Hormuz widened into direct strikes on Saudi Arabian supply infrastructure.
The Week the Same Barrel of Oil Split the BoC From the Fed and the TSX From Its Own Energy Sector
September 12, 2026
View chart & download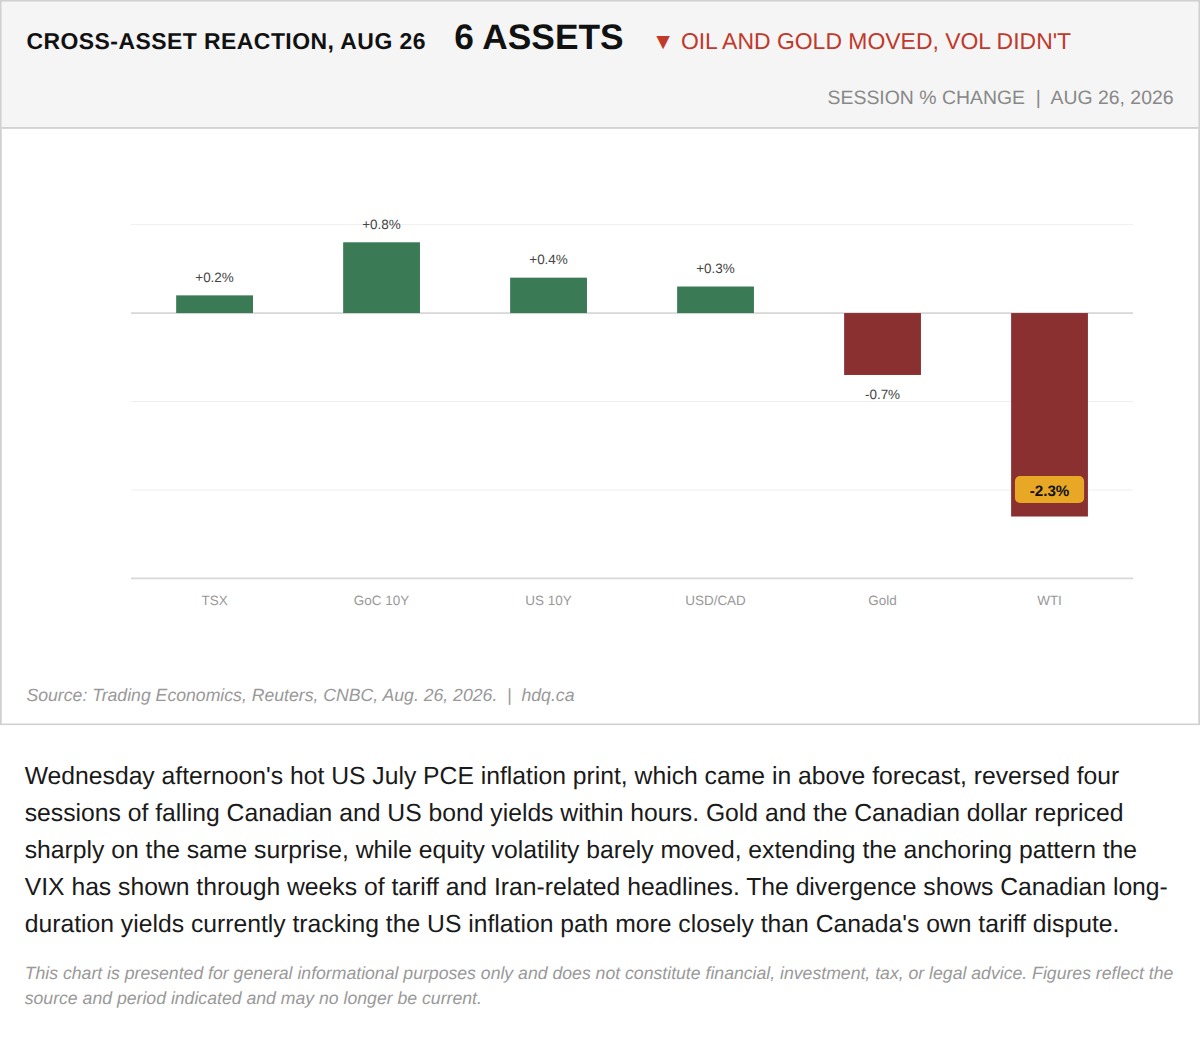
Wednesday afternoon's hot US July PCE inflation print, which came in above forecast, reversed four sessions of falling Canadian and US bond yields within hours.
The July PCE Surprise Reversed Four Days of Falling Canadian Yields in One Afternoon
August 26, 2026
View chart & download