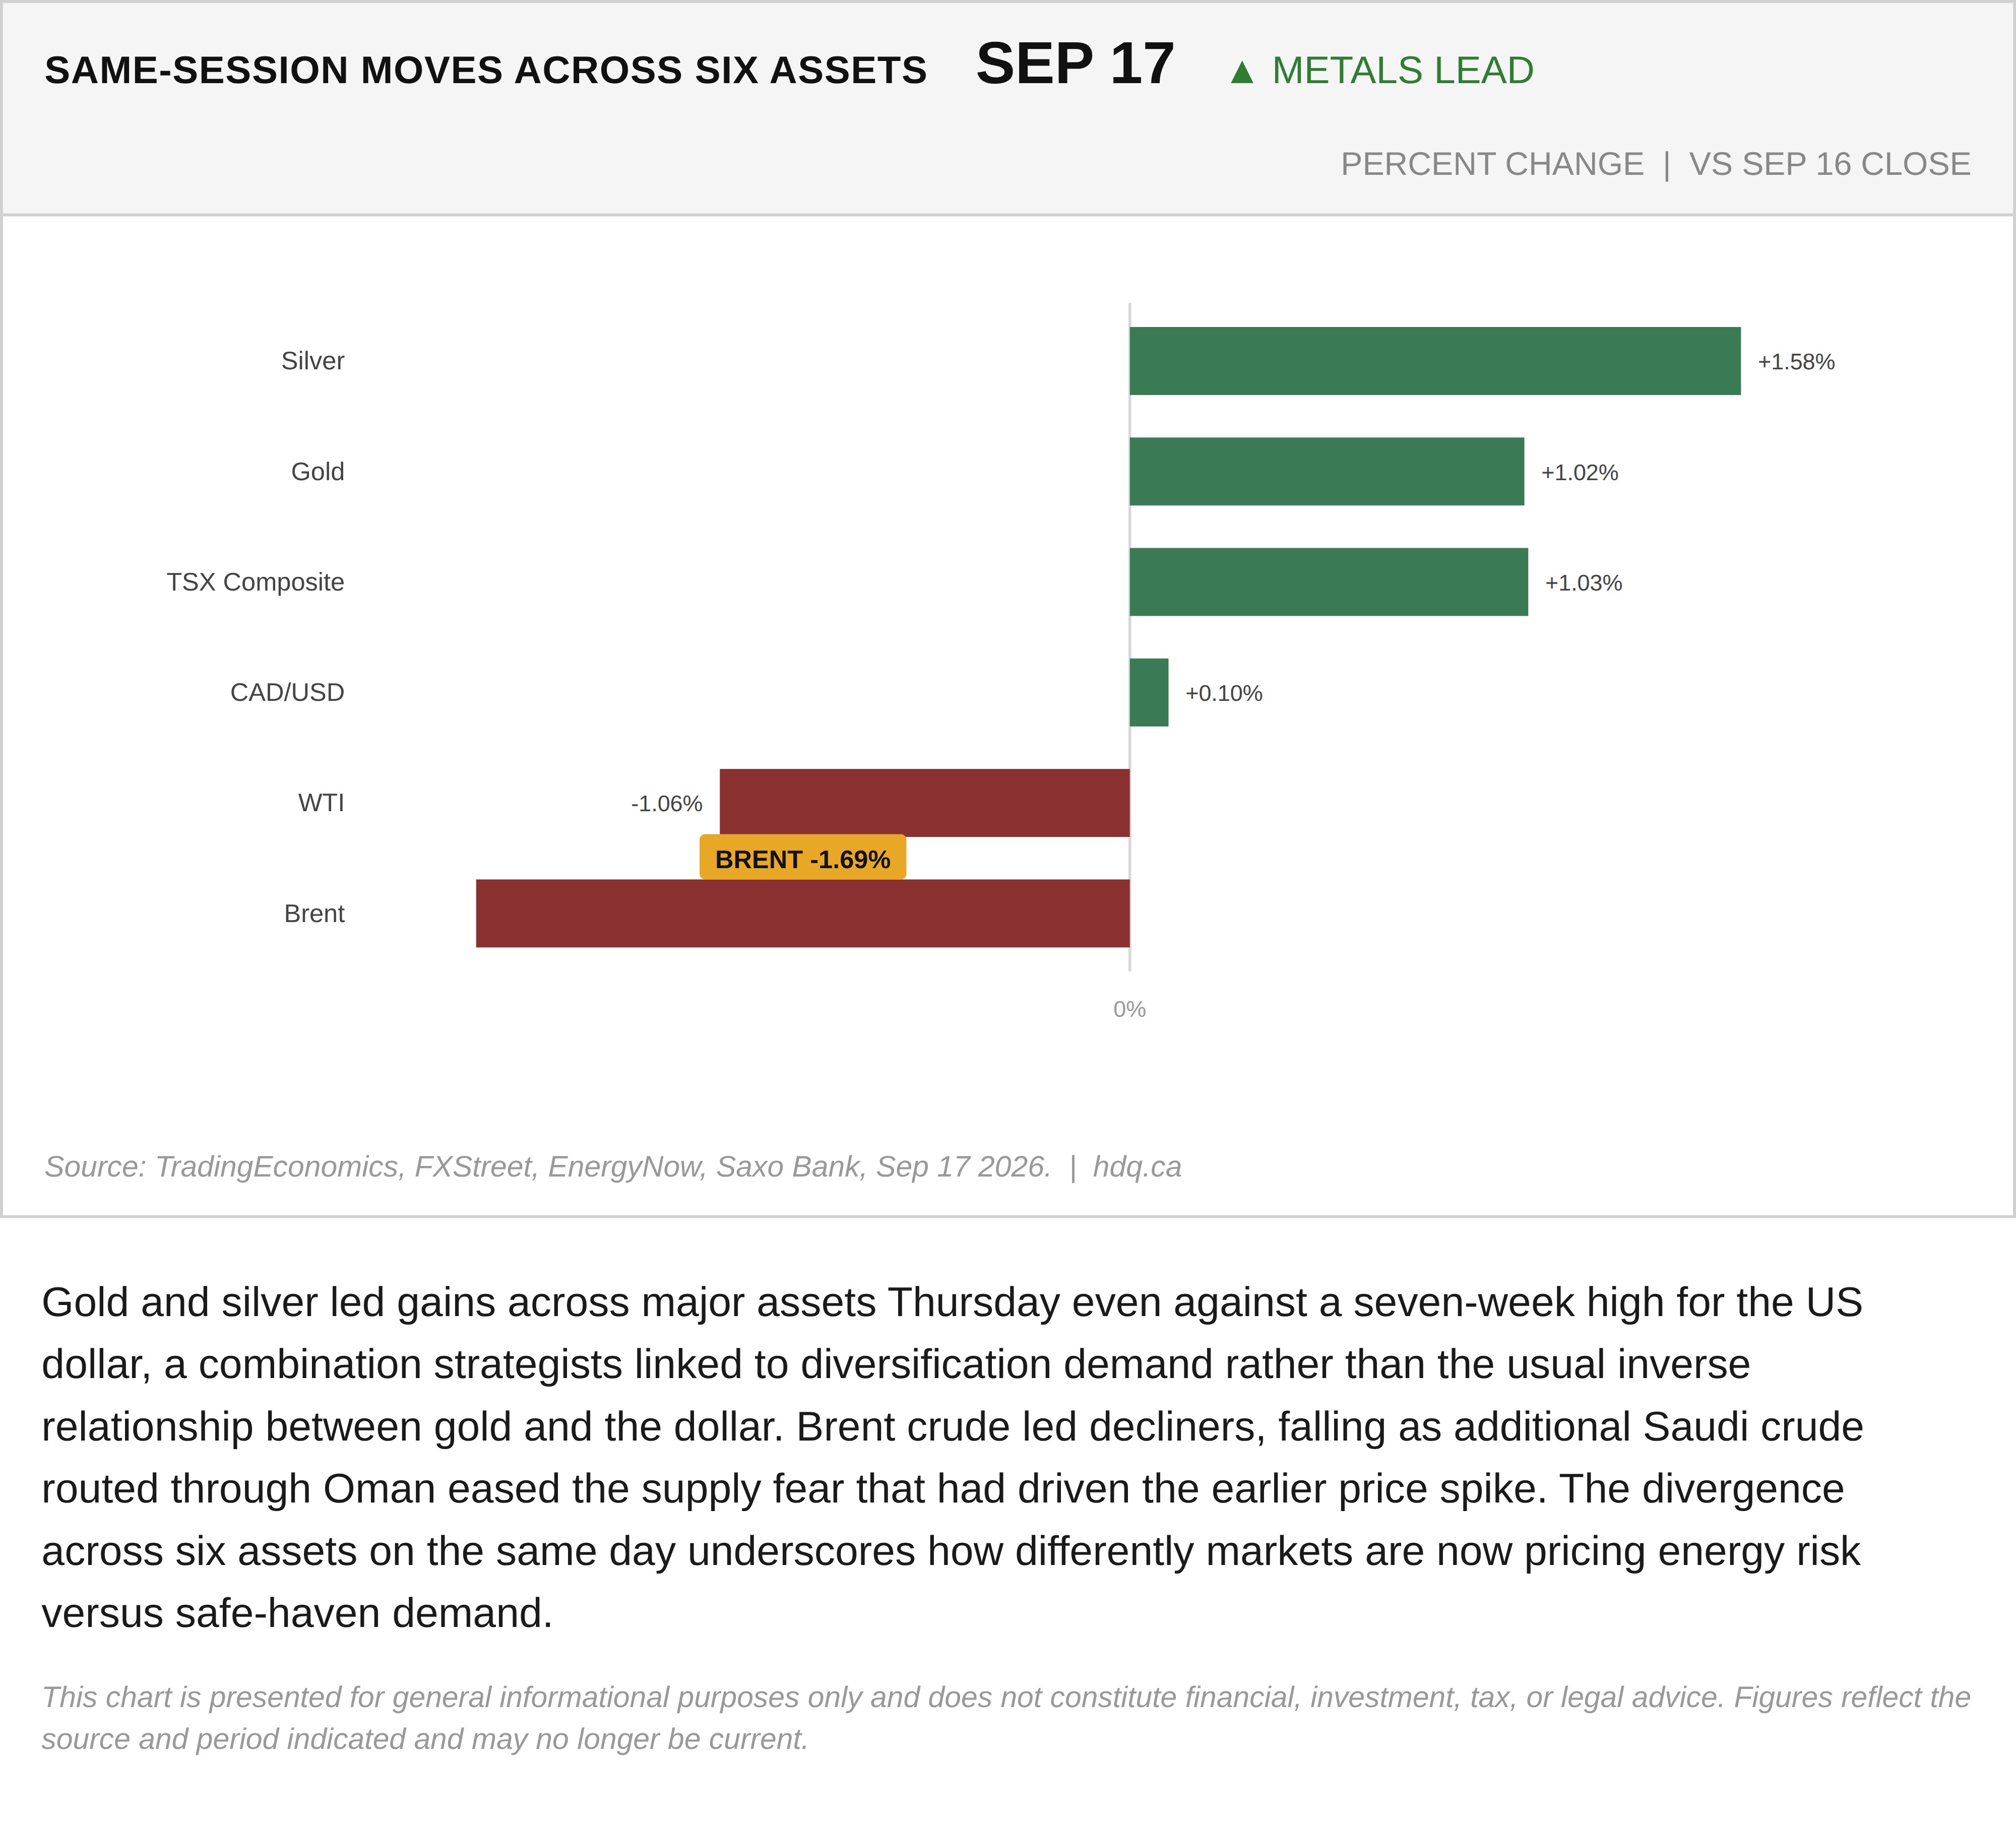
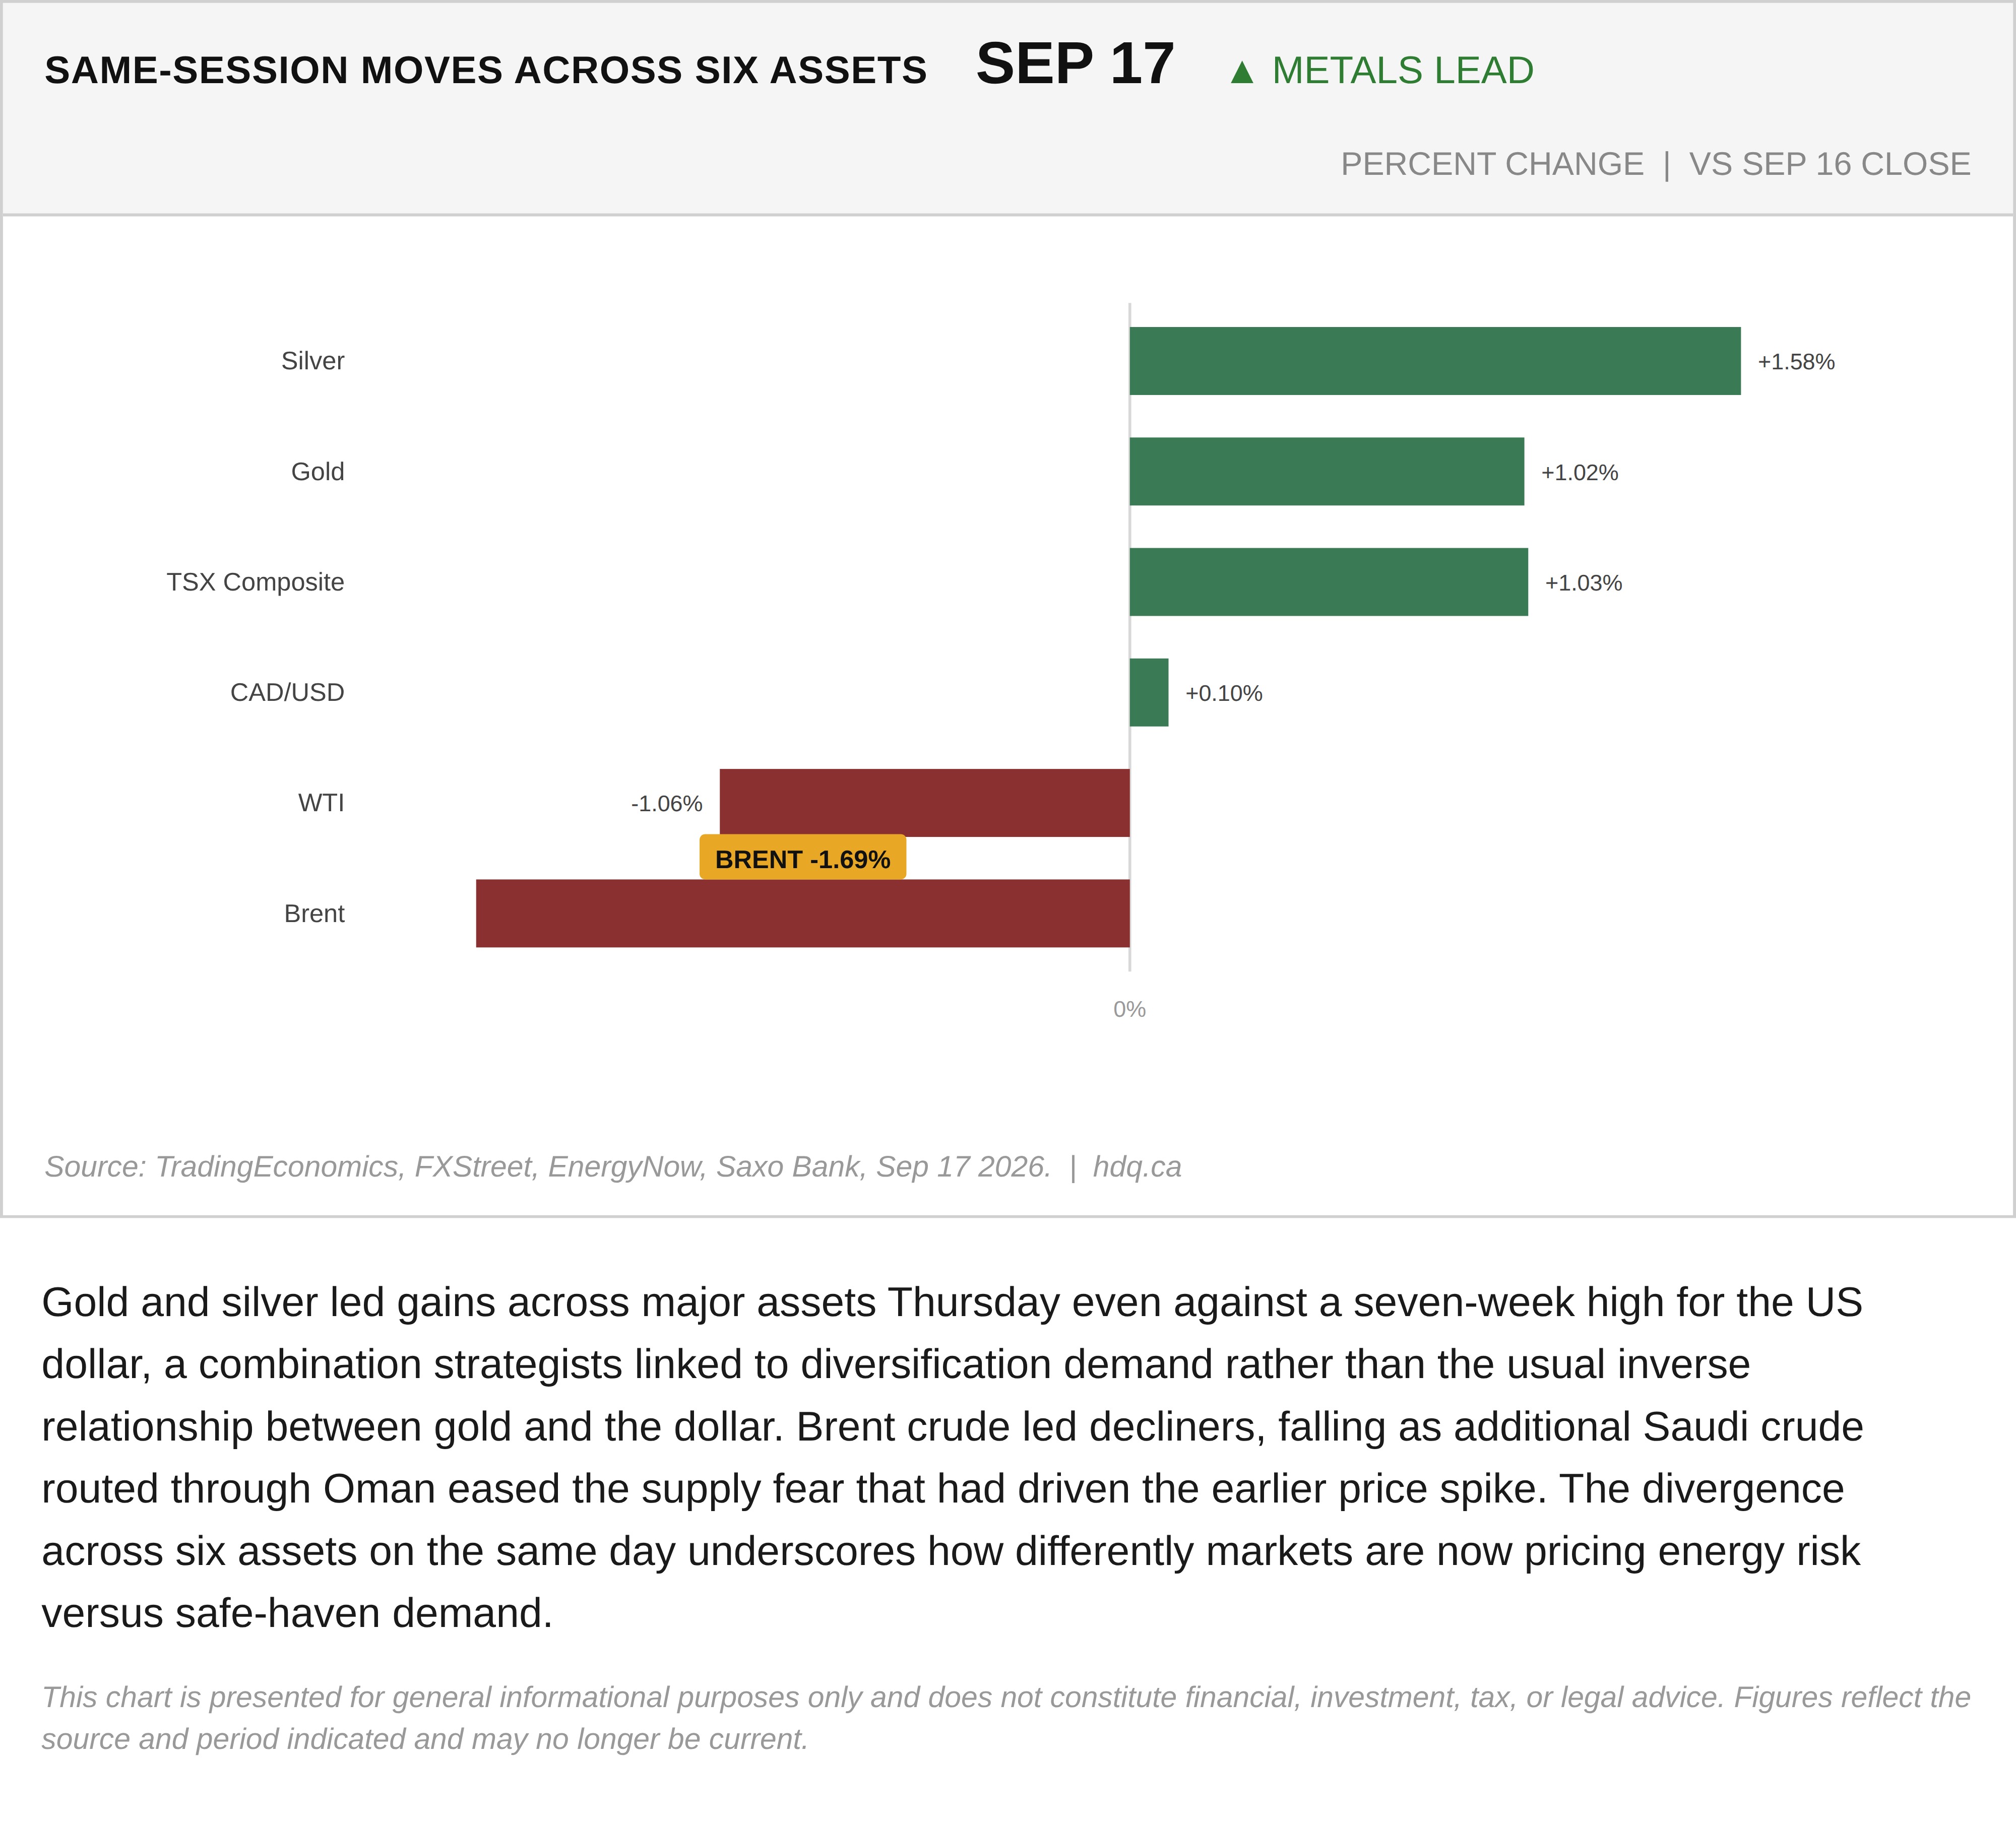
Gold and silver led gains across major assets Thursday even against a seven-week high for the US dollar, a combination strategists linked to diversification demand rather than the usual inverse relationship between gold and the dollar. Brent crude led decliners, falling as additional Saudi crude routed through Oman eased the supply fear that had driven the earlier price spike. The divergence across six assets on the same day underscores how differently markets are now pricing energy risk versus safe-haven demand.
This chart is presented for general informational purposes only and does not constitute financial, investment, tax, or legal advice. Figures reflect the source and period indicated and may no longer be current.
Related charts
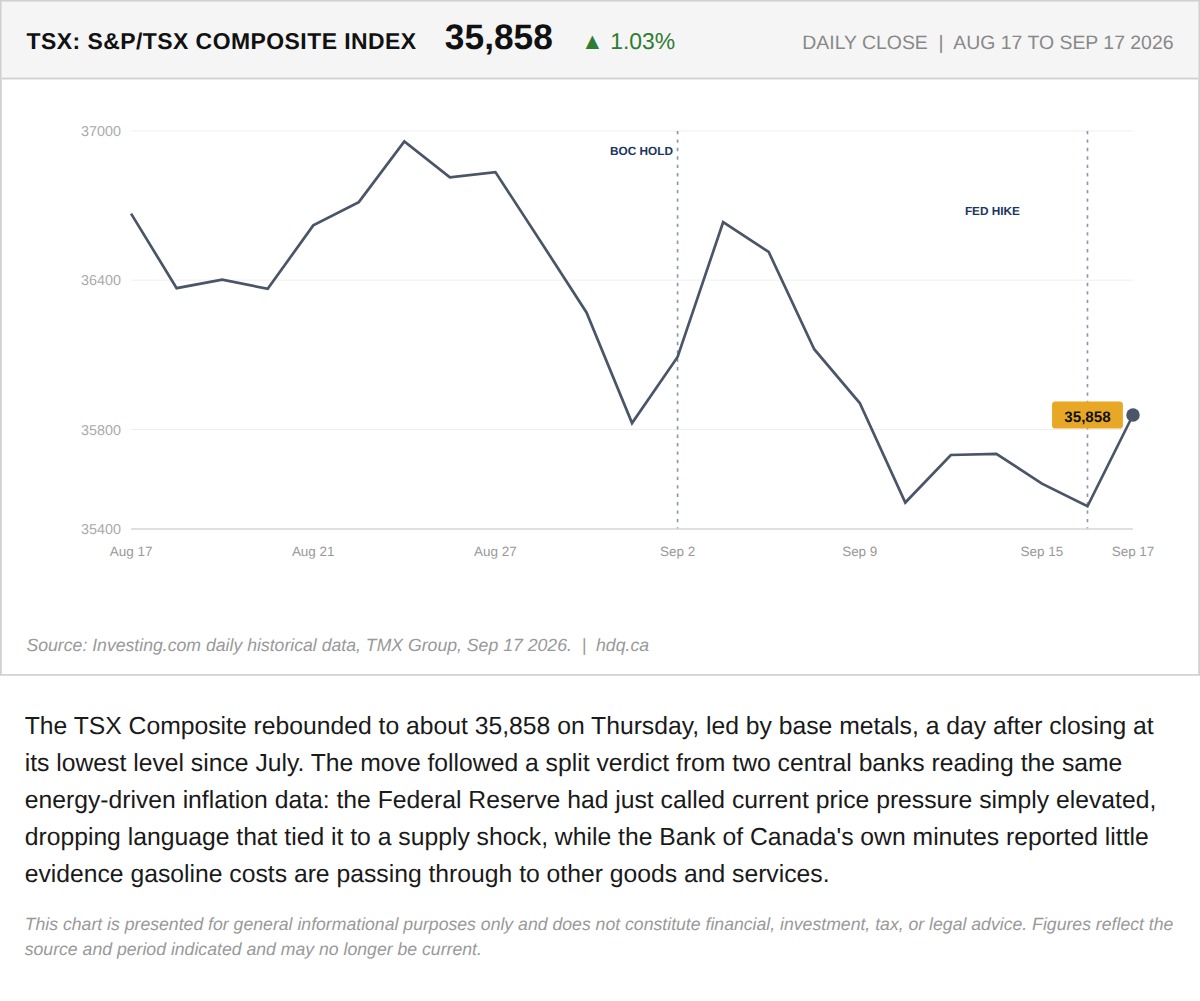
The TSX Composite rebounded to about 35,858 on Thursday, led by base metals, a day after closing at its lowest level since July.
The Fed Called an Oil Shock Elevated the Same Day the BoC Found No Sign It Has Spread
September 17, 2026
View chart & download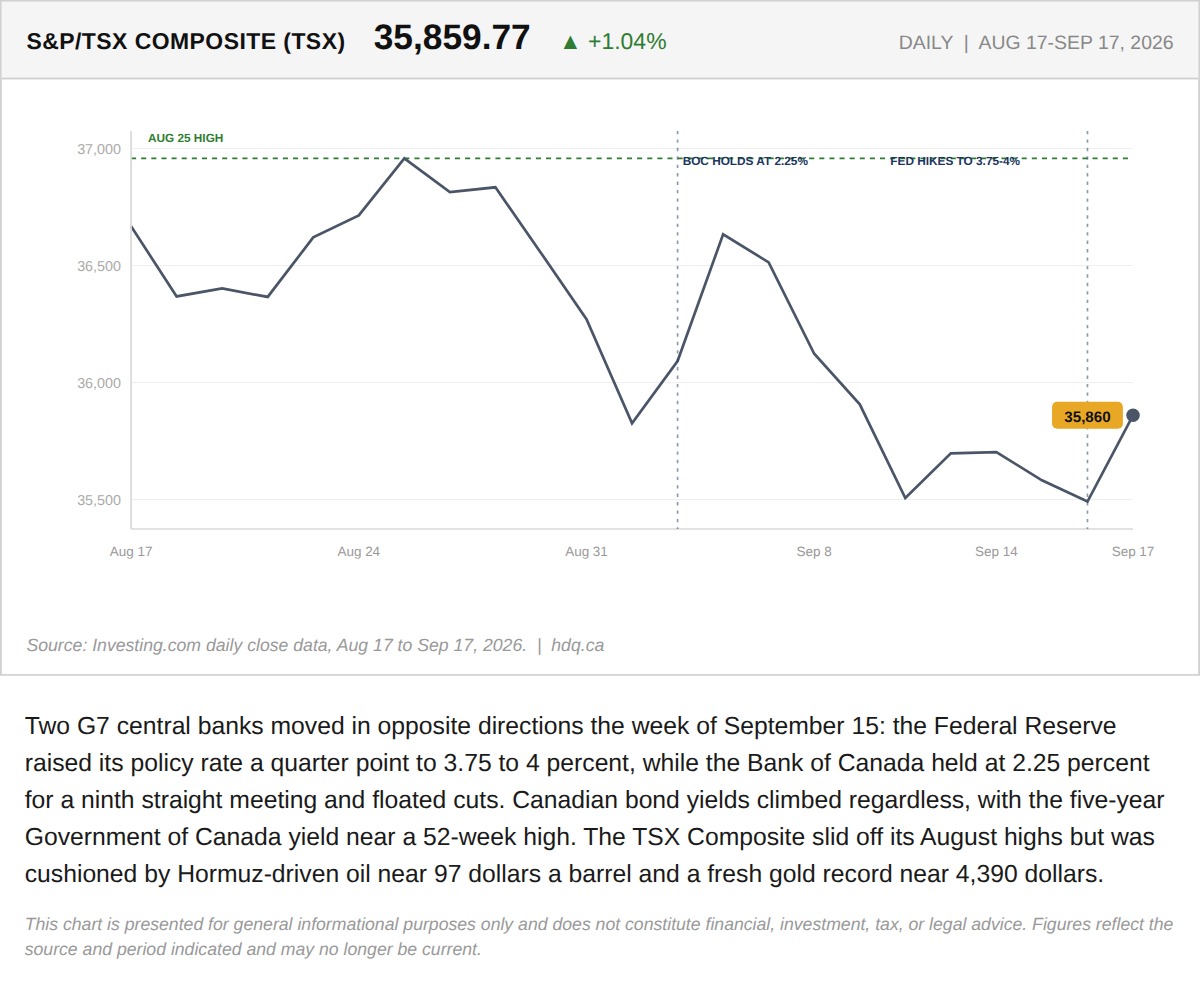
Two G7 central banks moved in opposite directions the week of September 15: the Federal Reserve raised its policy rate a quarter point to…
The Week the Bank of Canada's Own Rate Stopped Setting Canadian Borrowing Costs
September 19, 2026
View chart & download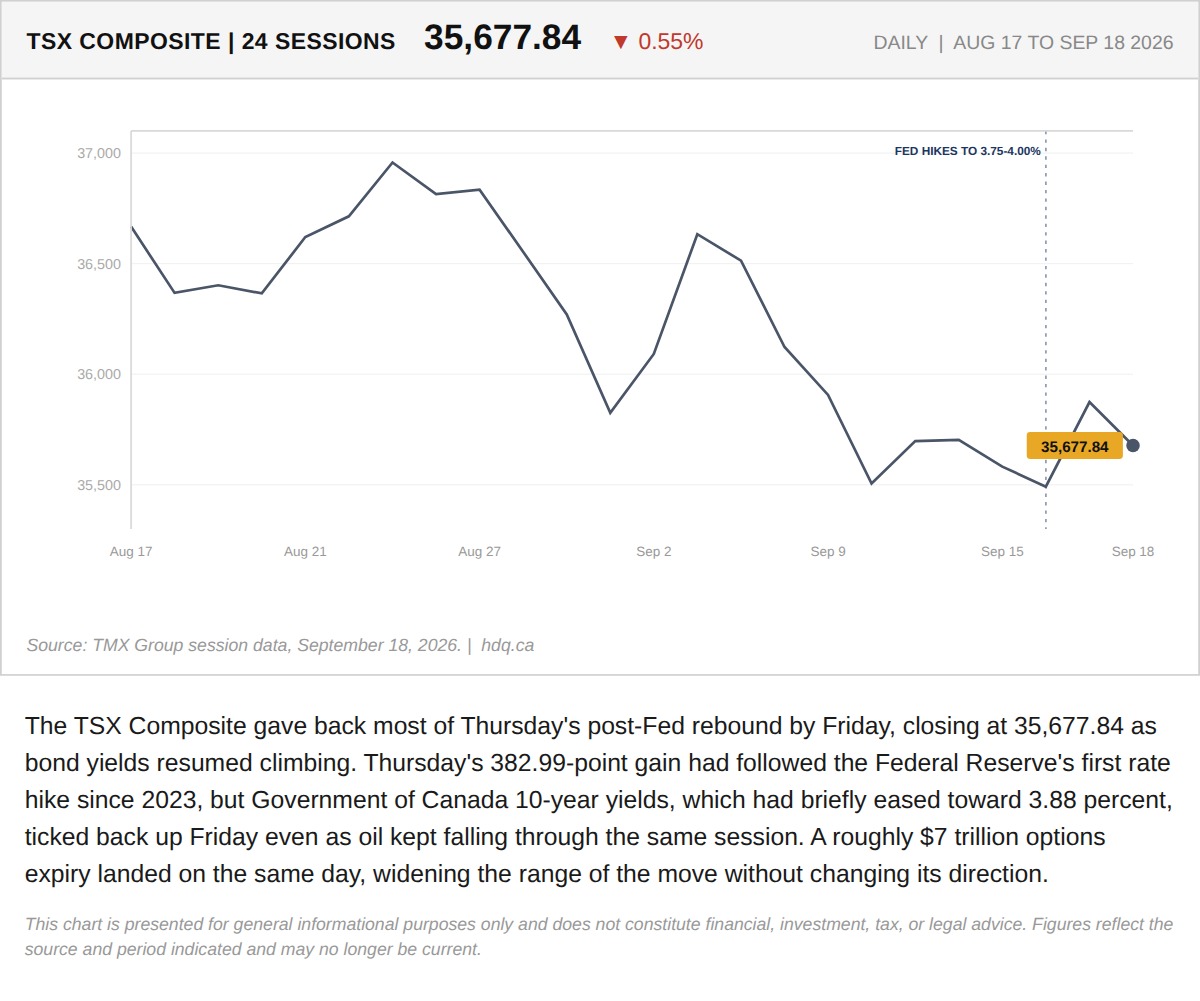
The TSX Composite gave back most of Thursday's post-Fed rebound by Friday, closing at 35,677.84 as bond yields resumed climbing.
TSX Gives Back Post-Fed Rally as Bond Yields Resume Climbing
September 18, 2026
View chart & download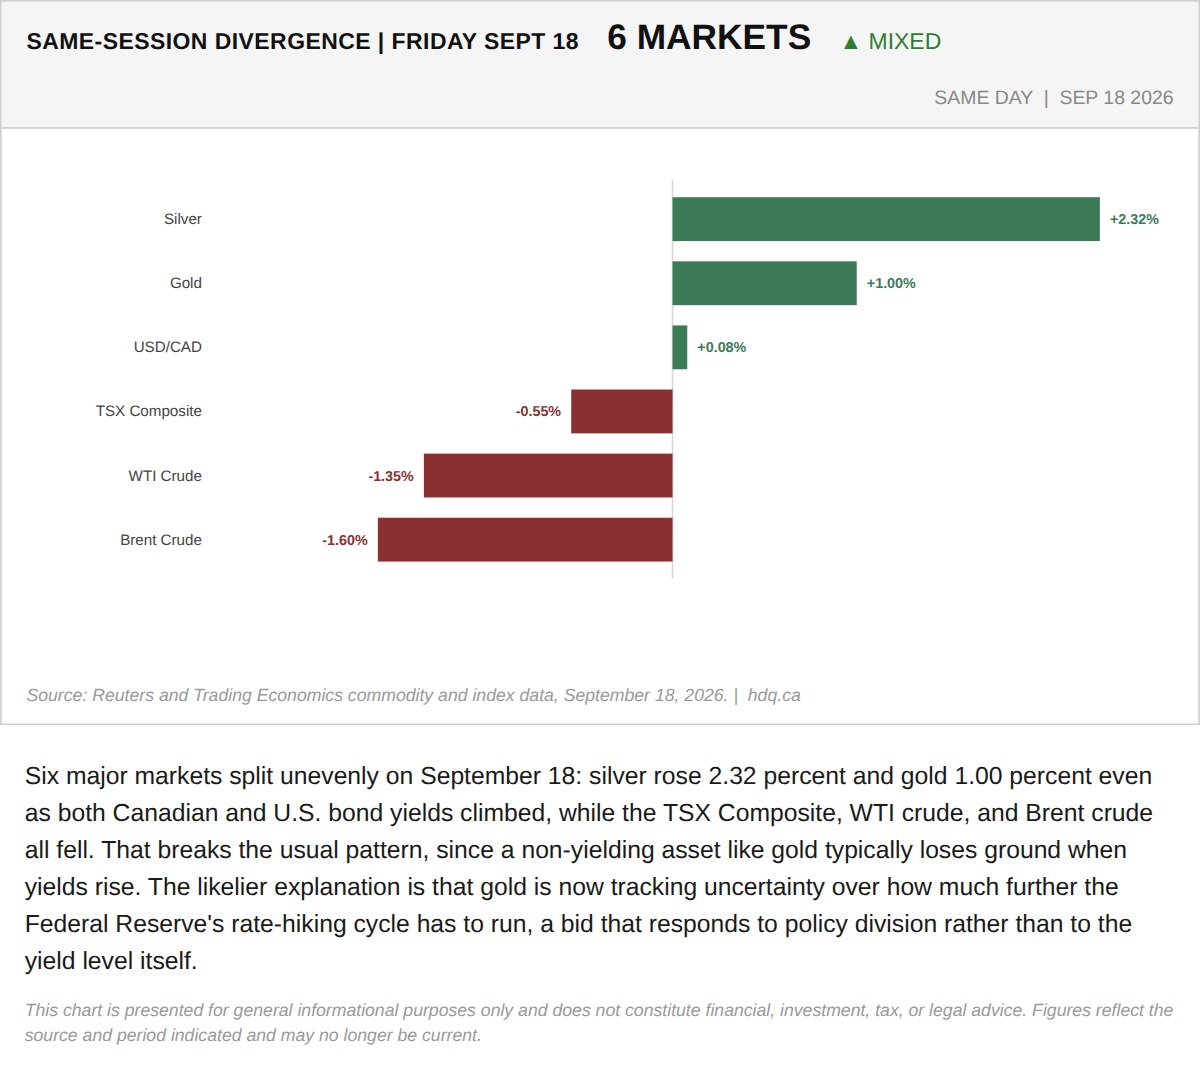
Six major markets split unevenly on September 18: silver rose 2.32 percent and gold 1.00 percent even as both Canadian and U.S.
Gold and Silver Rise With Yields, Breaking the Usual Pattern
September 18, 2026
View chart & download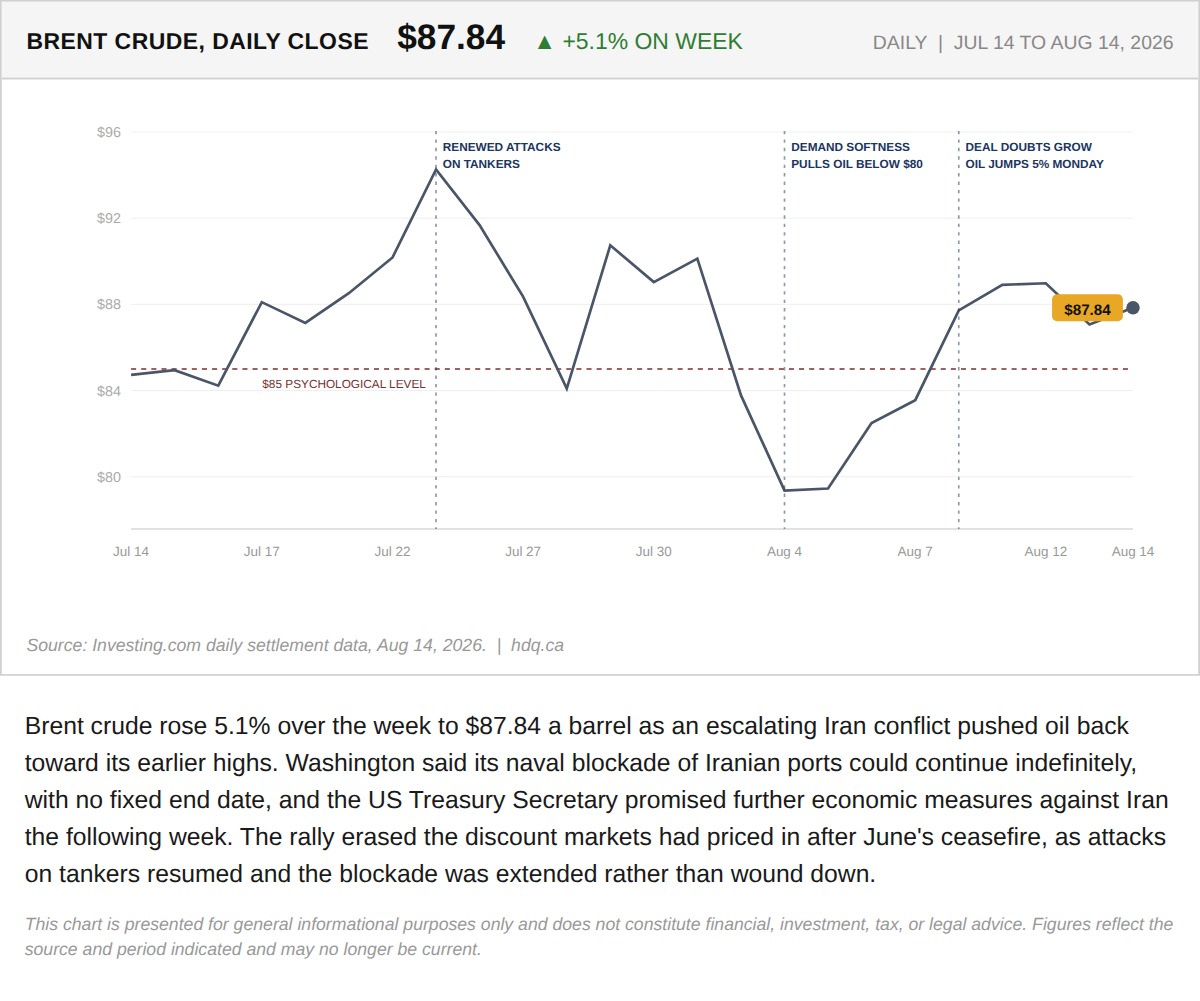
Brent crude rose 5.1% over the week to $87.84 a barrel as an escalating Iran conflict pushed oil back toward its earlier highs.
The TSX and Gold Both Set Records This Week. That Should Not Happen Together.
August 15, 2026
View chart & download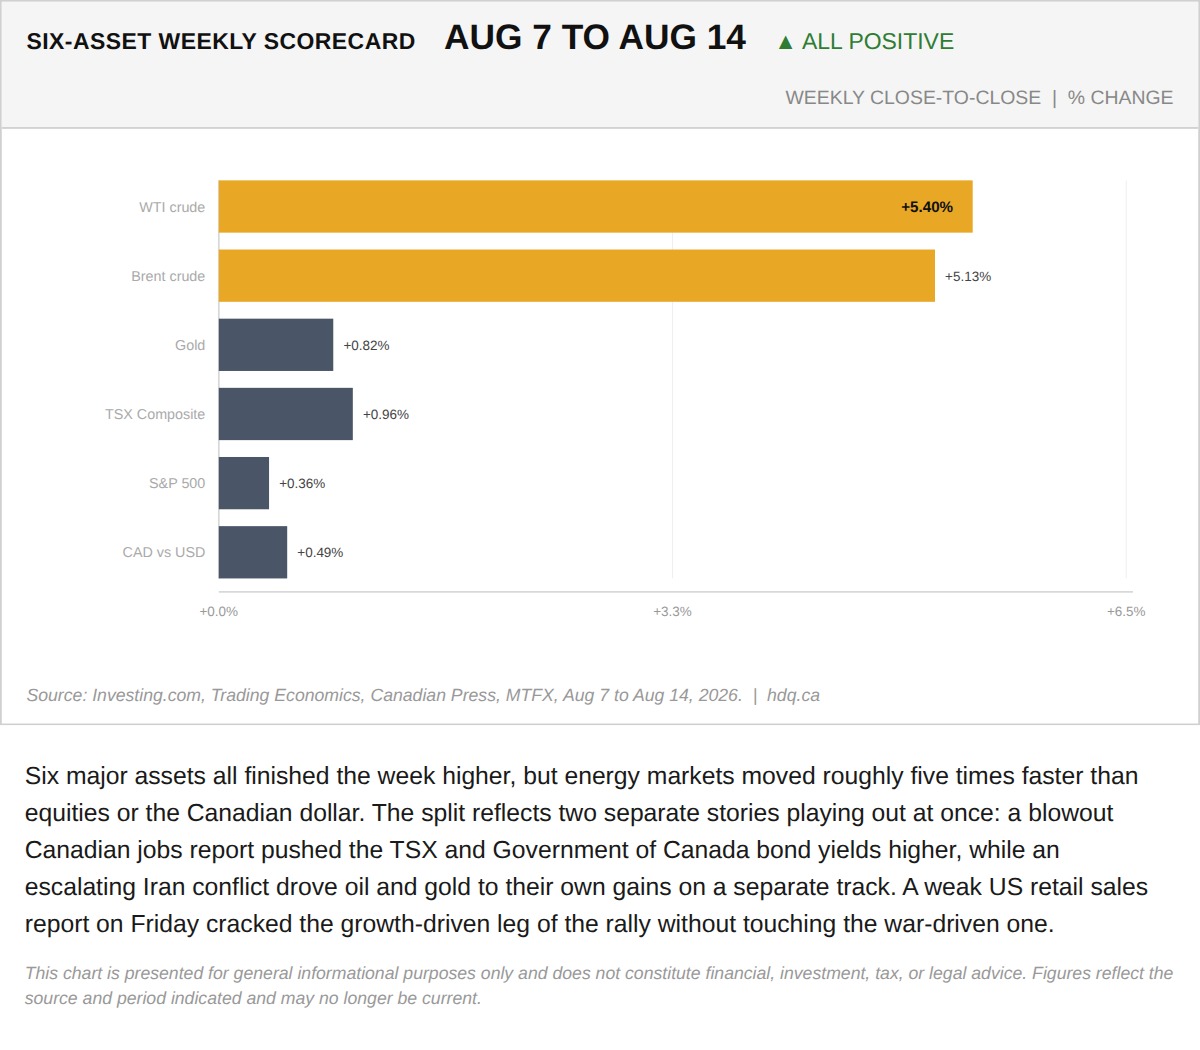
Six major assets all finished the week higher, but energy markets moved roughly five times faster than equities or the Canadian dollar.
The TSX and Gold Both Set Records This Week. That Should Not Happen Together.
August 15, 2026
View chart & download