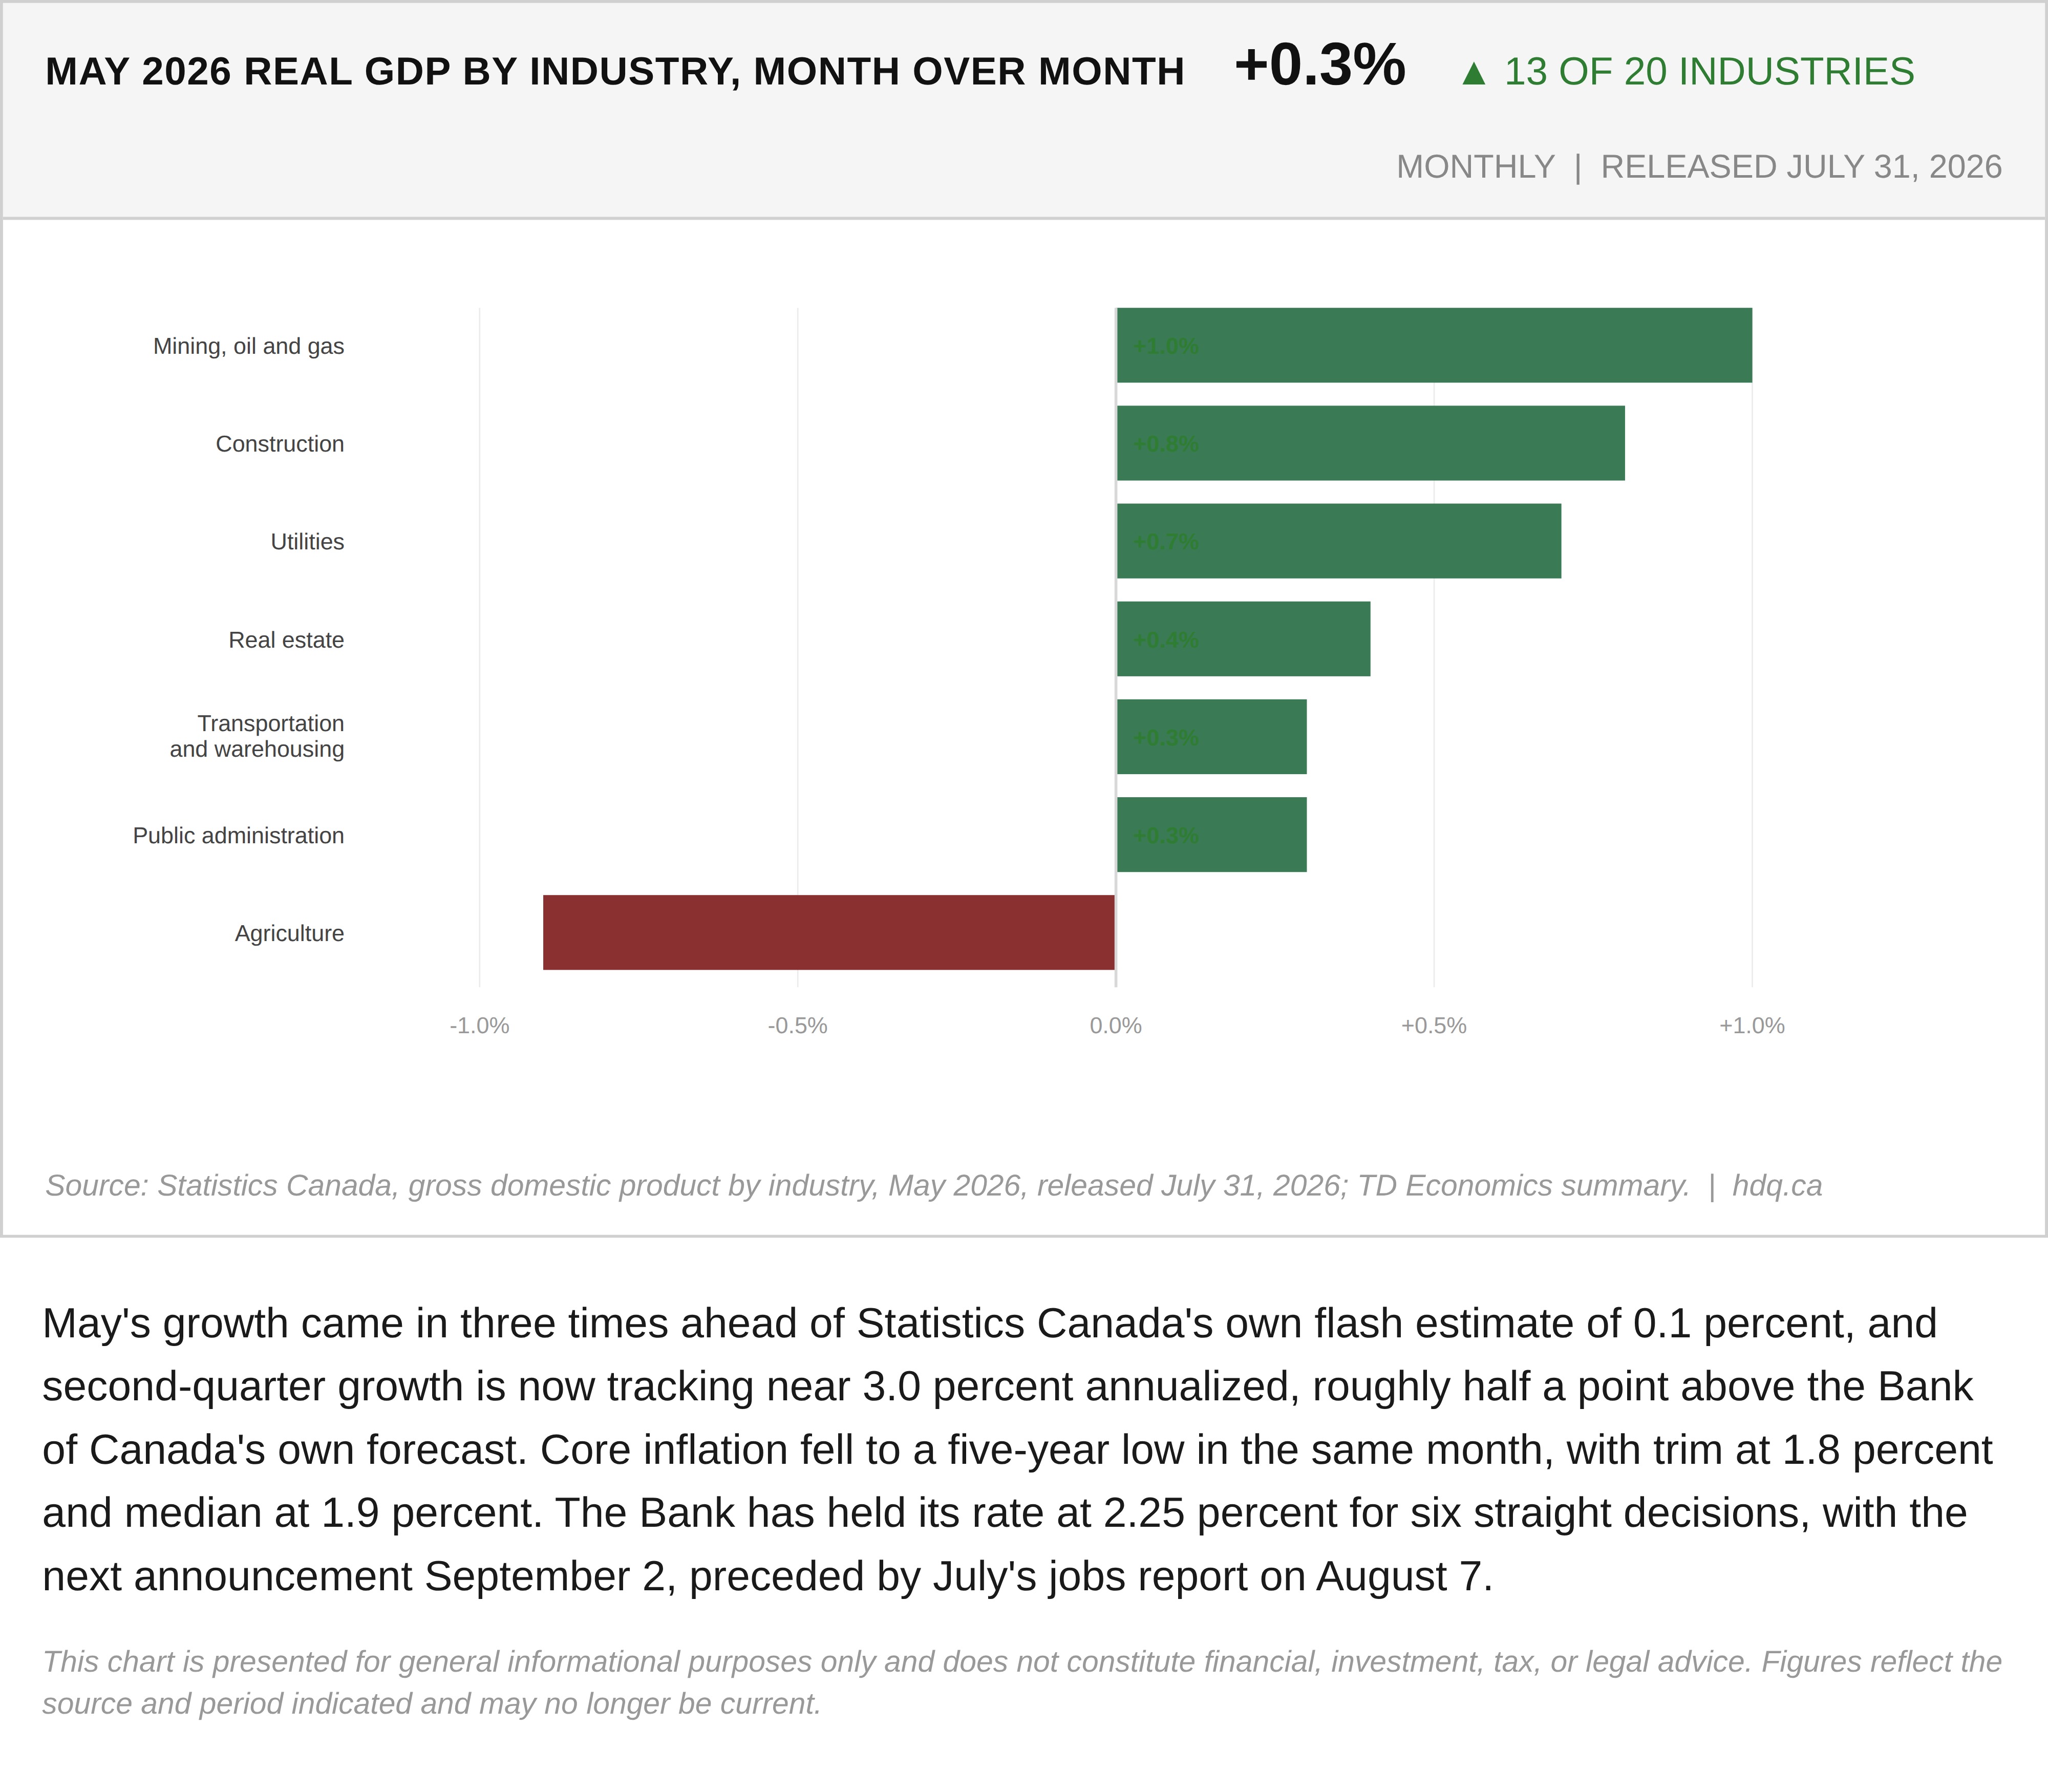
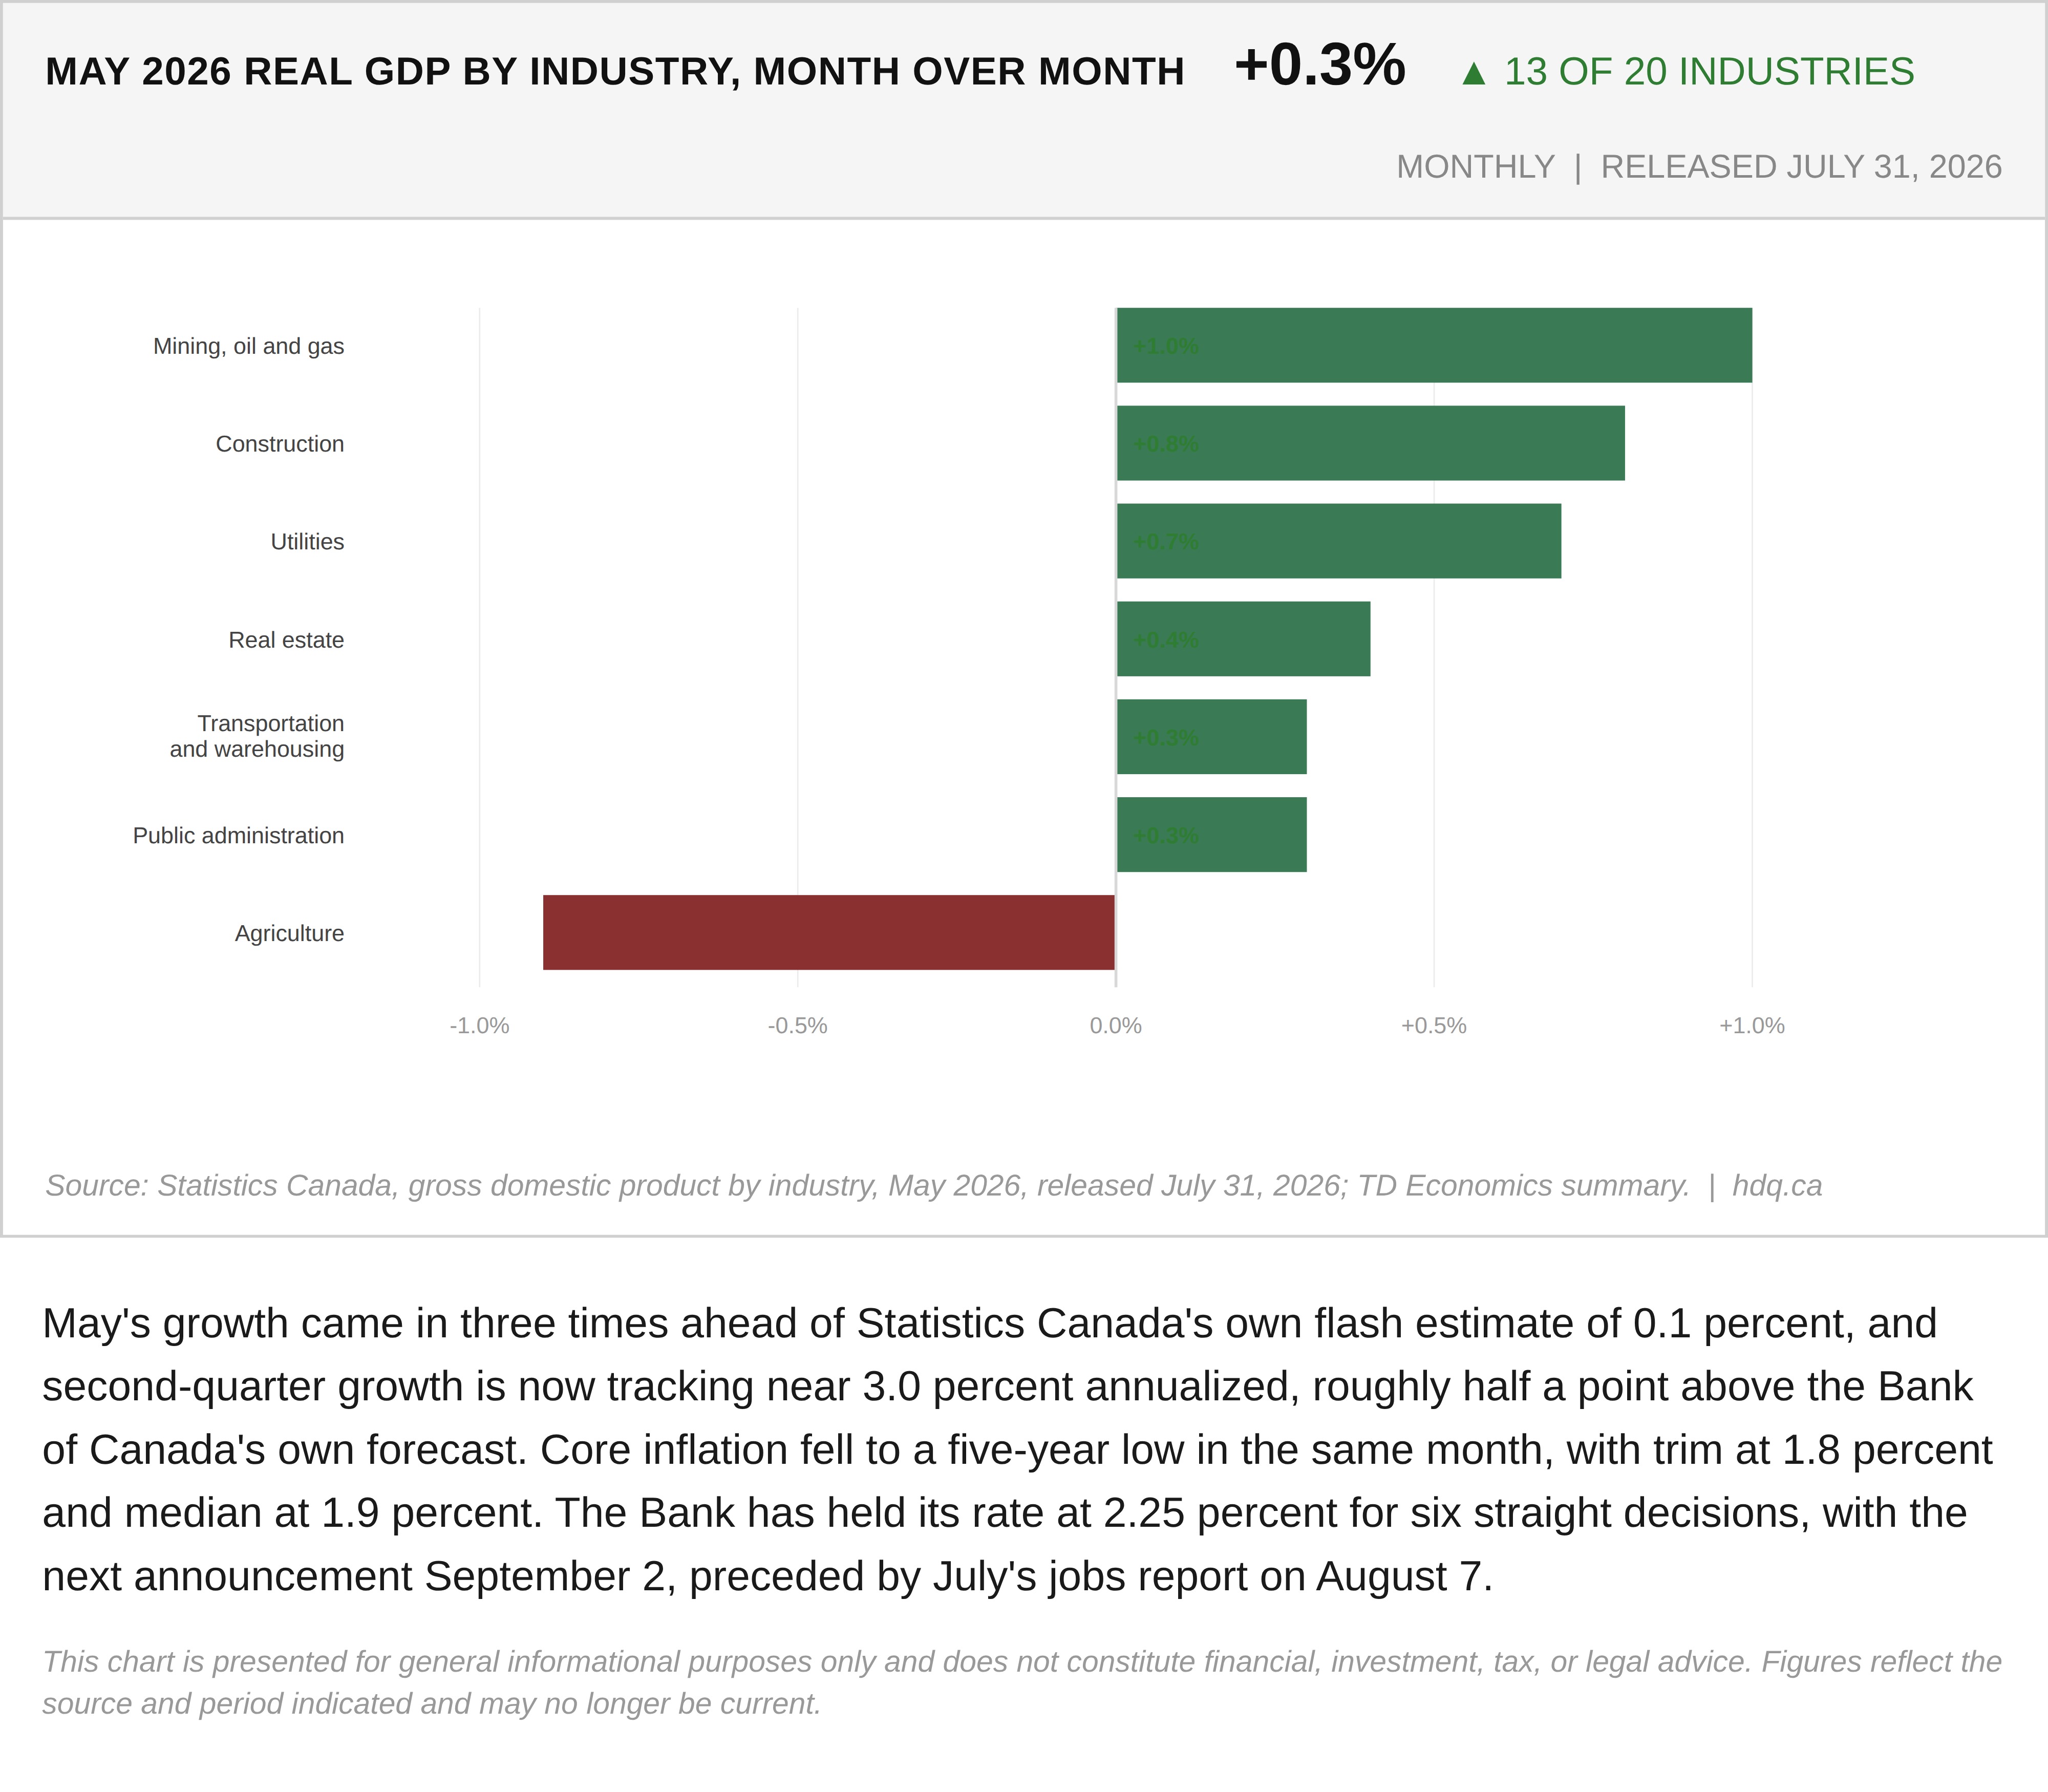
May's growth came in three times ahead of Statistics Canada's own flash estimate of 0.1 percent, and second-quarter growth is now tracking near 3.0 percent annualized, roughly half a point above the Bank of Canada's own forecast. Core inflation fell to a five-year low in the same month, with trim at 1.8 percent and median at 1.9 percent. The Bank has held its rate at 2.25 percent for six straight decisions, with the next announcement September 2, preceded by July's jobs report on August 7.
This chart is presented for general informational purposes only and does not constitute financial, investment, tax, or legal advice. Figures reflect the source and period indicated and may no longer be current.
Related charts
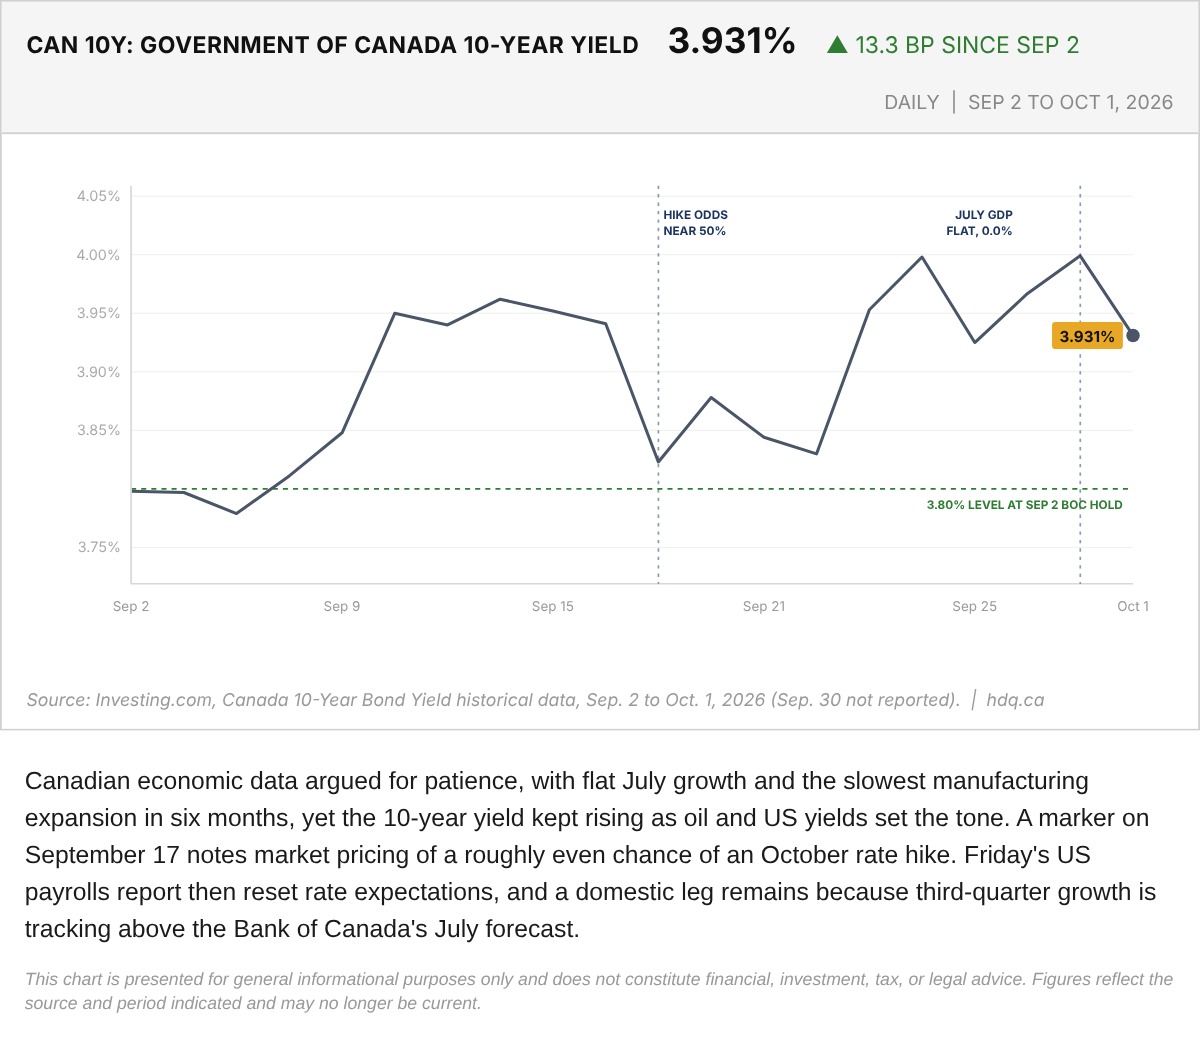
Canadian economic data argued for patience, with flat July growth and the slowest manufacturing expansion in six months, yet the 10-year…
Government of Canada 10-Year Bond Yield, September 2 to October 1, 2026
October 3, 2026
View chart & download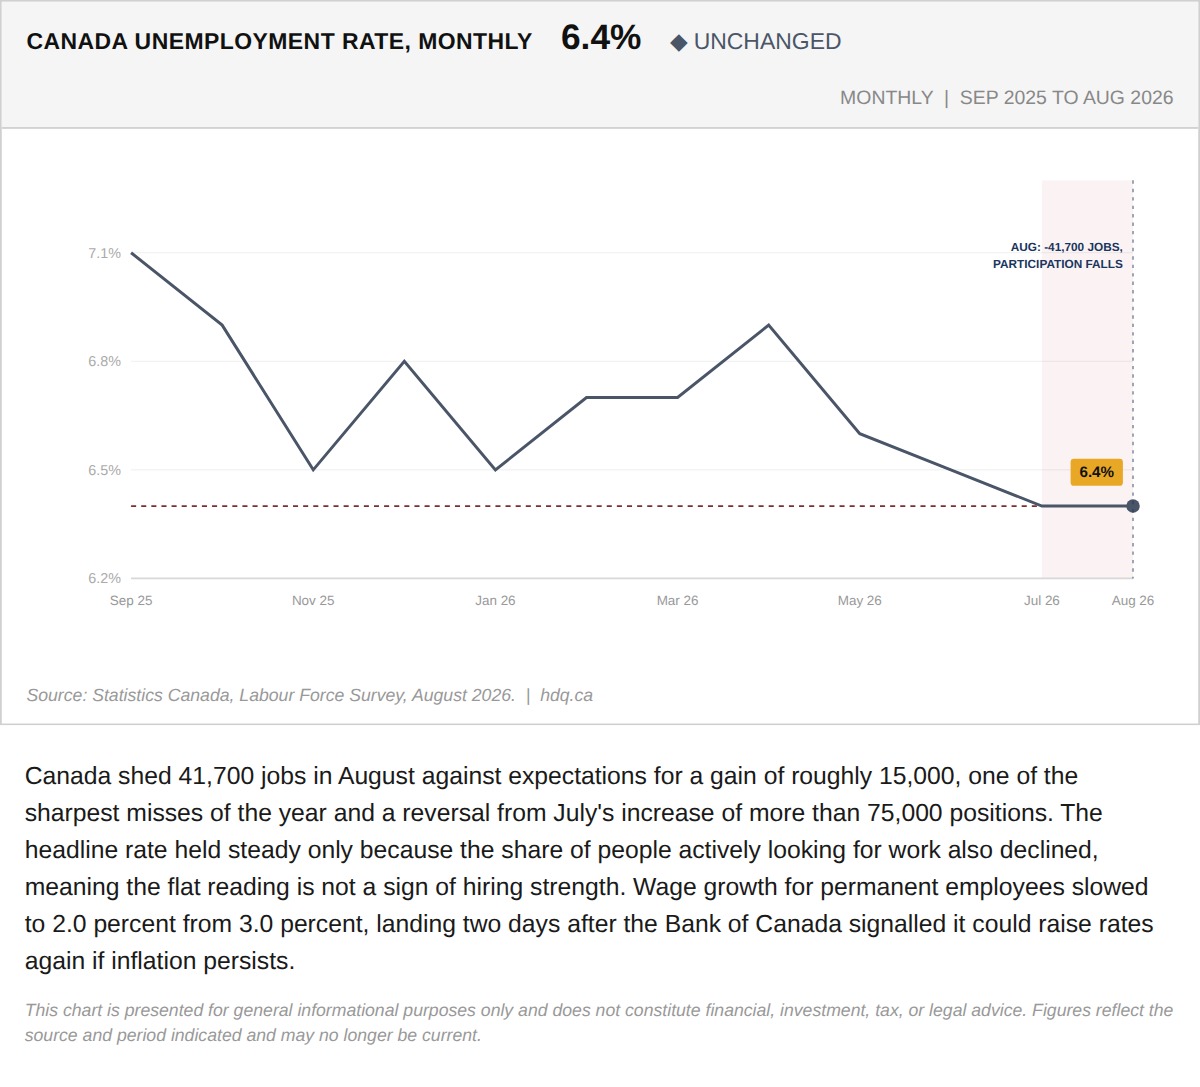
Canada shed 41,700 jobs in August against expectations for a gain of roughly 15,000, one of the sharpest misses of the year and a reversal…
Canada Lost 41,700 Jobs in August, Two Days After the Bank of Canada Signalled It Might Hike
September 4, 2026
View chart & download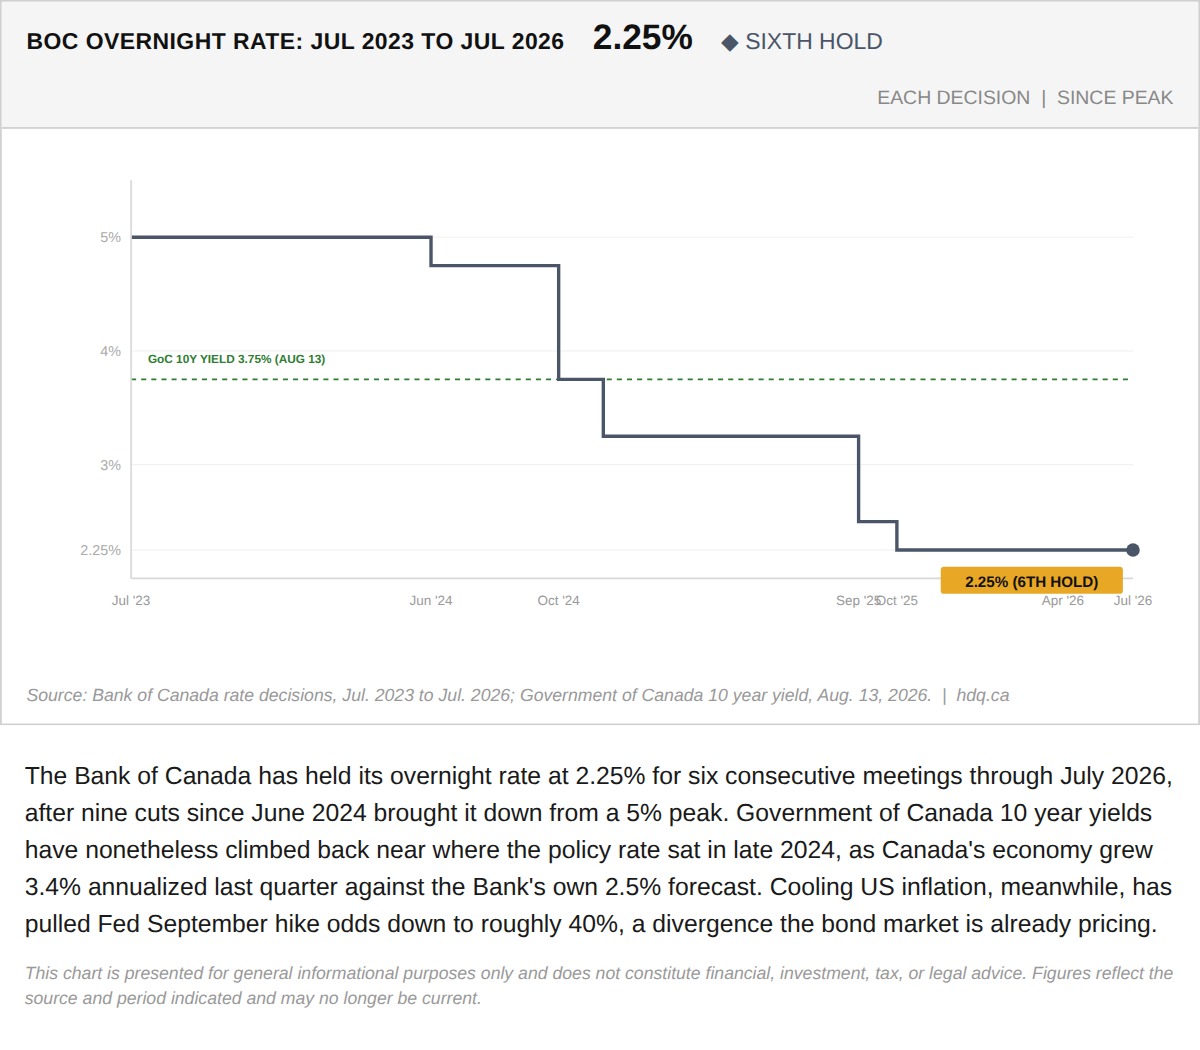
The Bank of Canada has held its overnight rate at 2.25% for six consecutive meetings through July 2026, after nine cuts since June 2024 brought it down from a 5% peak.
The Bank of Canada Held. The Bond Market Didn't Wait.
August 14, 2026
View chart & download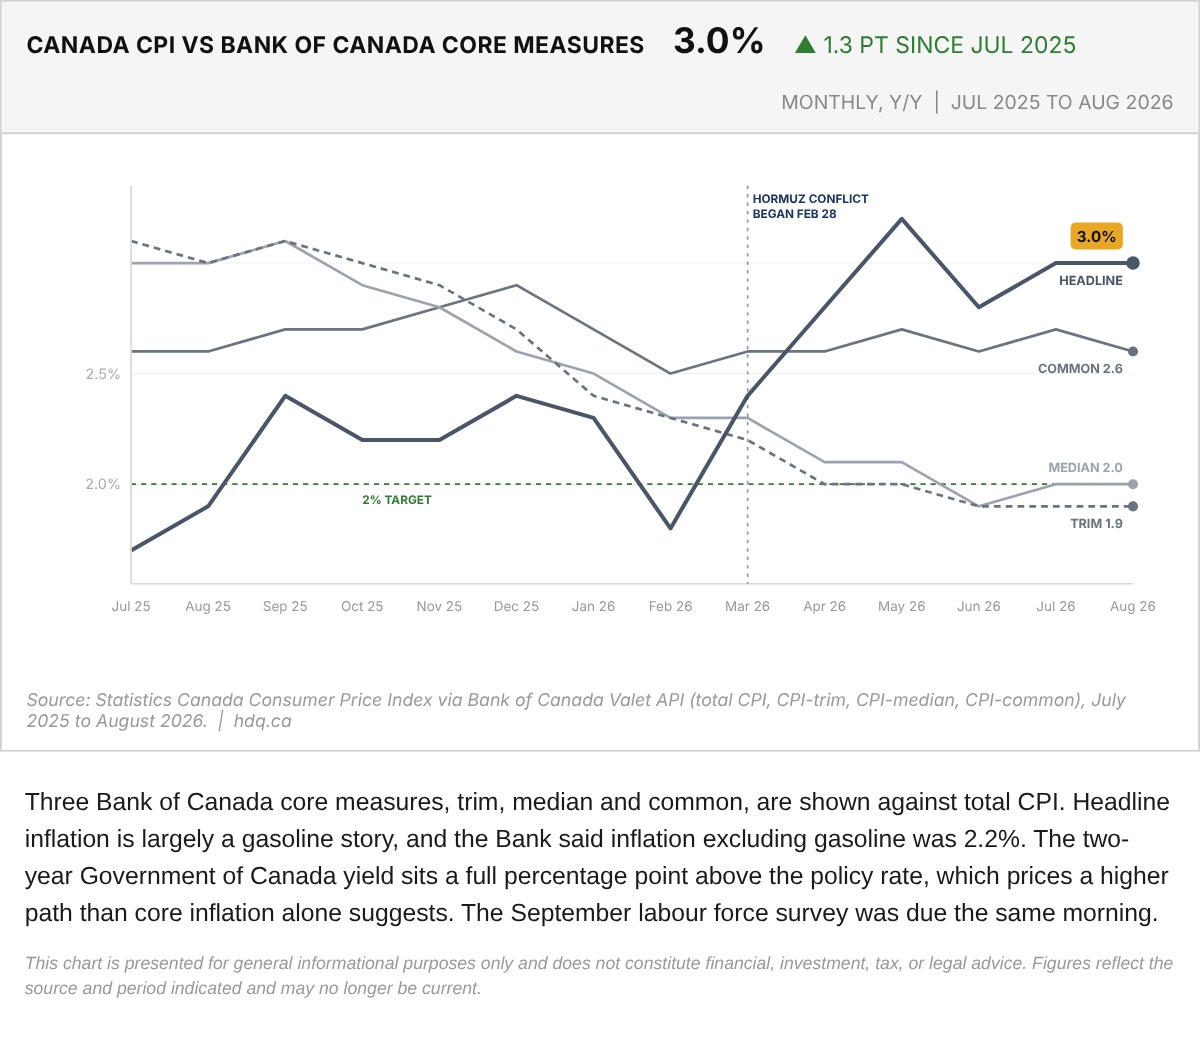
Three Bank of Canada core measures, trim, median and common, are shown against total CPI.
Canada CPI Against Bank of Canada Core Measures, July 2025 to August 2026
October 9, 2026
View chart & download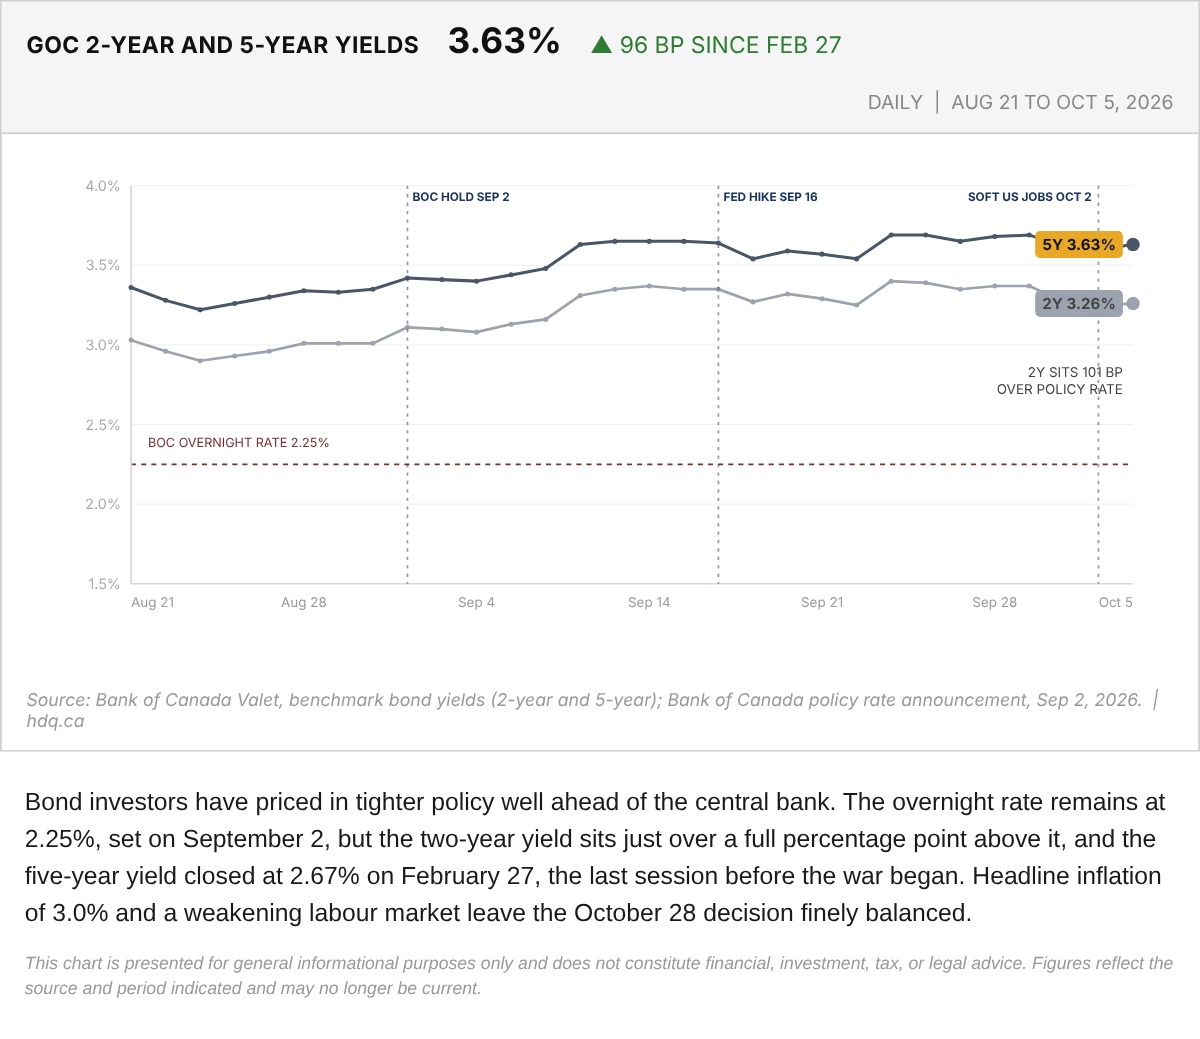
Bond investors have priced in tighter policy well ahead of the central bank.
Government of Canada 2-Year and 5-Year Yields Since the Pre-War Close
October 7, 2026
View chart & download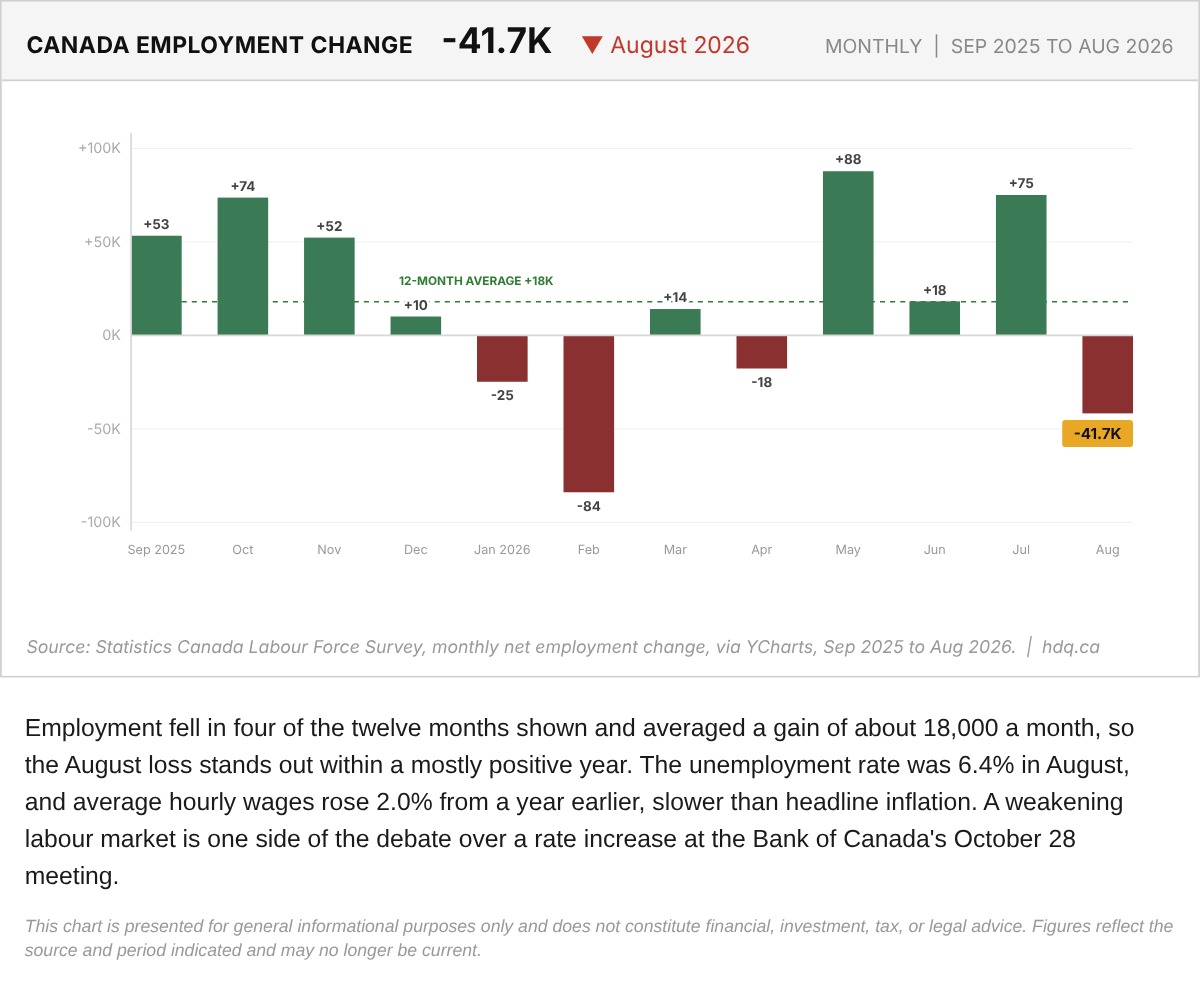
Employment fell in four of the twelve months shown and averaged a gain of about 18,000 a month, so the August loss stands out within a mostly positive year.
Canada Monthly Net Employment Change, September 2025 to August 2026
October 6, 2026
View chart & download