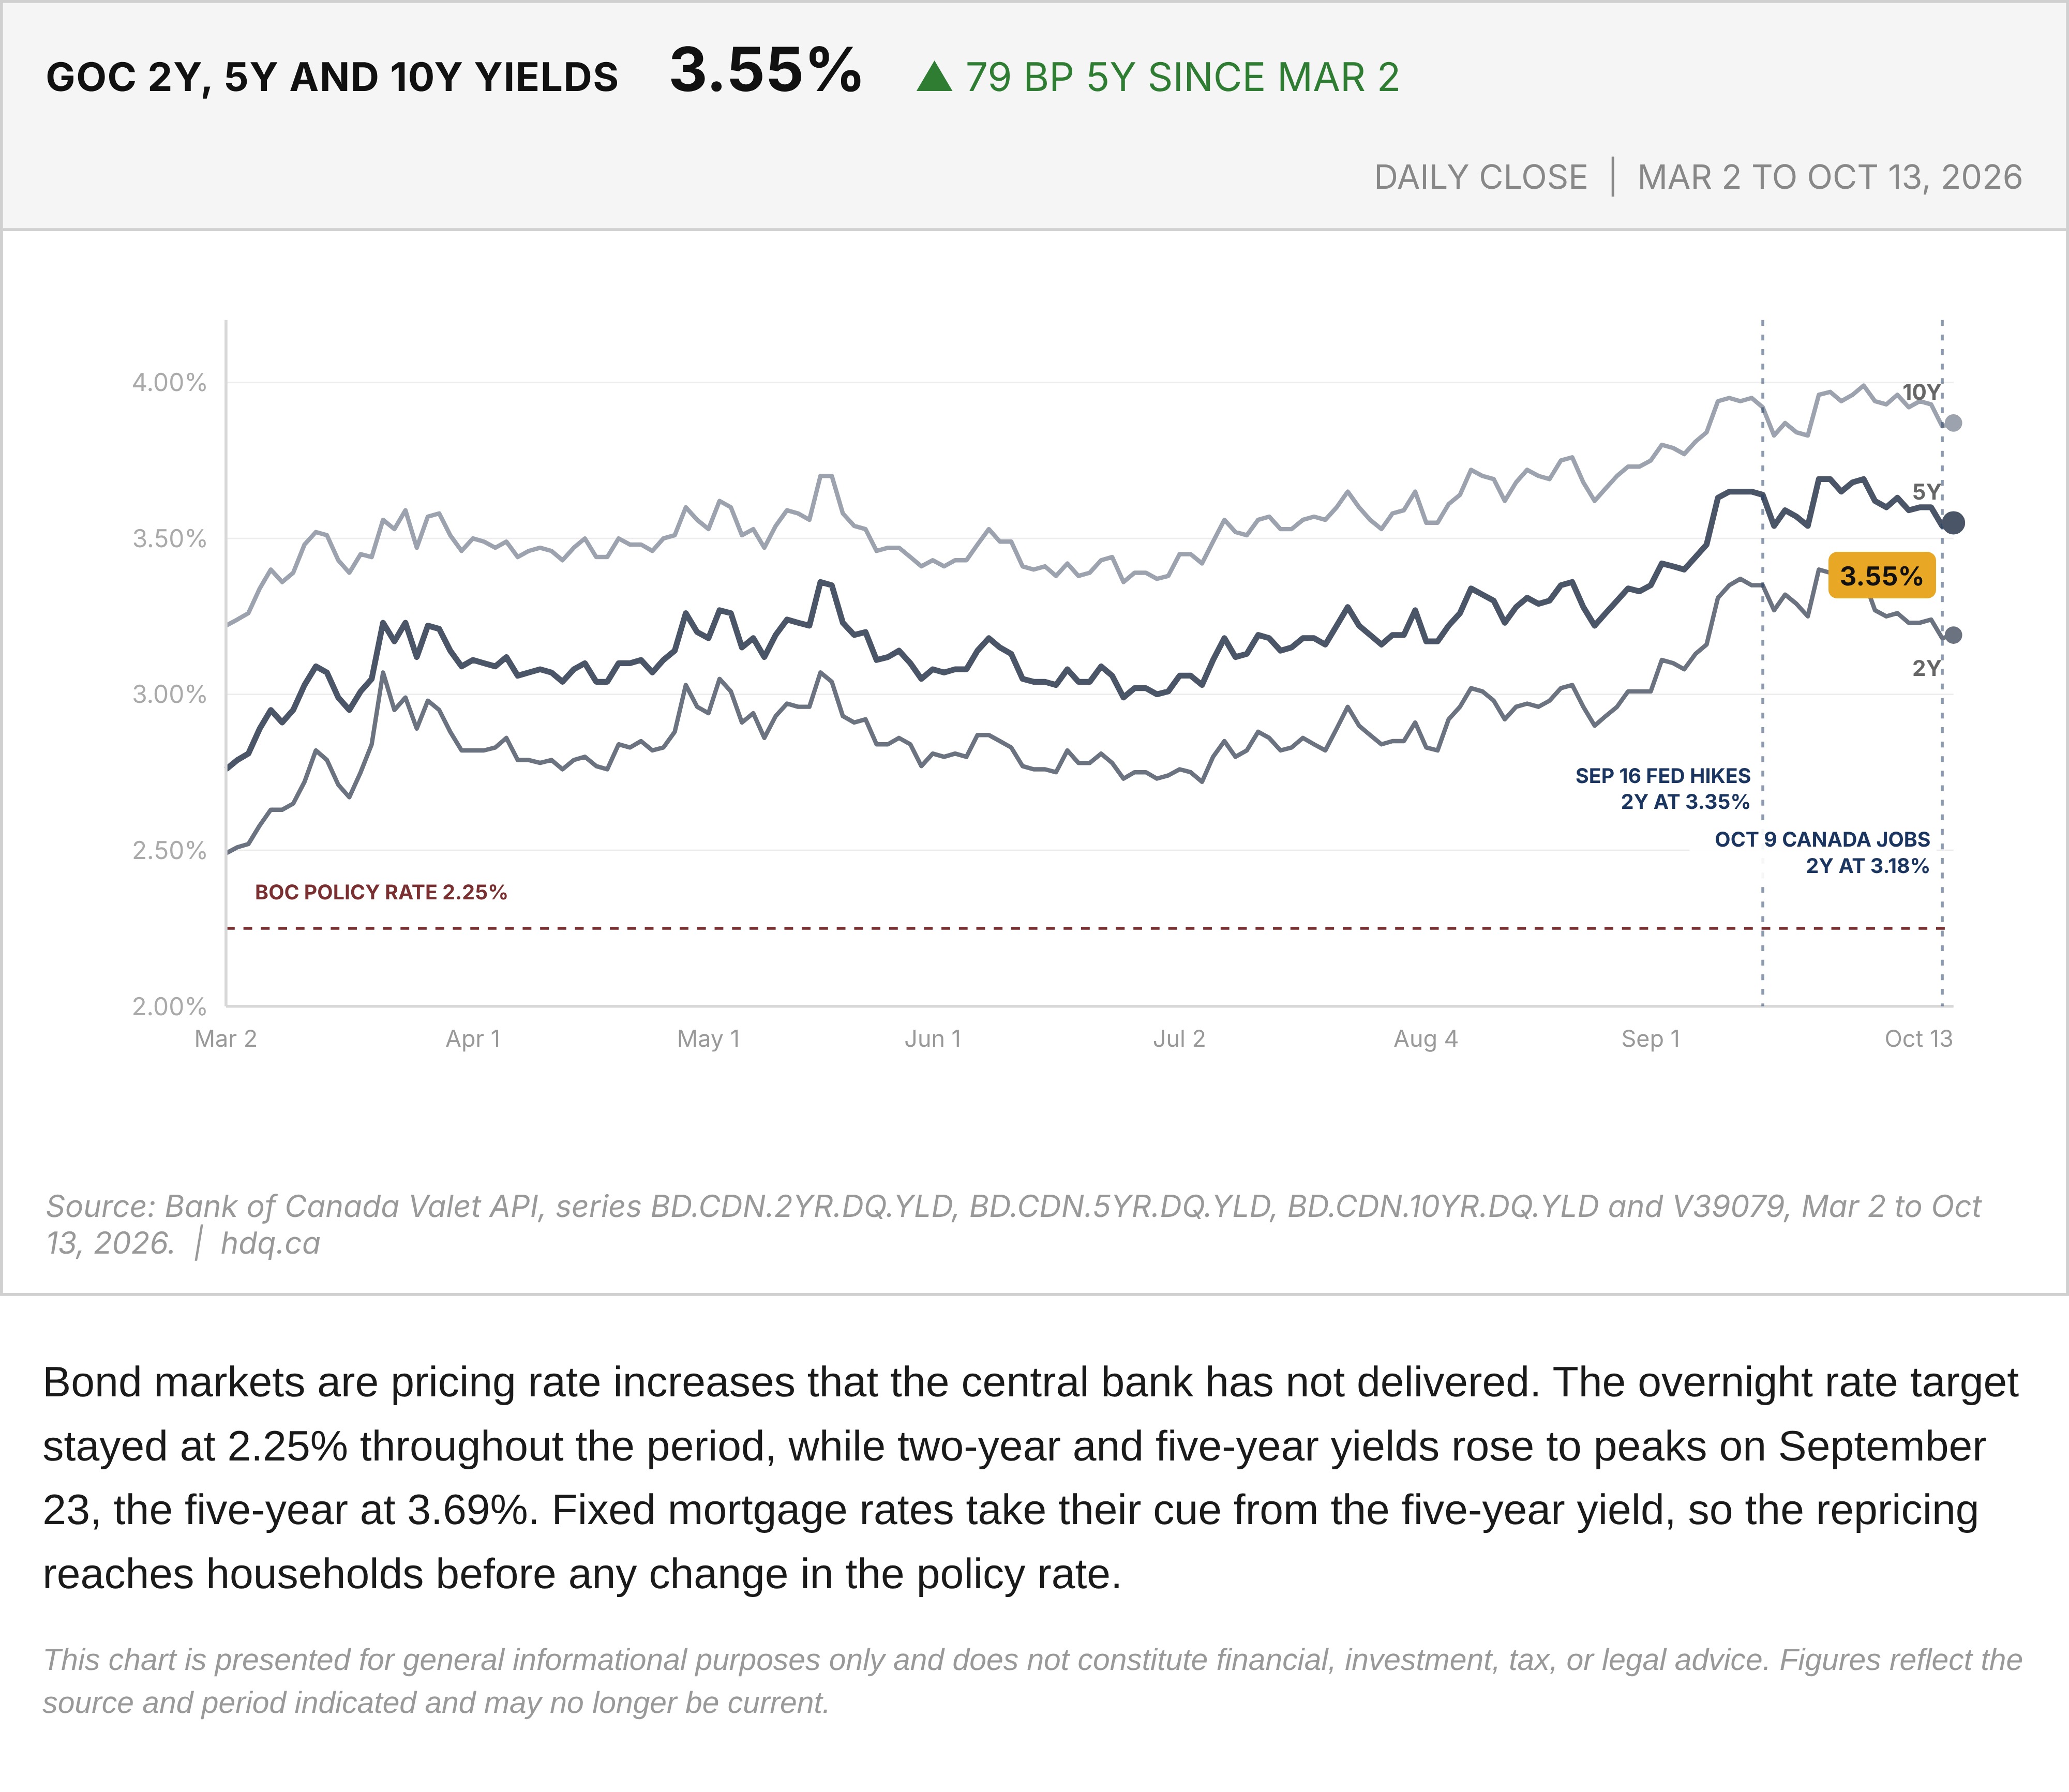
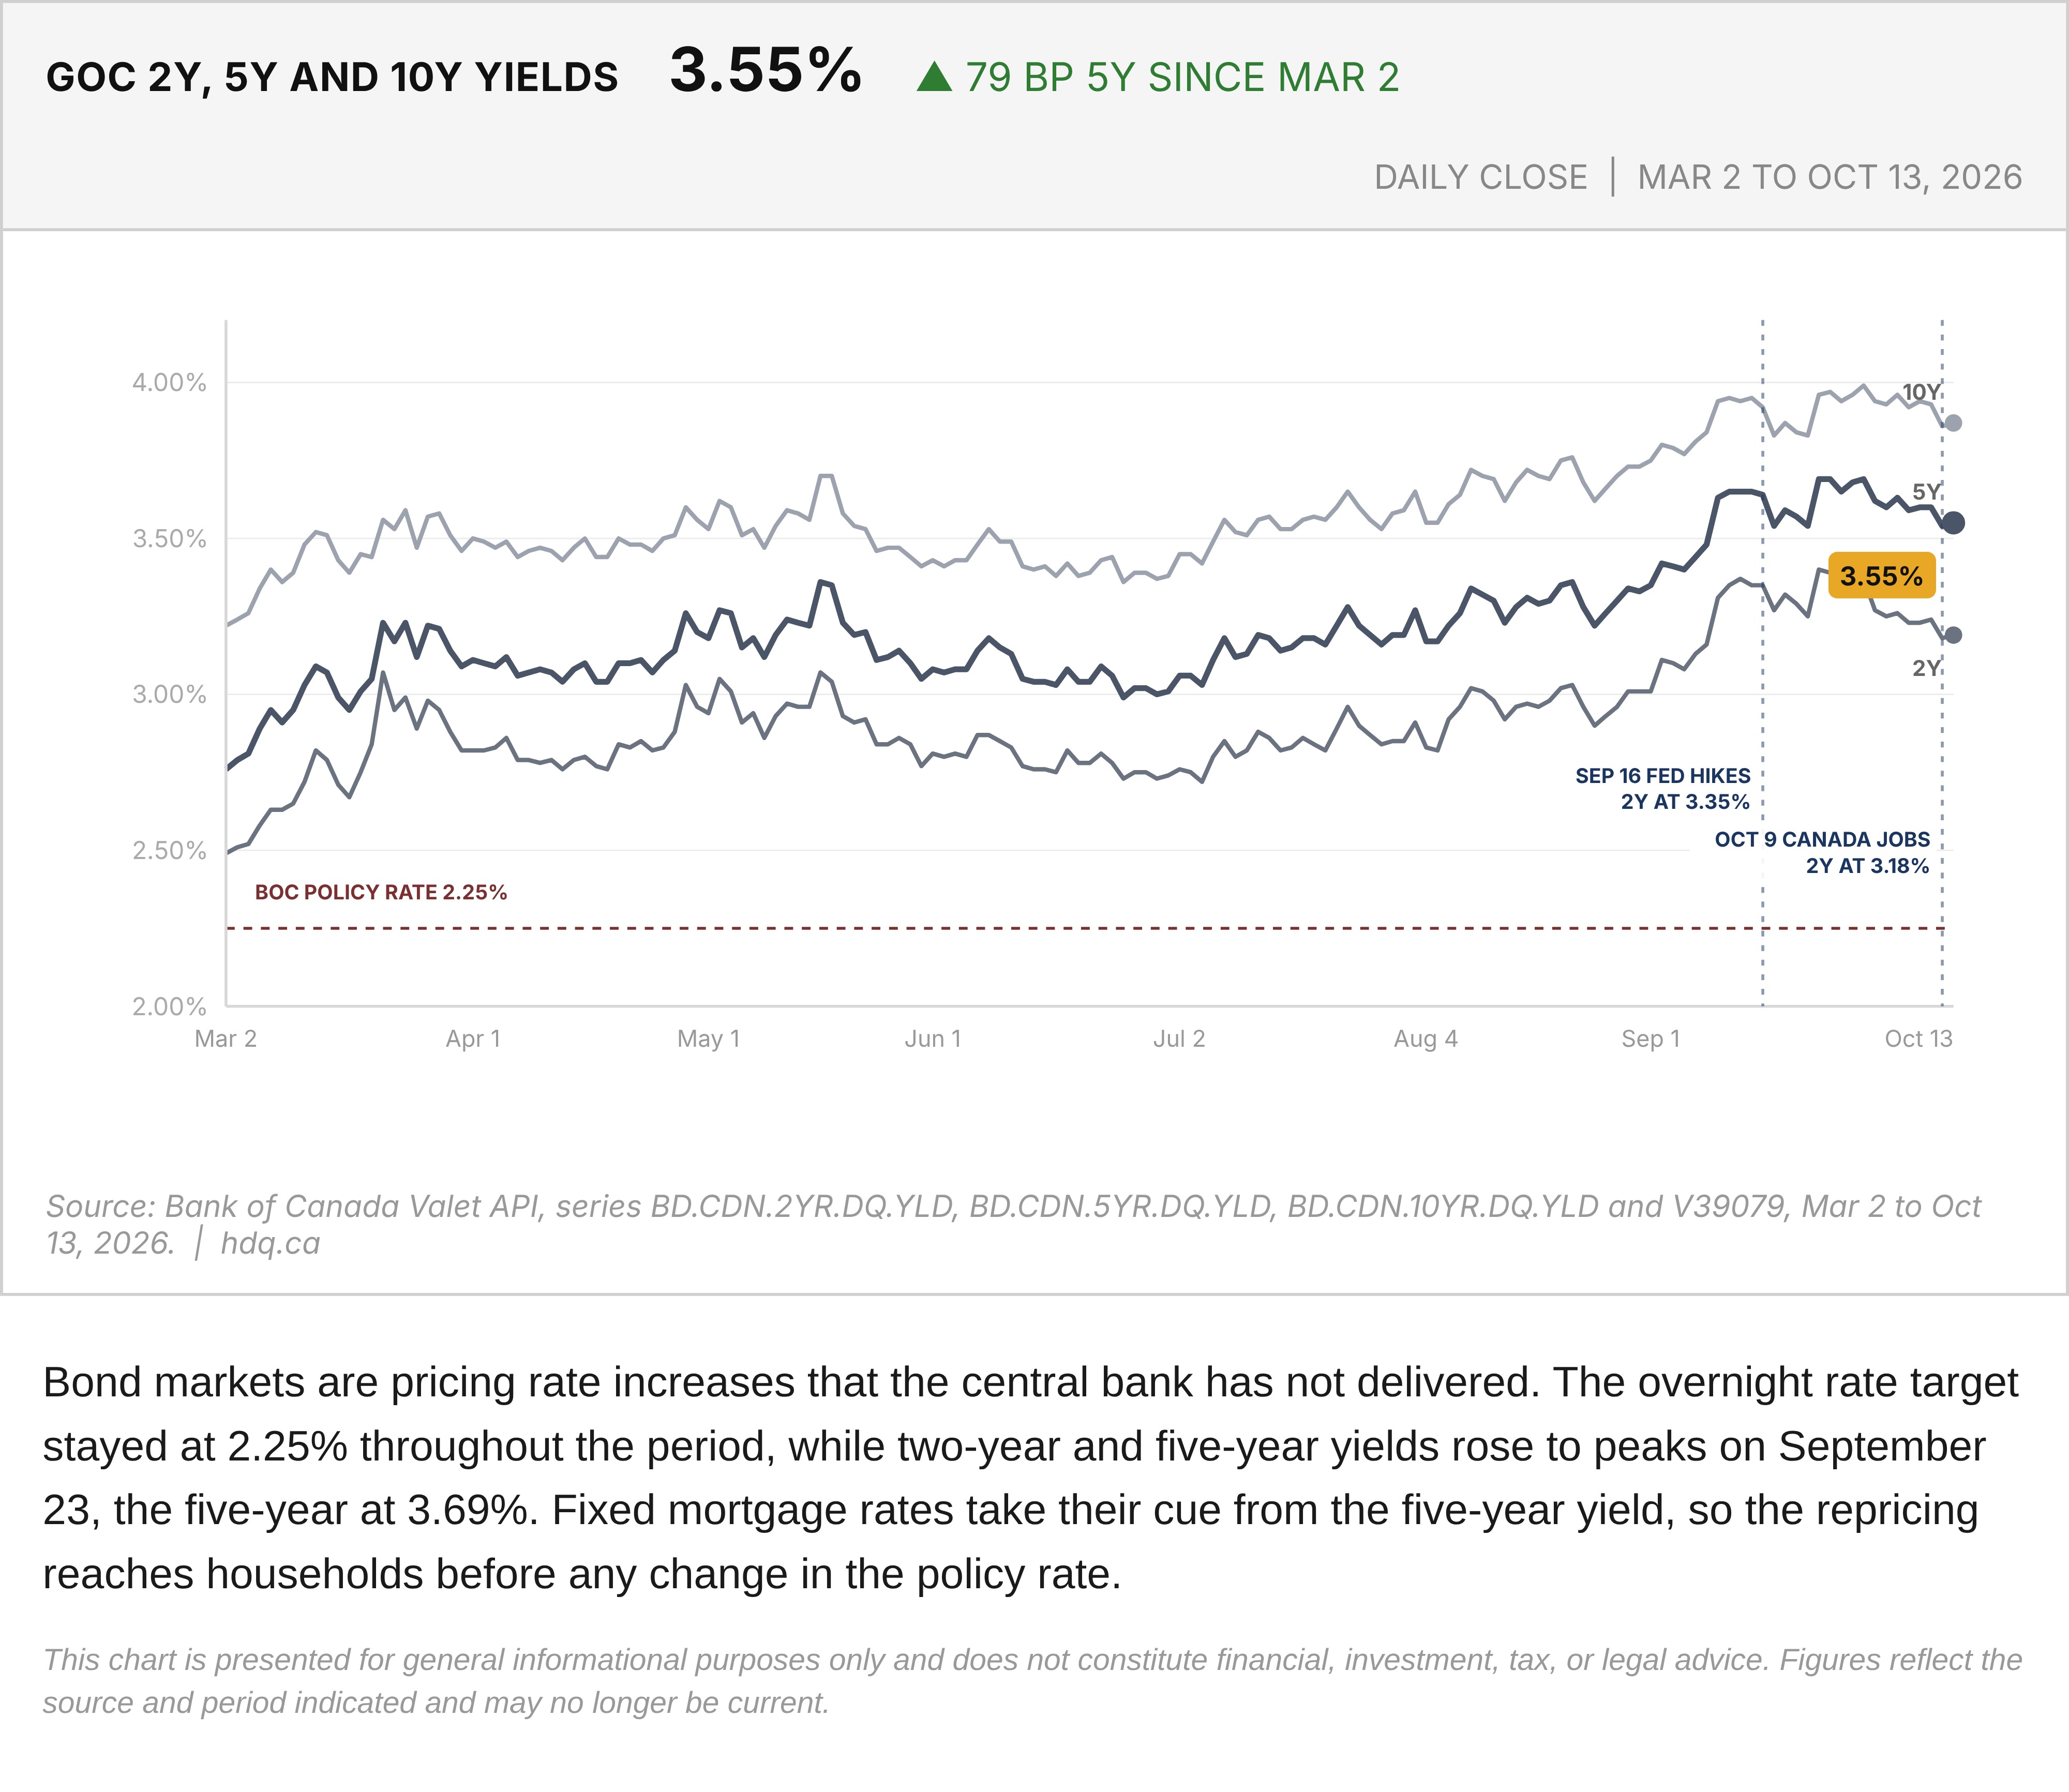
Bond markets are pricing rate increases that the central bank has not delivered. The overnight rate target stayed at 2.25% throughout the period, while two-year and five-year yields rose to peaks on September 23, the five-year at 3.69%. Fixed mortgage rates take their cue from the five-year yield, so the repricing reaches households before any change in the policy rate.
This chart is presented for general informational purposes only and does not constitute financial, investment, tax, or legal advice. Figures reflect the source and period indicated and may no longer be current.
Related charts
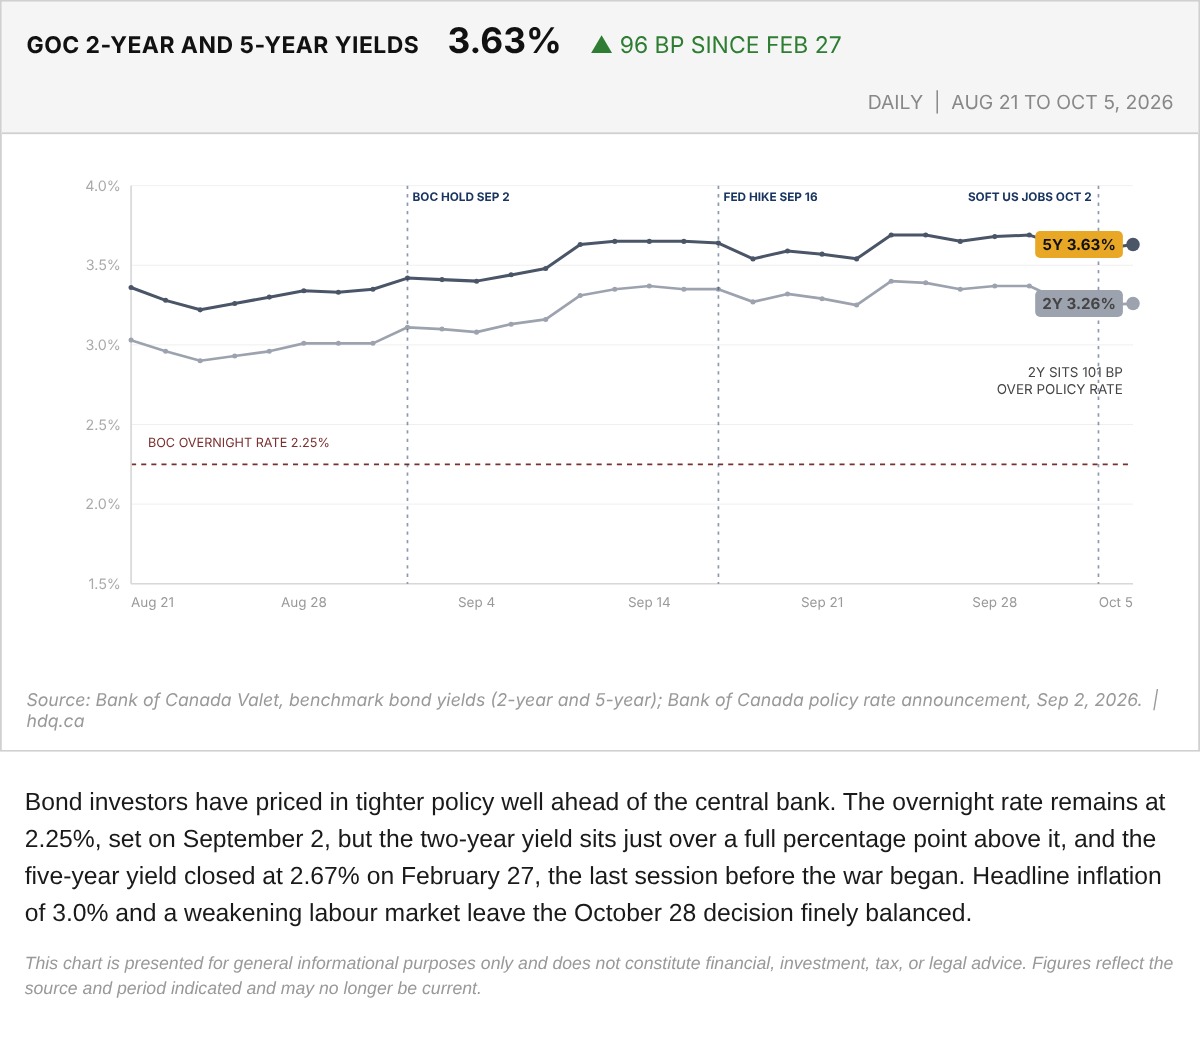
Bond investors have priced in tighter policy well ahead of the central bank.
Government of Canada 2-Year and 5-Year Yields Since the Pre-War Close
October 7, 2026
View chart & download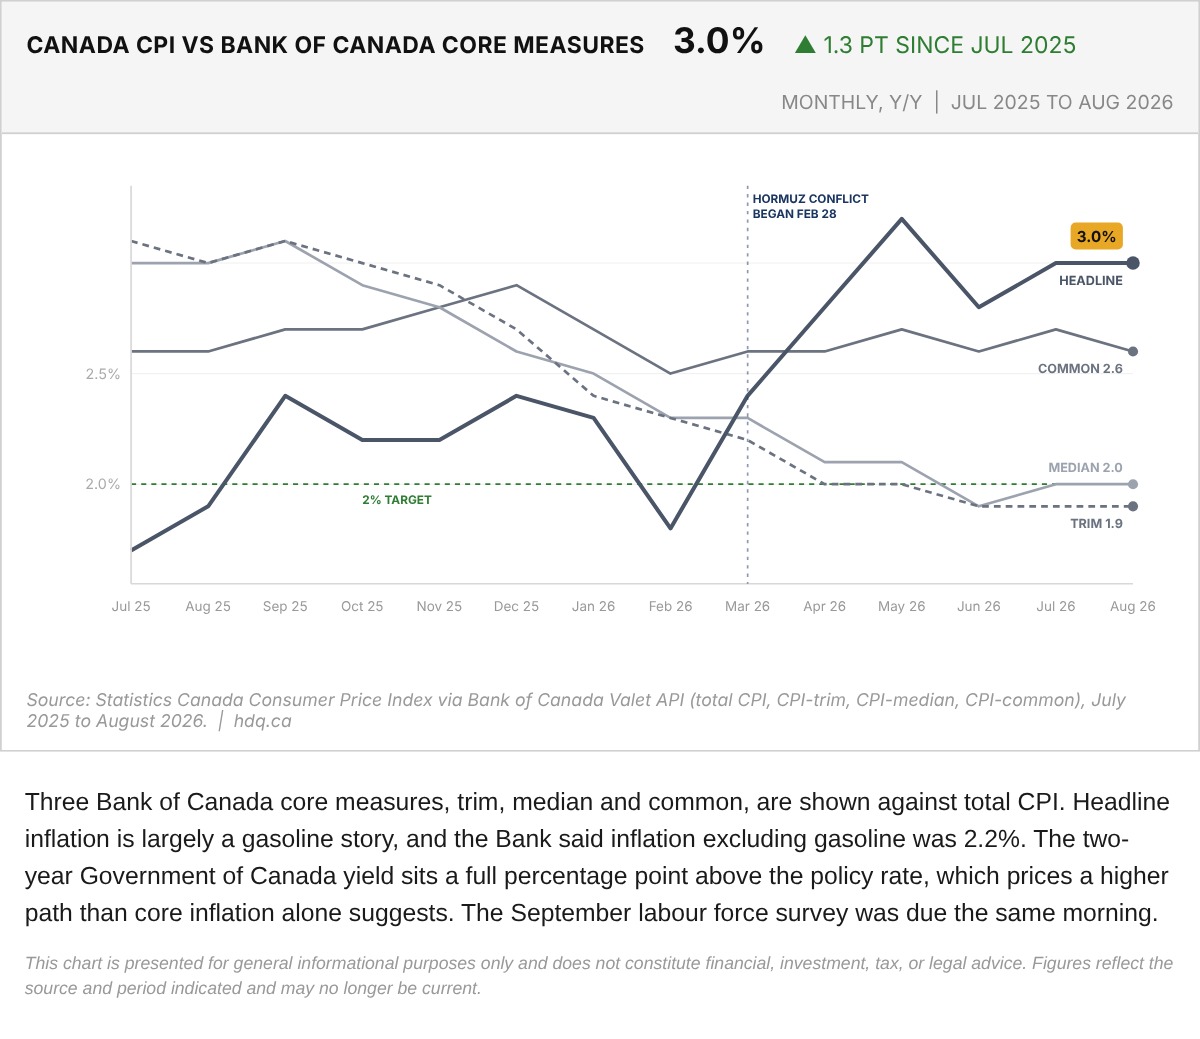
Three Bank of Canada core measures, trim, median and common, are shown against total CPI.
Canada CPI Against Bank of Canada Core Measures, July 2025 to August 2026
October 9, 2026
View chart & download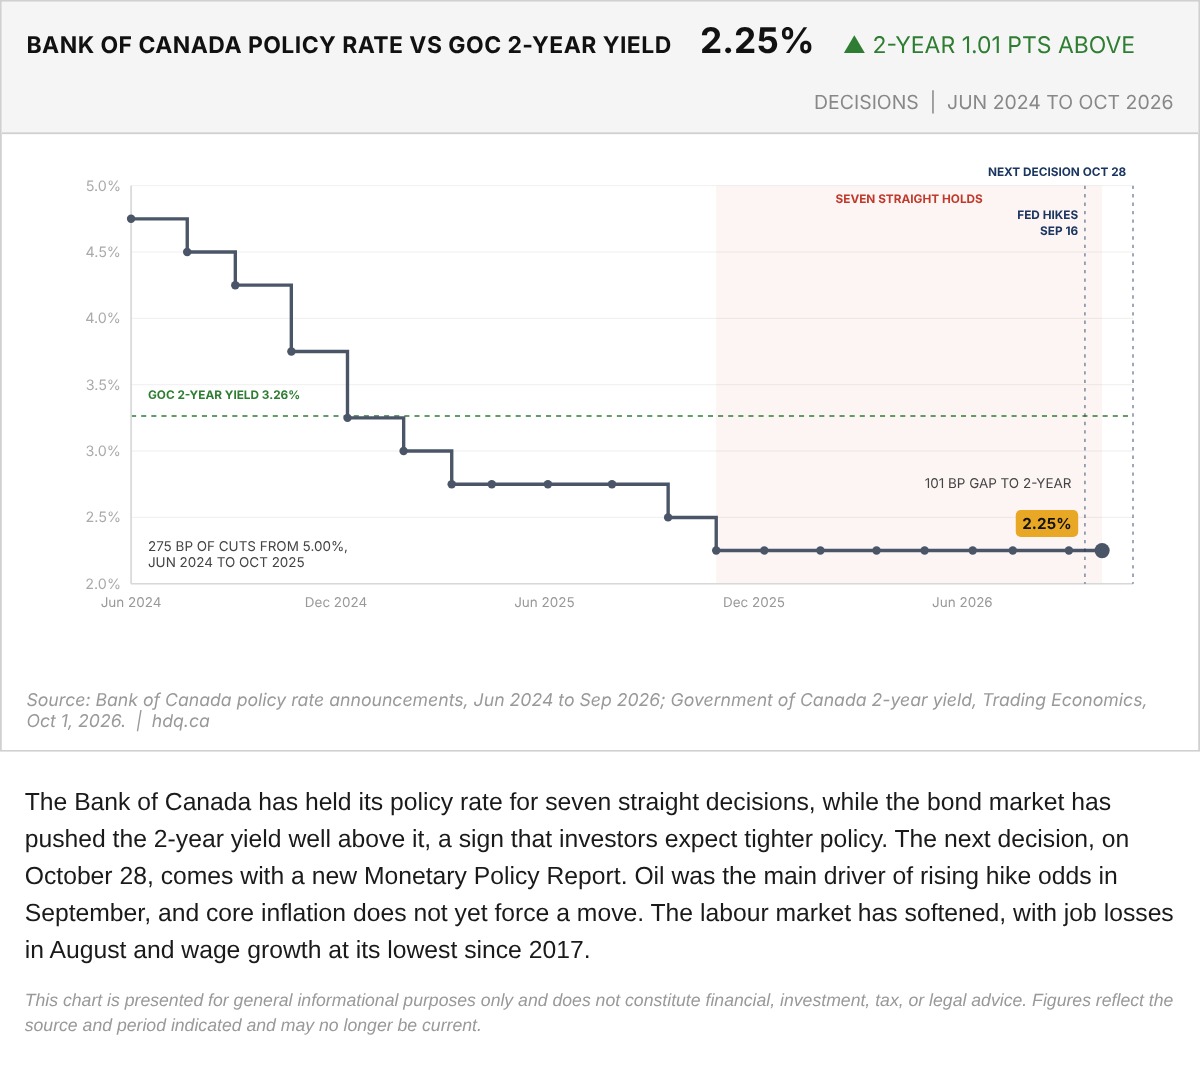
The Bank of Canada has held its policy rate for seven straight decisions, while the bond market has pushed the 2-year yield well above it,…
Bank of Canada Policy Rate Versus the Government of Canada 2-Year Yield, June 2024 to October 2026
October 2, 2026
View chart & download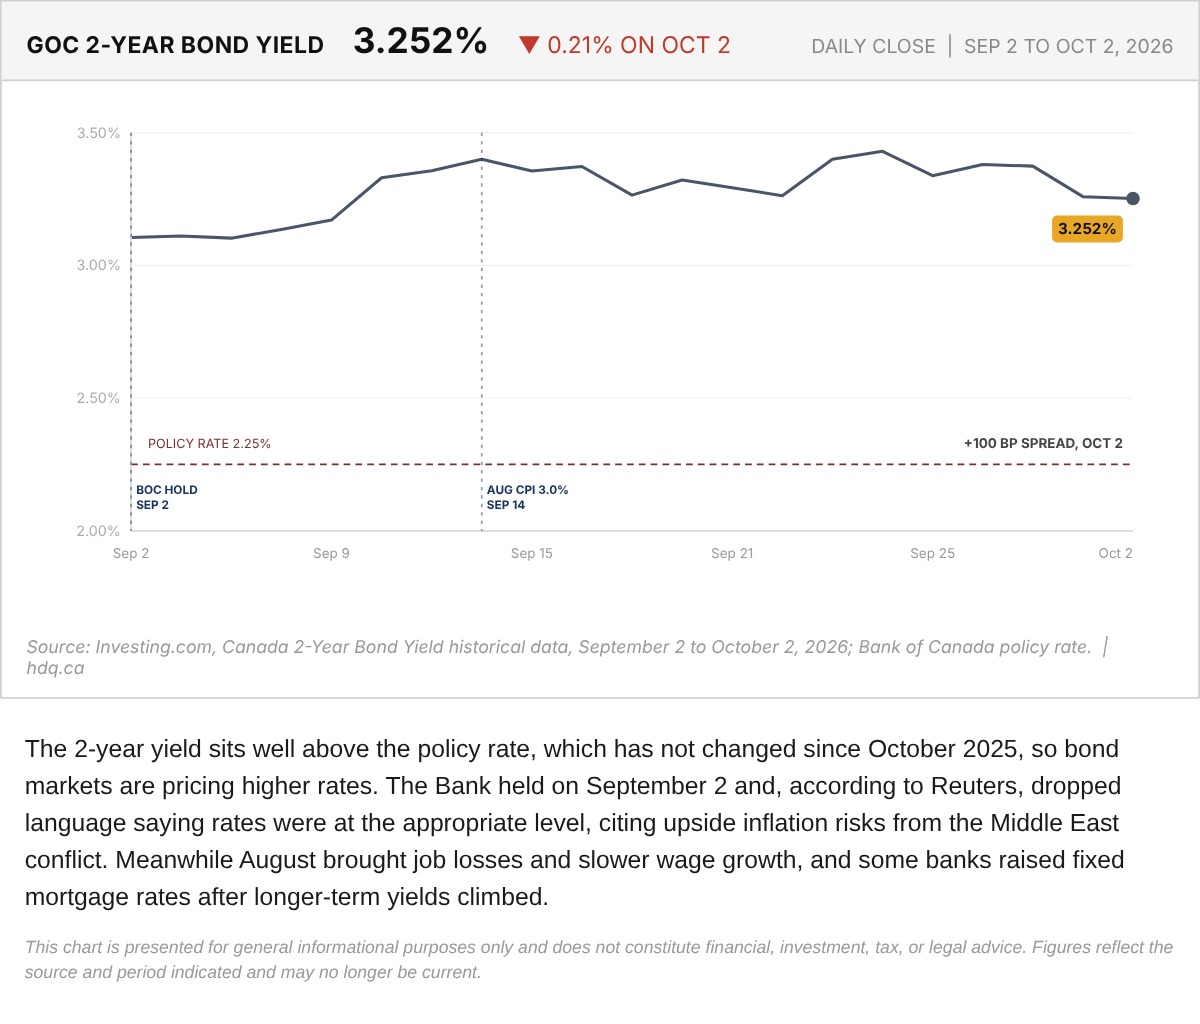
The 2-year yield sits well above the policy rate, which has not changed since October 2025, so bond markets are pricing higher rates.
Government of Canada 2-Year Bond Yield, September 2 to October 2, 2026
October 5, 2026
View chart & download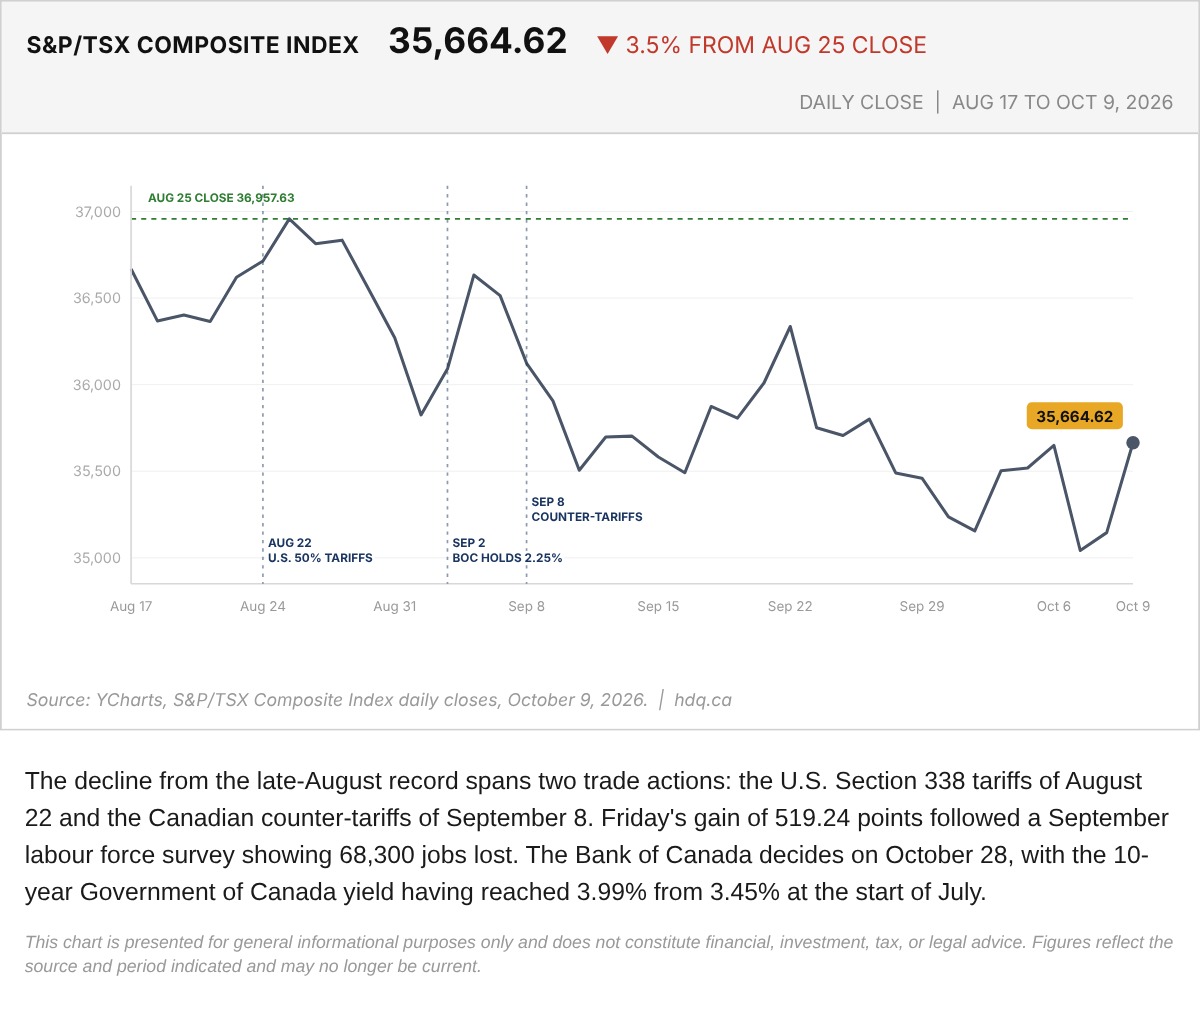
The decline from the late-August record spans two trade actions: the U.S.
S&P/TSX Composite Index and Its Decline From the August 25 Record
October 9, 2026
View chart & download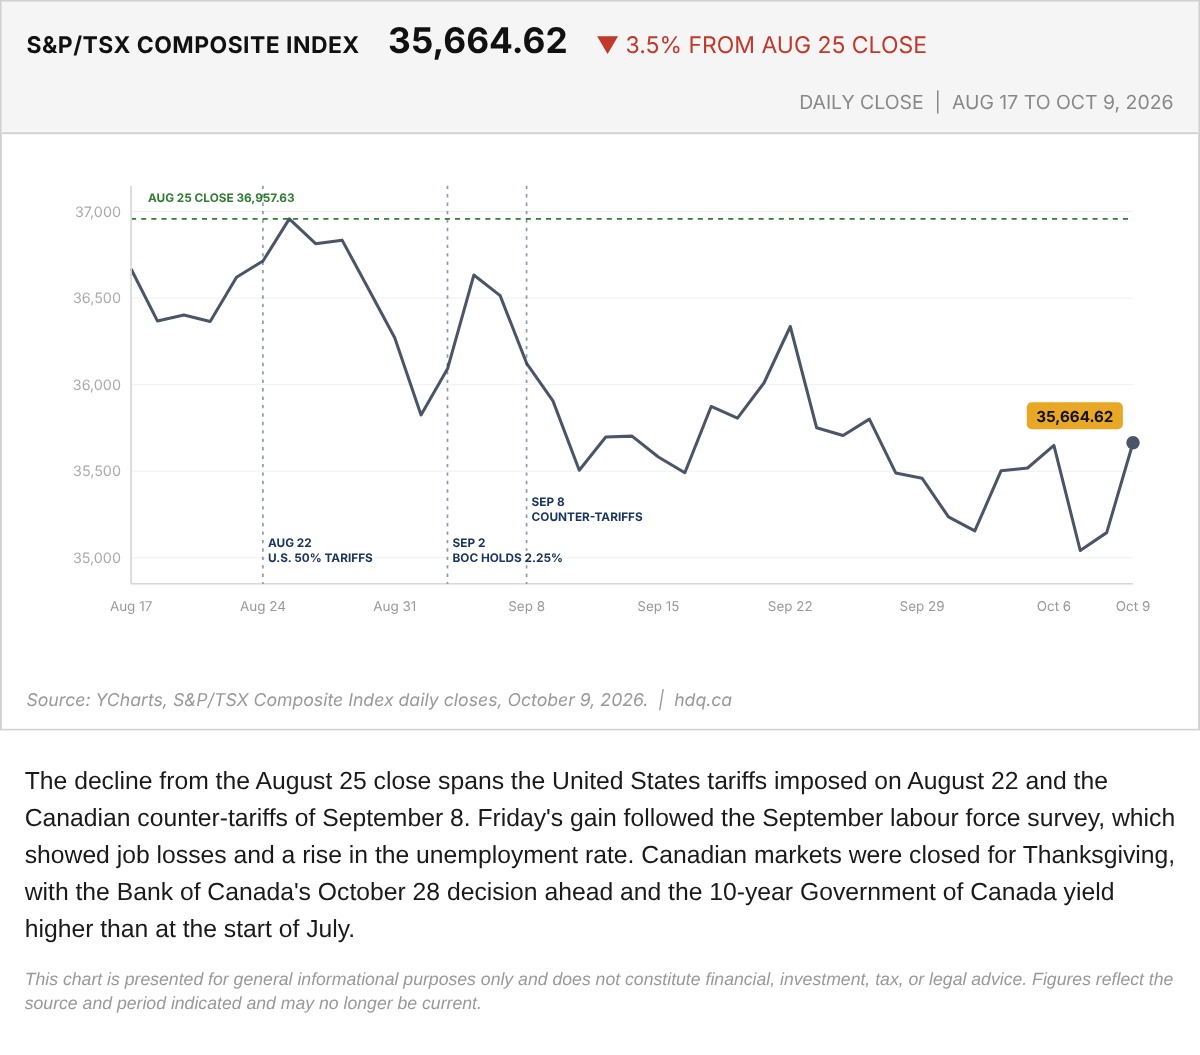
The decline from the August 25 close spans the United States tariffs imposed on August 22 and the Canadian counter-tariffs of September 8.
S&P/TSX Composite From August 17 to October 9, Before Thanksgiving
October 12, 2026
View chart & download