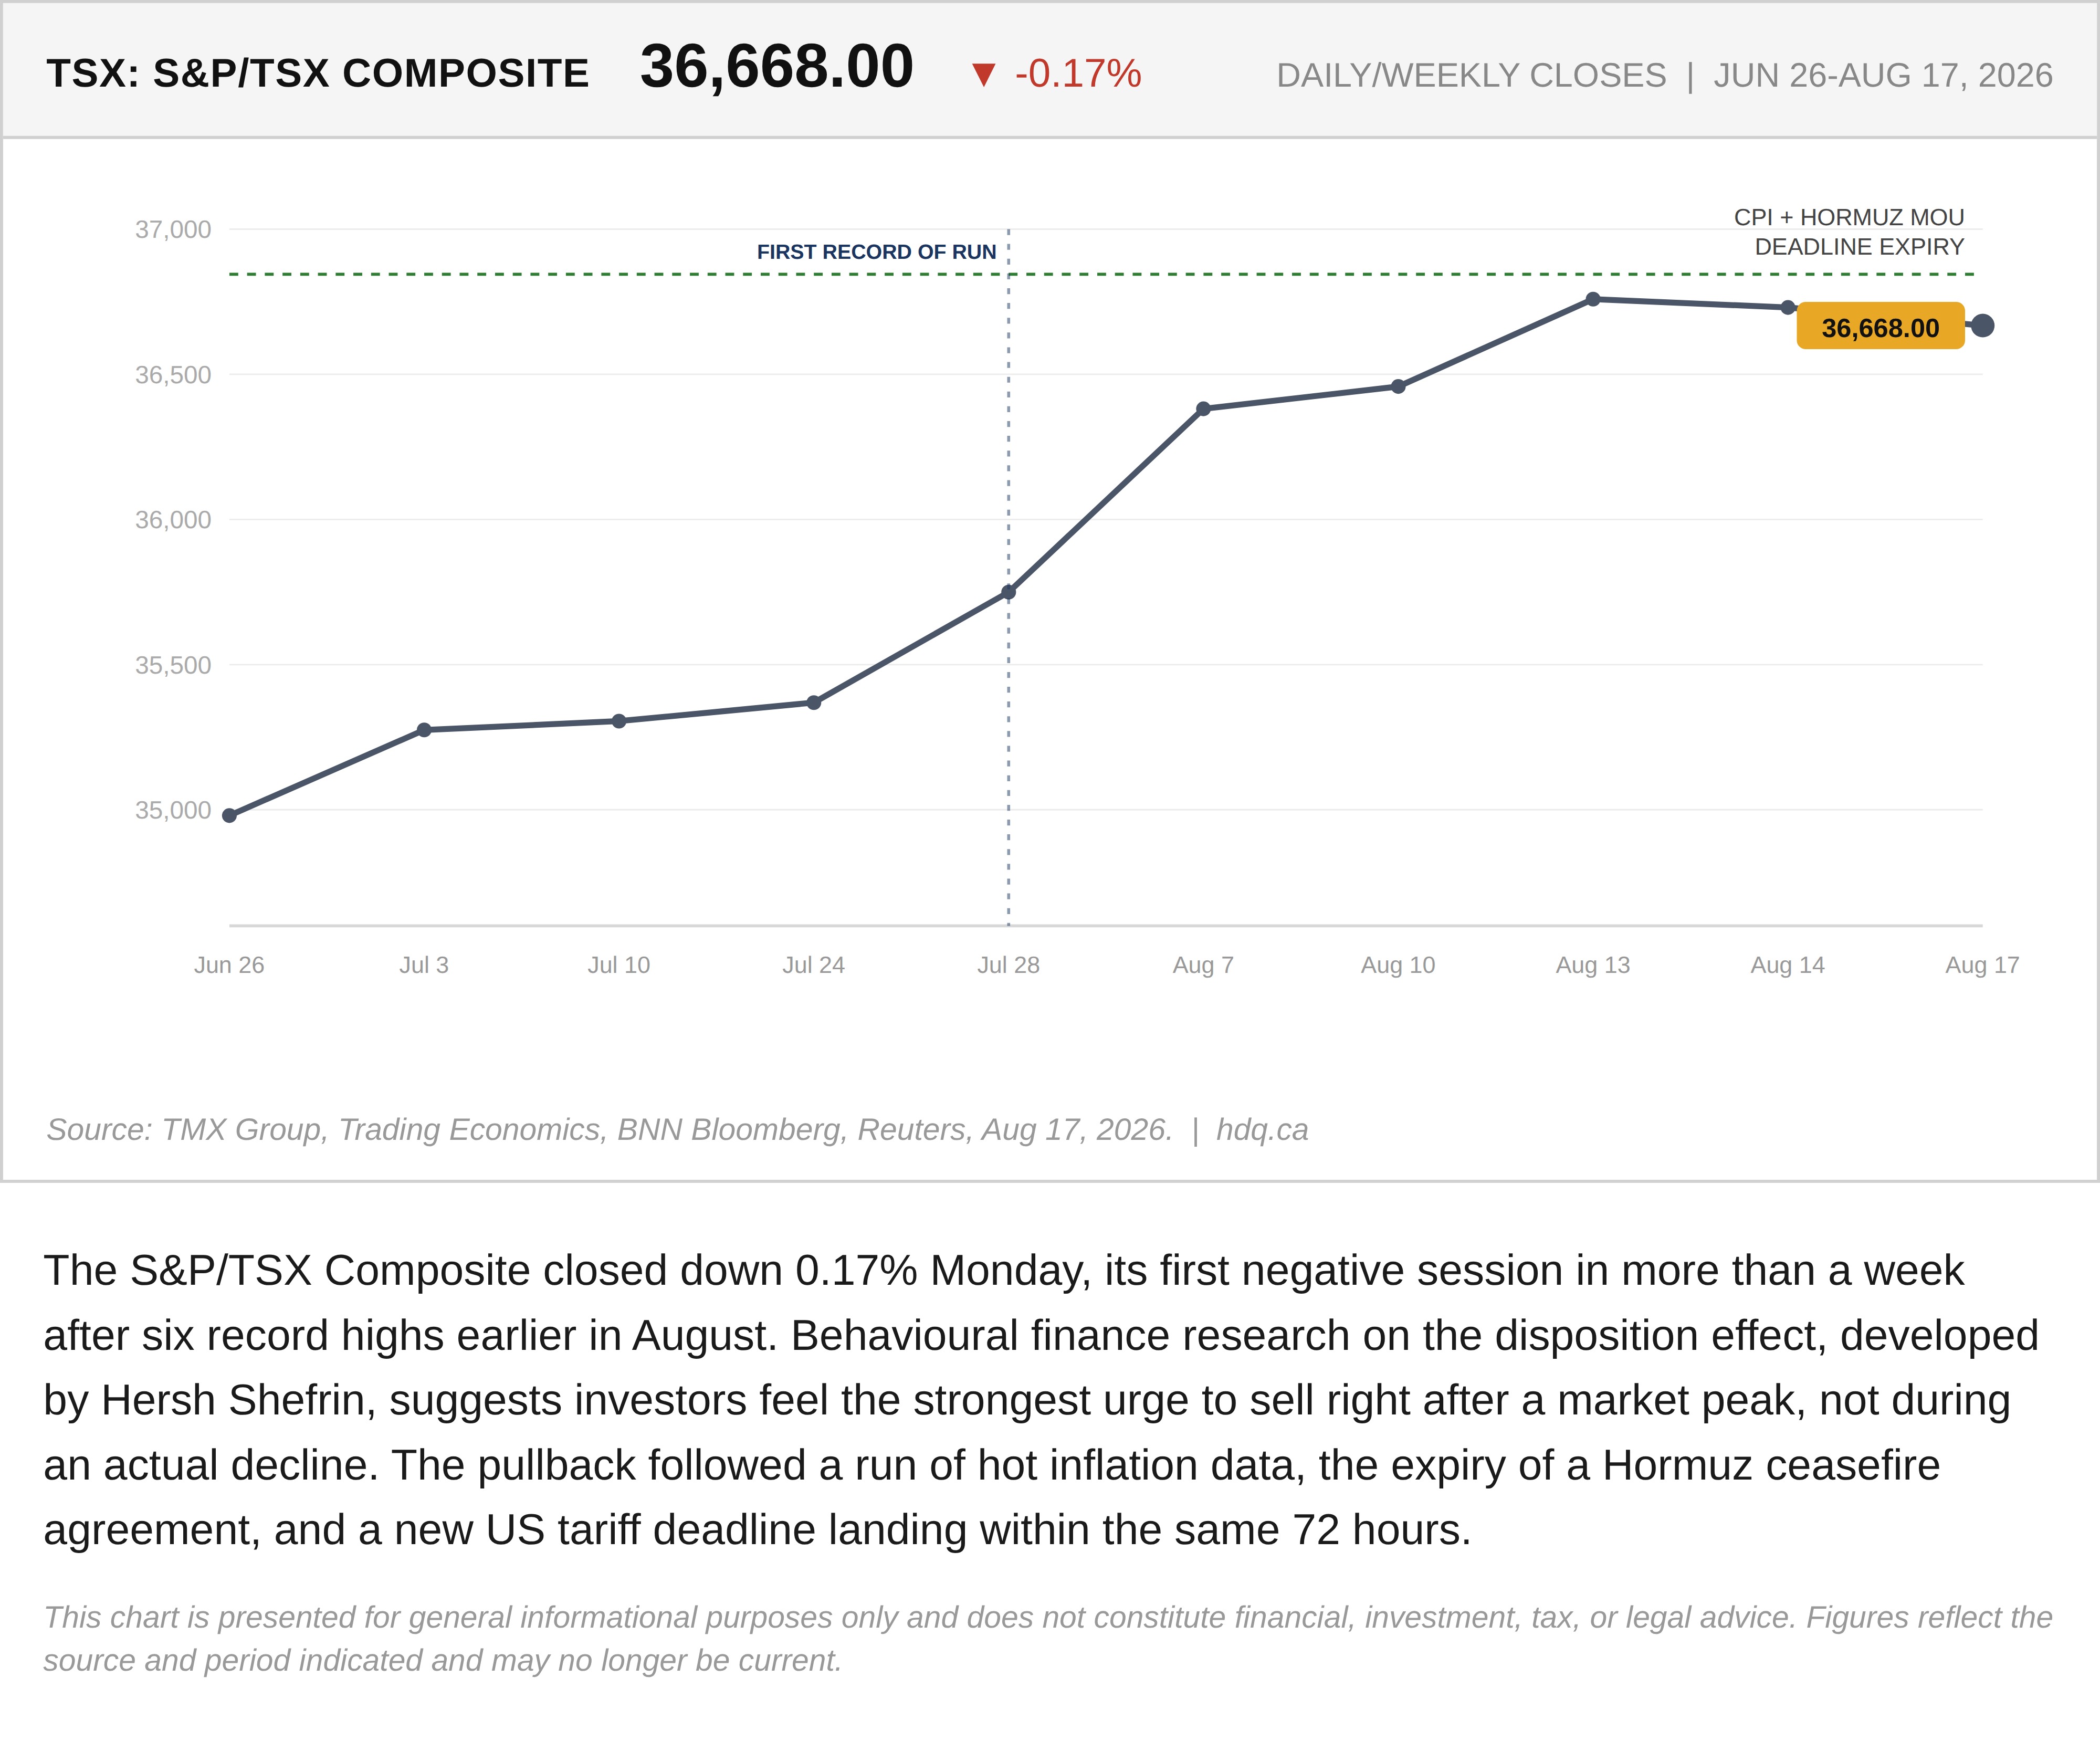
The S&P/TSX Composite closed down 0.17% Monday, its first negative session in more than a week after six record highs earlier in August. Behavioural finance research on the disposition effect, developed by Hersh Shefrin, suggests investors feel the strongest urge to sell right after a market peak, not during an actual decline. The pullback followed a run of hot inflation data, the expiry of a Hormuz ceasefire agreement, and a new US tariff deadline landing within the same 72 hours.
This chart is presented for general informational purposes only and does not constitute financial, investment, tax, or legal advice. Figures reflect the source and period indicated and may no longer be current.
Related charts
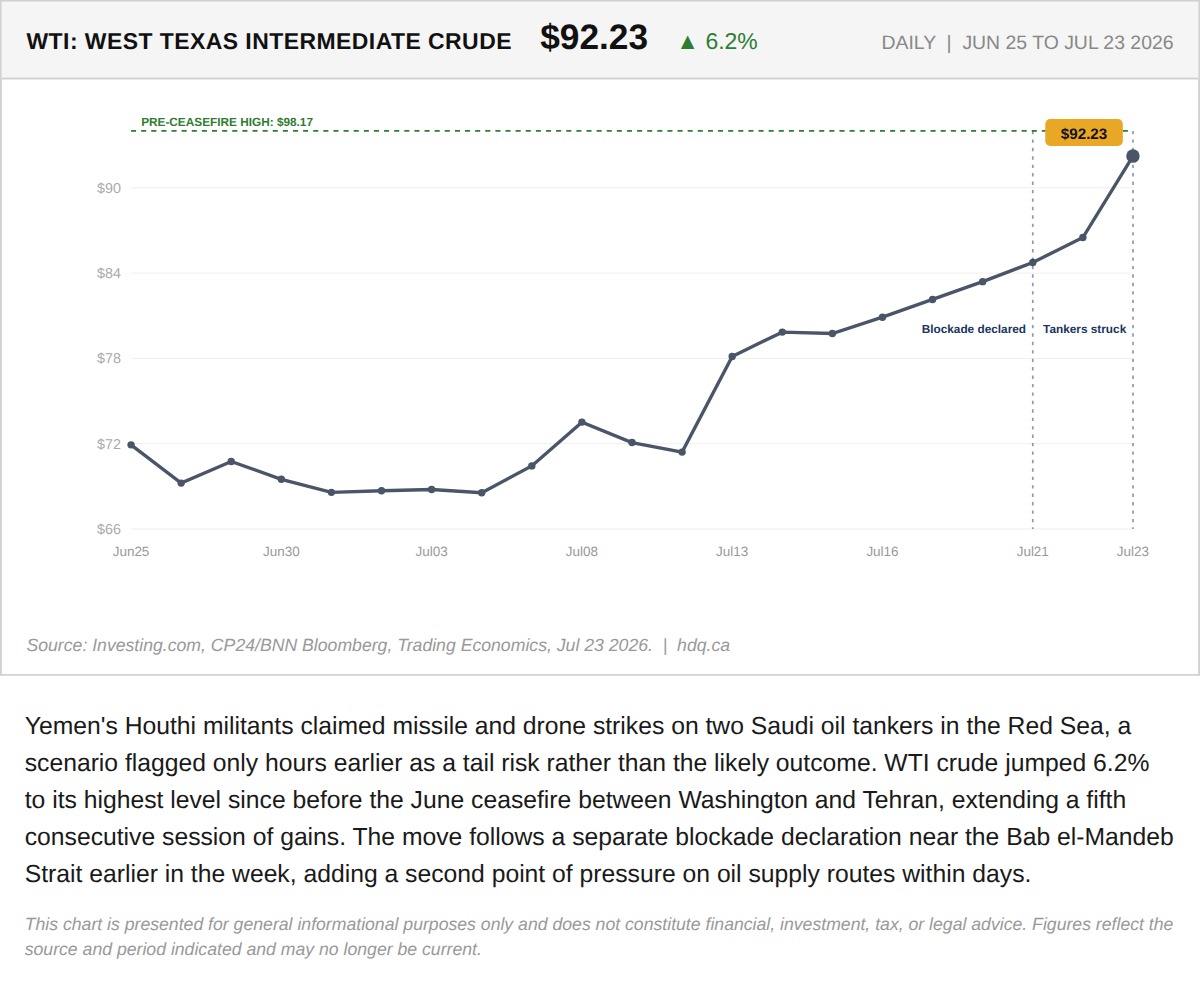
WTI crude has climbed to $74.40, up 11.1% since June 24, as the U.S.
The Strikes on Iran Got Bigger Overnight. The Market's Reaction Got Smaller.
July 9, 2026
View chart & download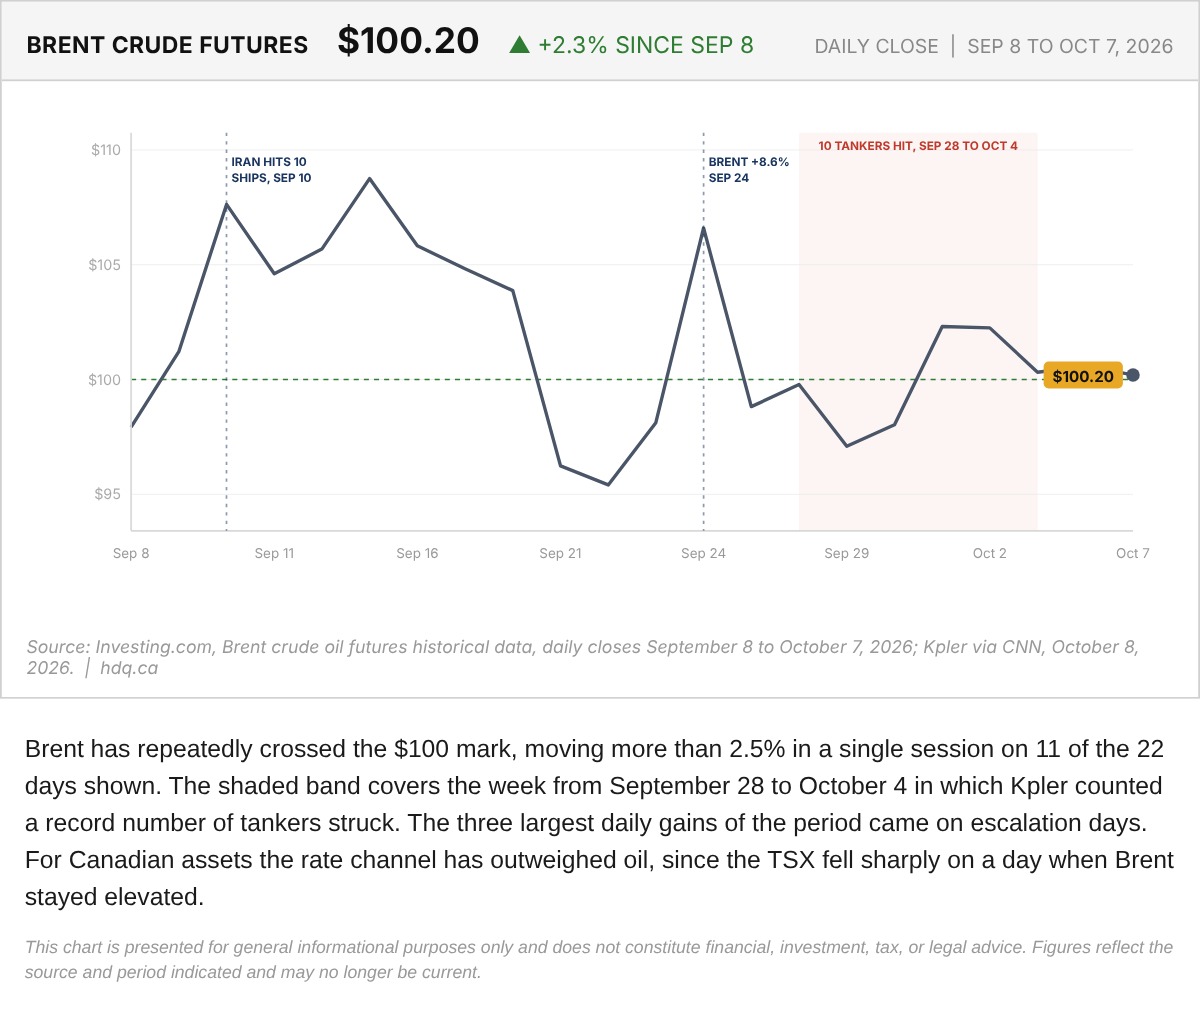
Brent has repeatedly crossed the $100 mark, moving more than 2.5% in a single session on 11 of the 22 days shown.
Brent Crude Futures Daily Close, September 8 to October 7
October 8, 2026
View chart & download
Brent was the only one of the three to finish above its starting level, while the index and gold both fell.
Brent, TSX and Gold Rebased to the August 31 Close
September 30, 2026
View chart & download
The Bank of Canada held its policy rate at 2.25% for a seventh straight time, yet Canadian yields rose as United States yields surged.
Government of Canada Benchmark Yields, September 2026
September 30, 2026
View chart & download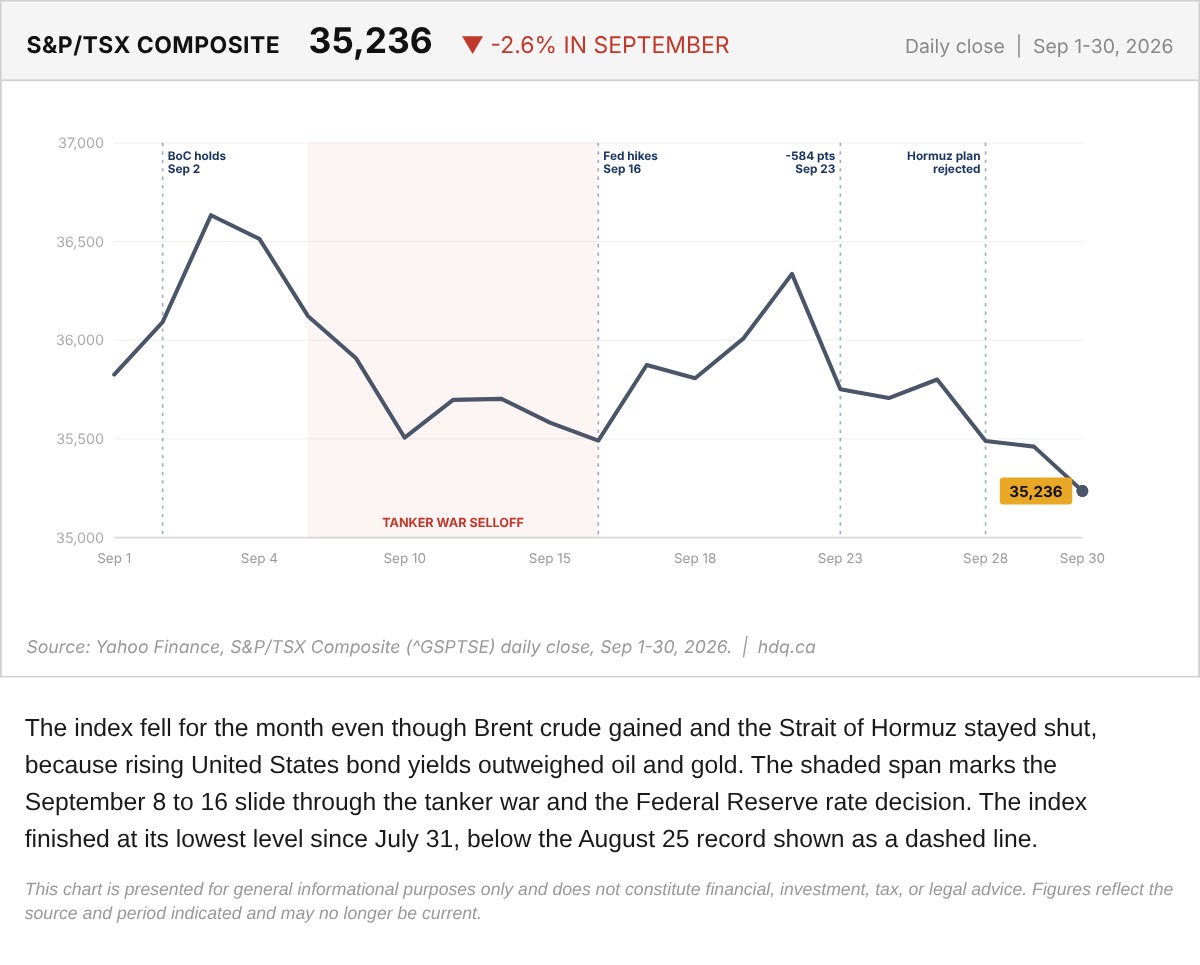
The index fell for the month even though Brent crude gained and the Strait of Hormuz stayed shut, because rising United States bond yields outweighed oil and gold.
S&P/TSX Composite Daily Close Through September 2026
September 30, 2026
View chart & download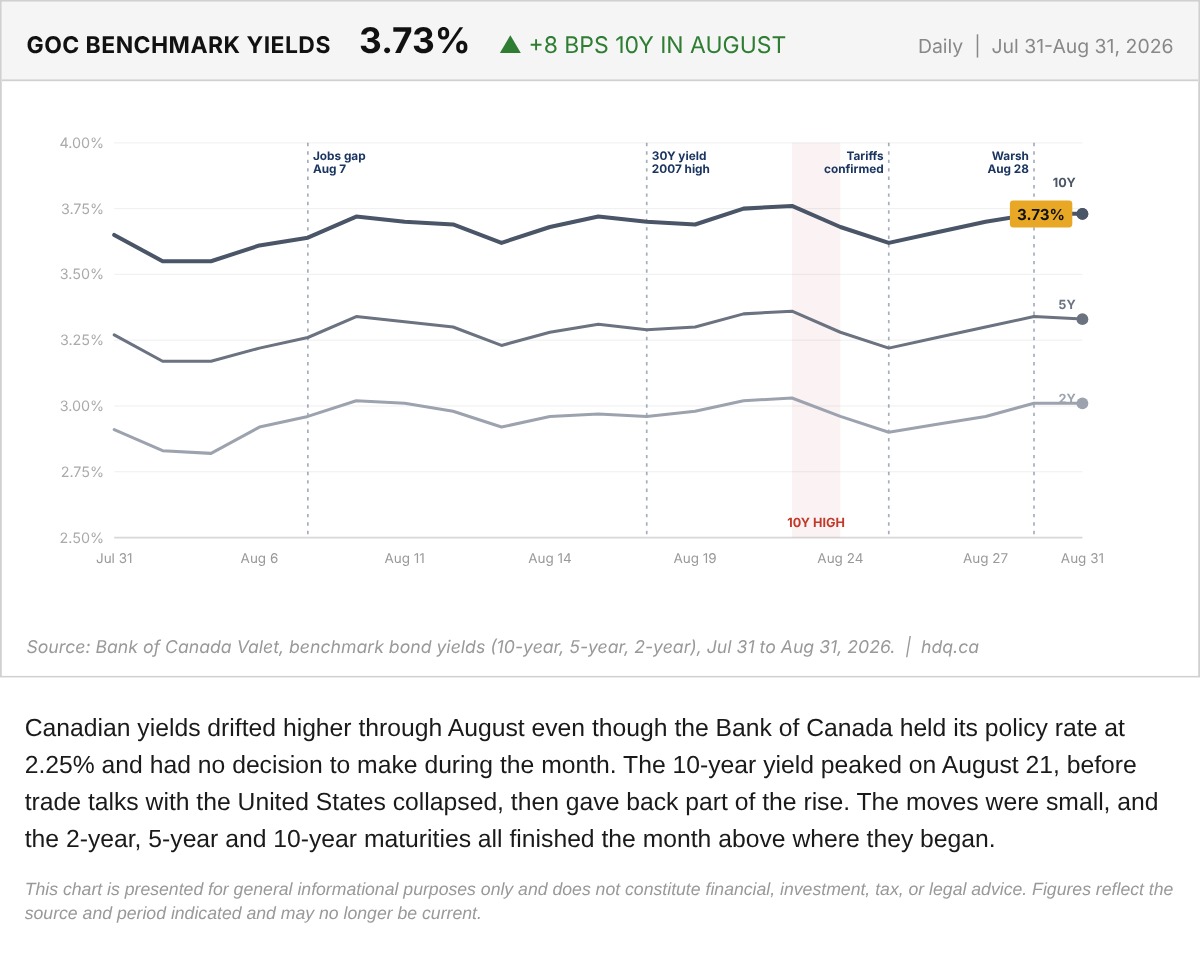
Canadian yields drifted higher through August even though the Bank of Canada held its policy rate at 2.25% and had no decision to make during the month.
Government of Canada Benchmark Yields, August 2026
August 31, 2026
View chart & download