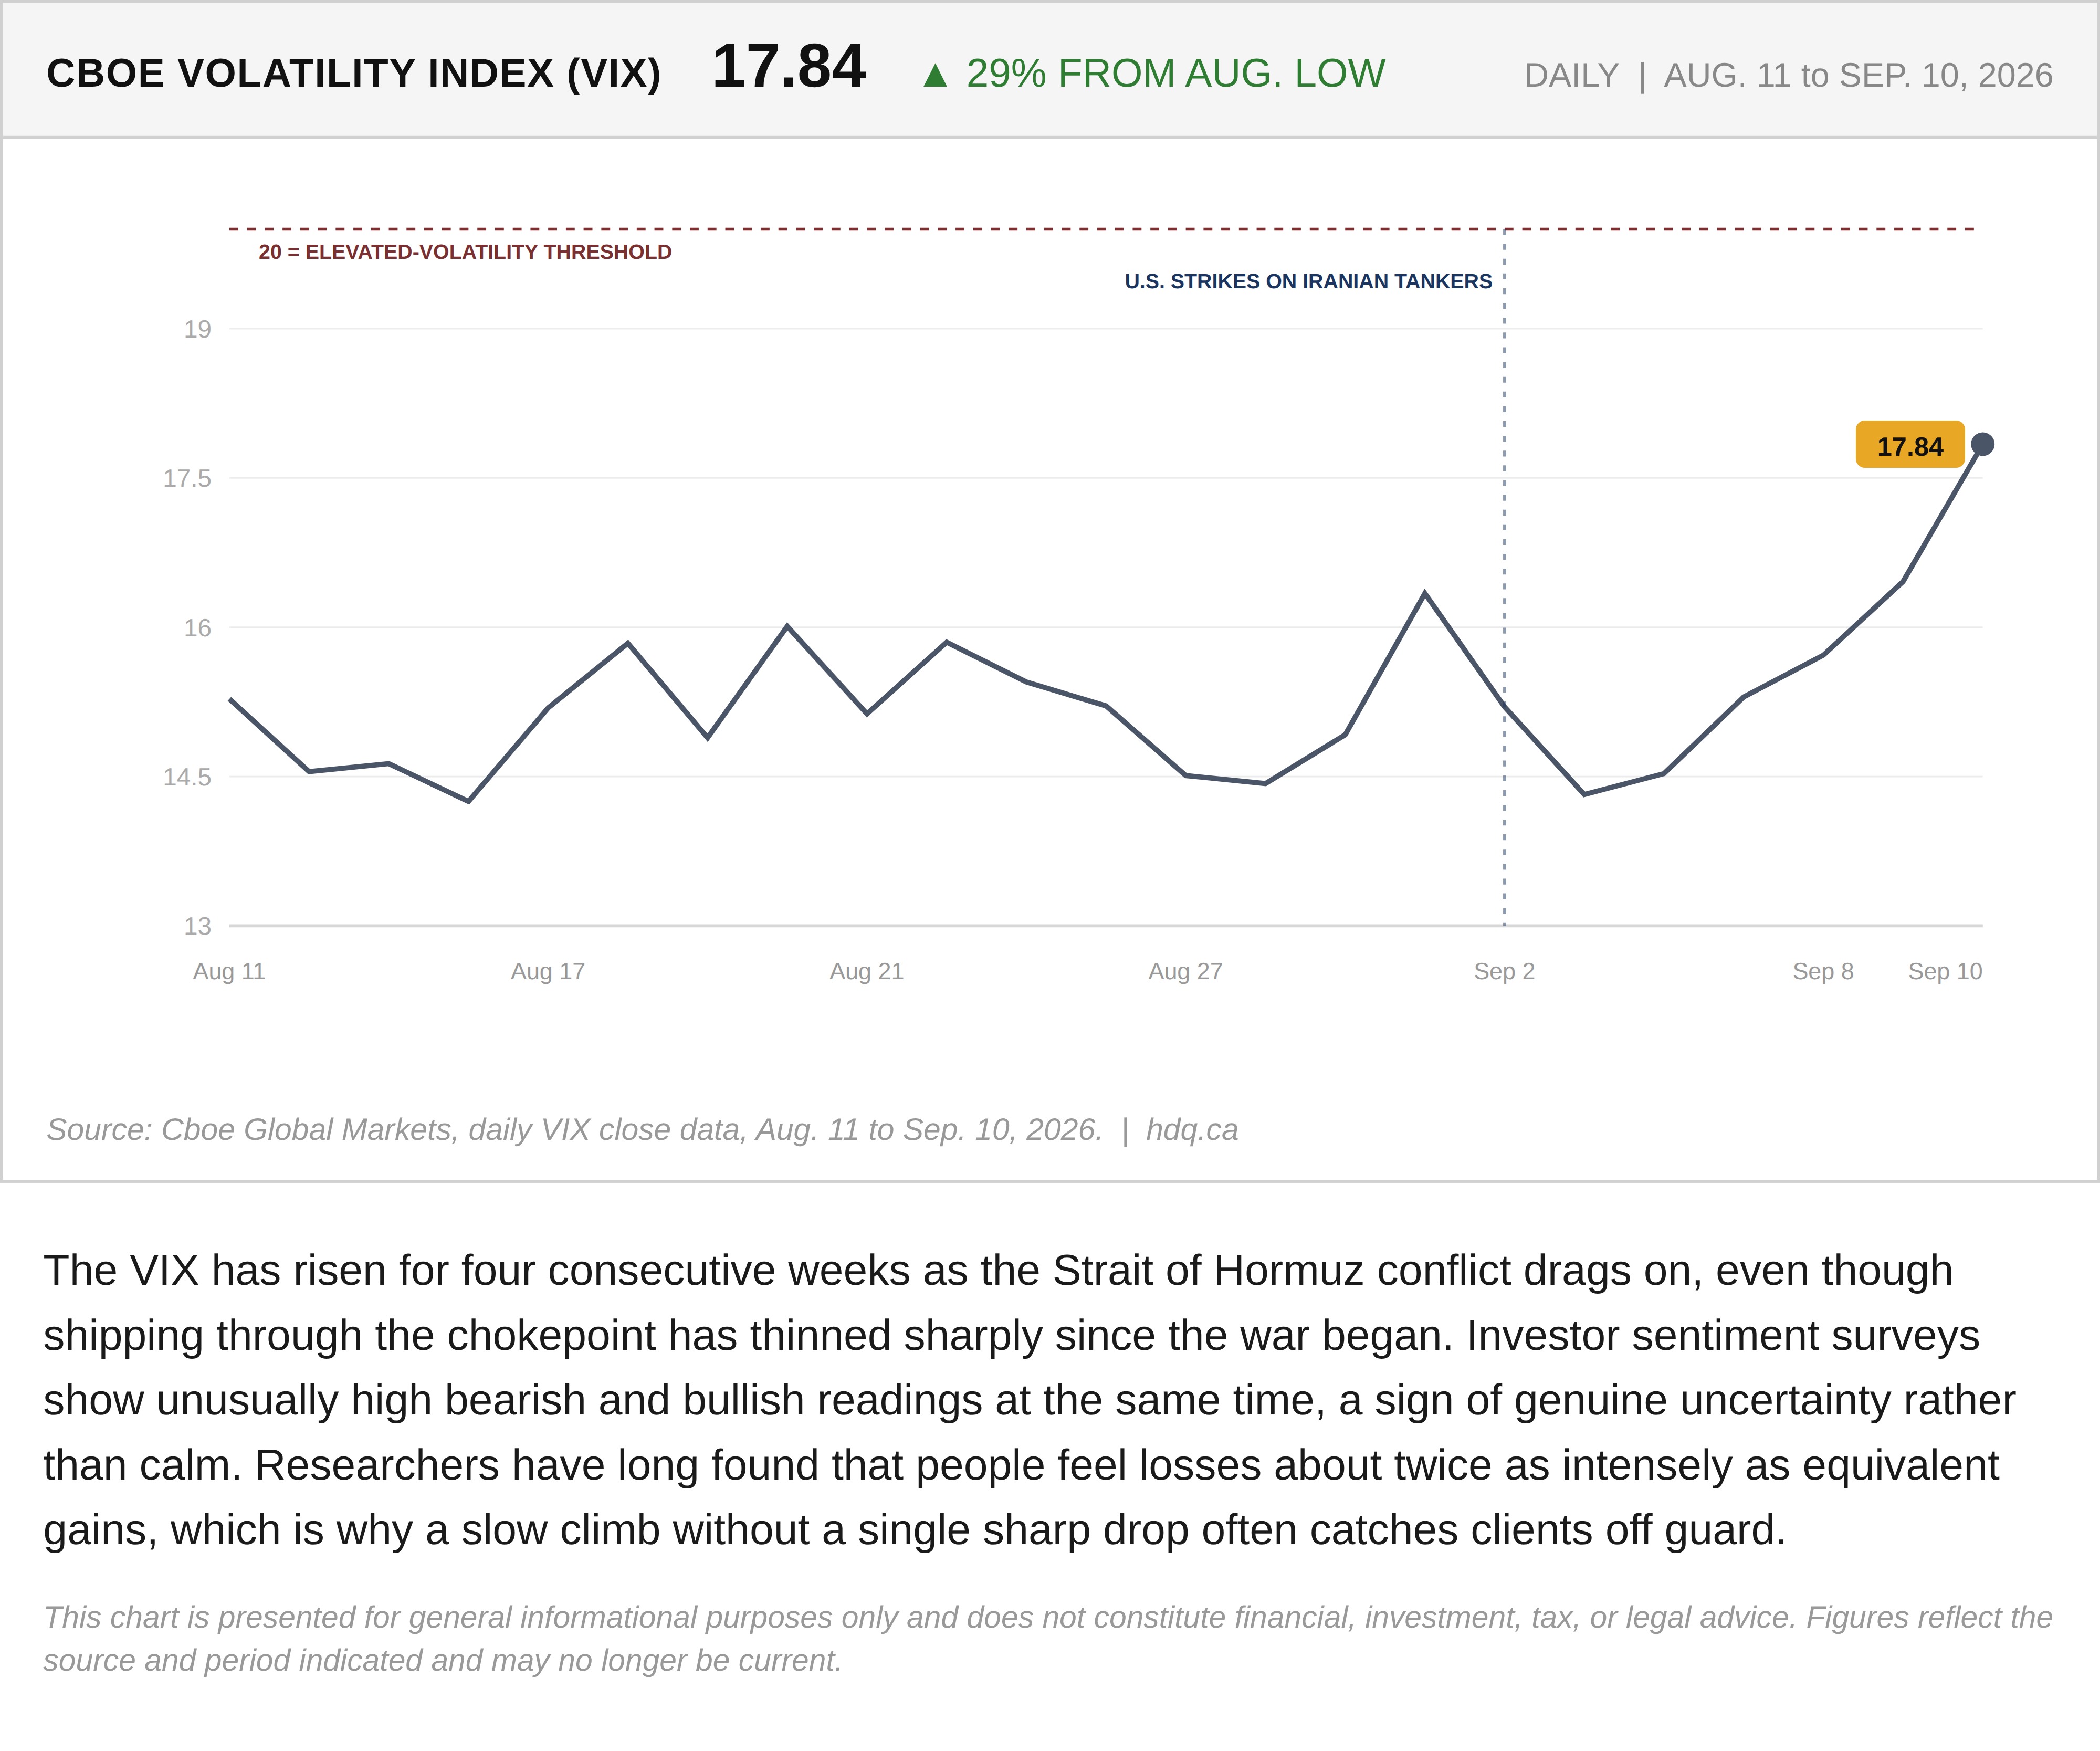
The VIX has risen for four consecutive weeks as the Strait of Hormuz conflict drags on, even though shipping through the chokepoint has thinned sharply since the war began. Investor sentiment surveys show unusually high bearish and bullish readings at the same time, a sign of genuine uncertainty rather than calm. Researchers have long found that people feel losses about twice as intensely as equivalent gains, which is why a slow climb without a single sharp drop often catches clients off guard.
This chart is presented for general informational purposes only and does not constitute financial, investment, tax, or legal advice. Figures reflect the source and period indicated and may no longer be current.
Related charts
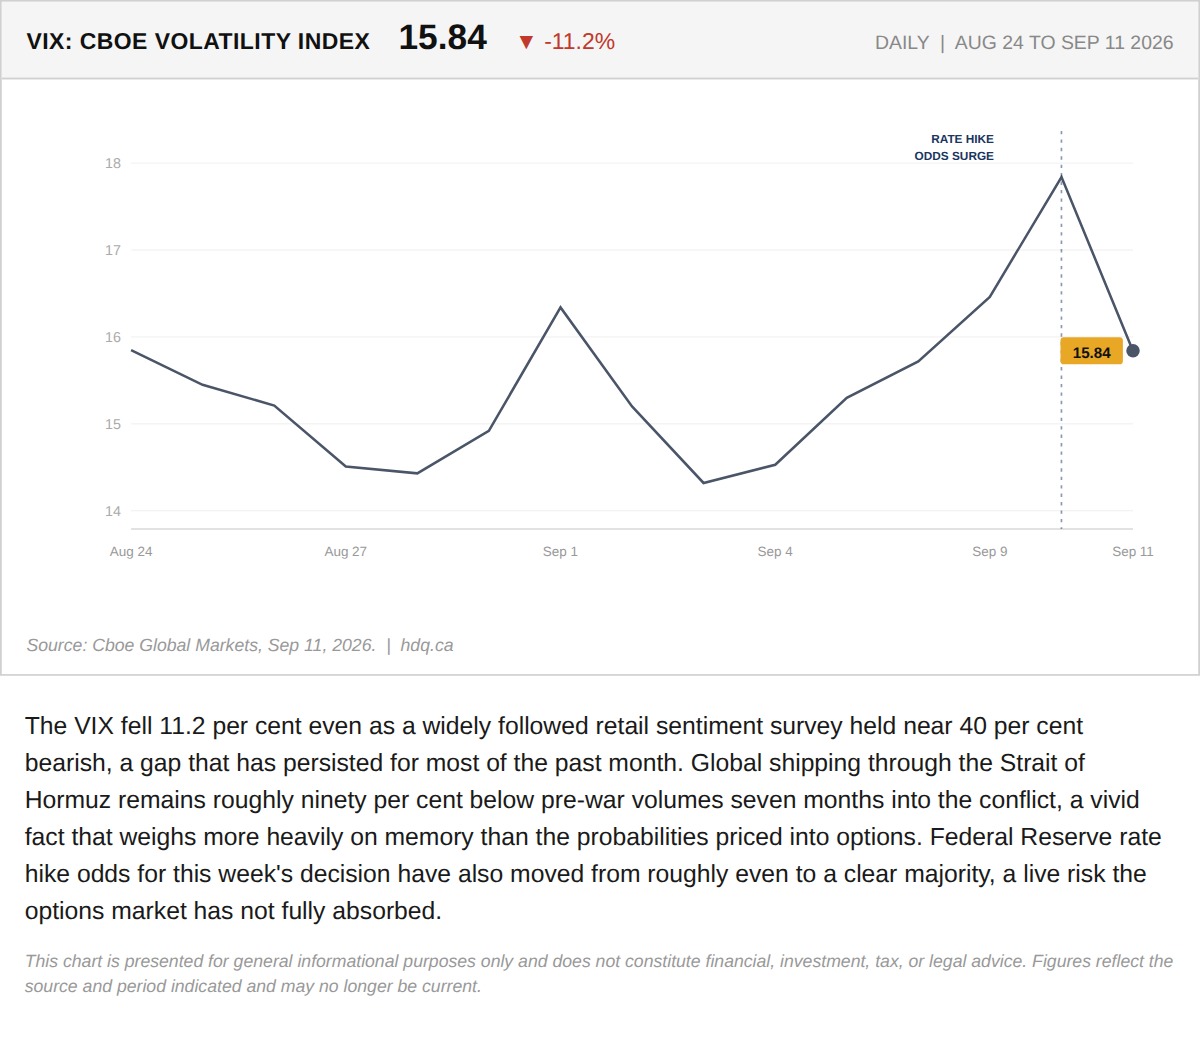
The VIX fell 11.2 per cent even as a widely followed retail sentiment survey held near 40 per cent bearish, a gap that has persisted for most of the past month.
Retail Investors Are More Afraid of the Hormuz War Than the Market Is
September 14, 2026
View chart & download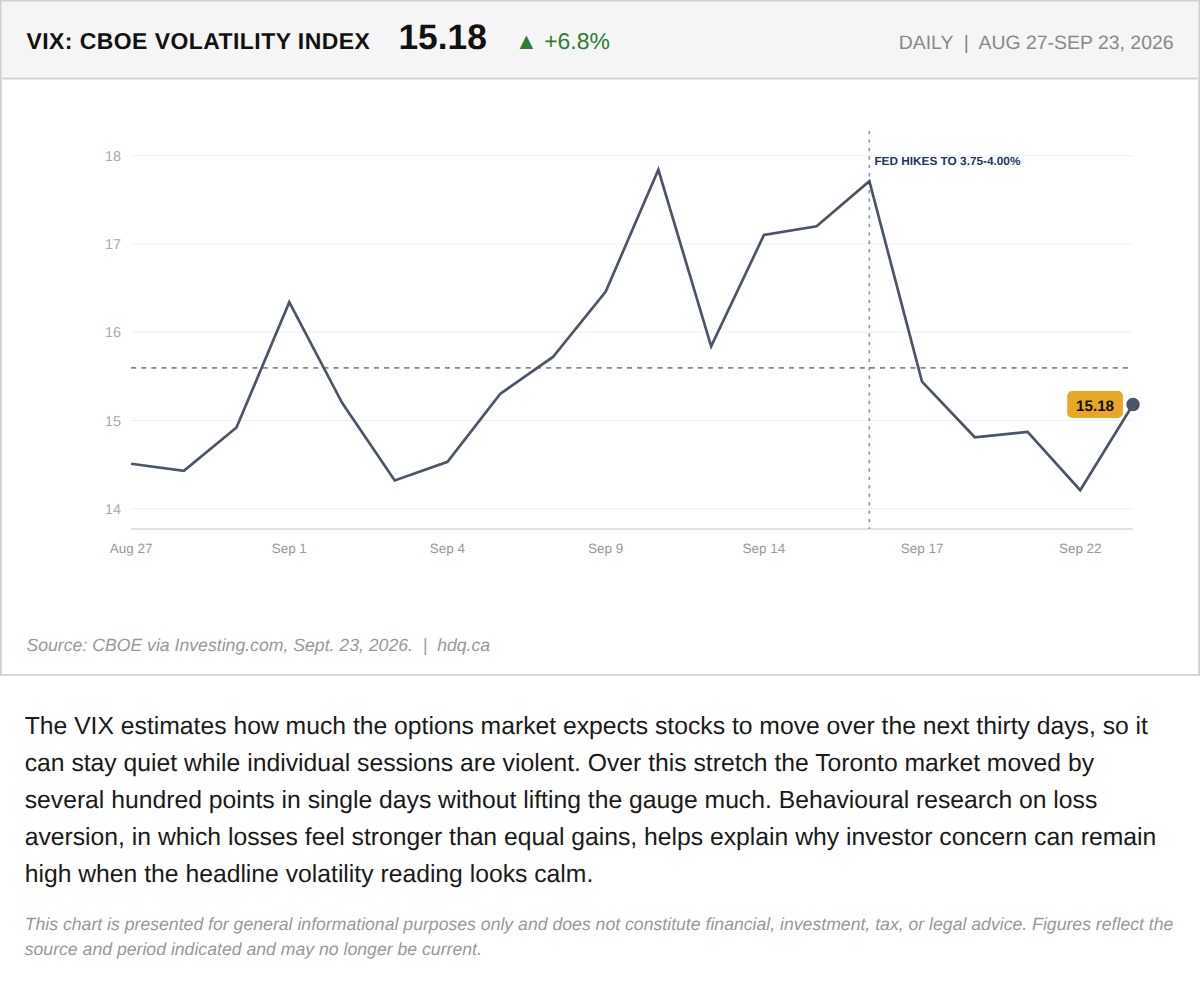
The VIX estimates how much the options market expects stocks to move over the next thirty days, so it can stay quiet while individual sessions are violent.
VIX Stays Subdued While the TSX Swings
September 24, 2026
View chart & download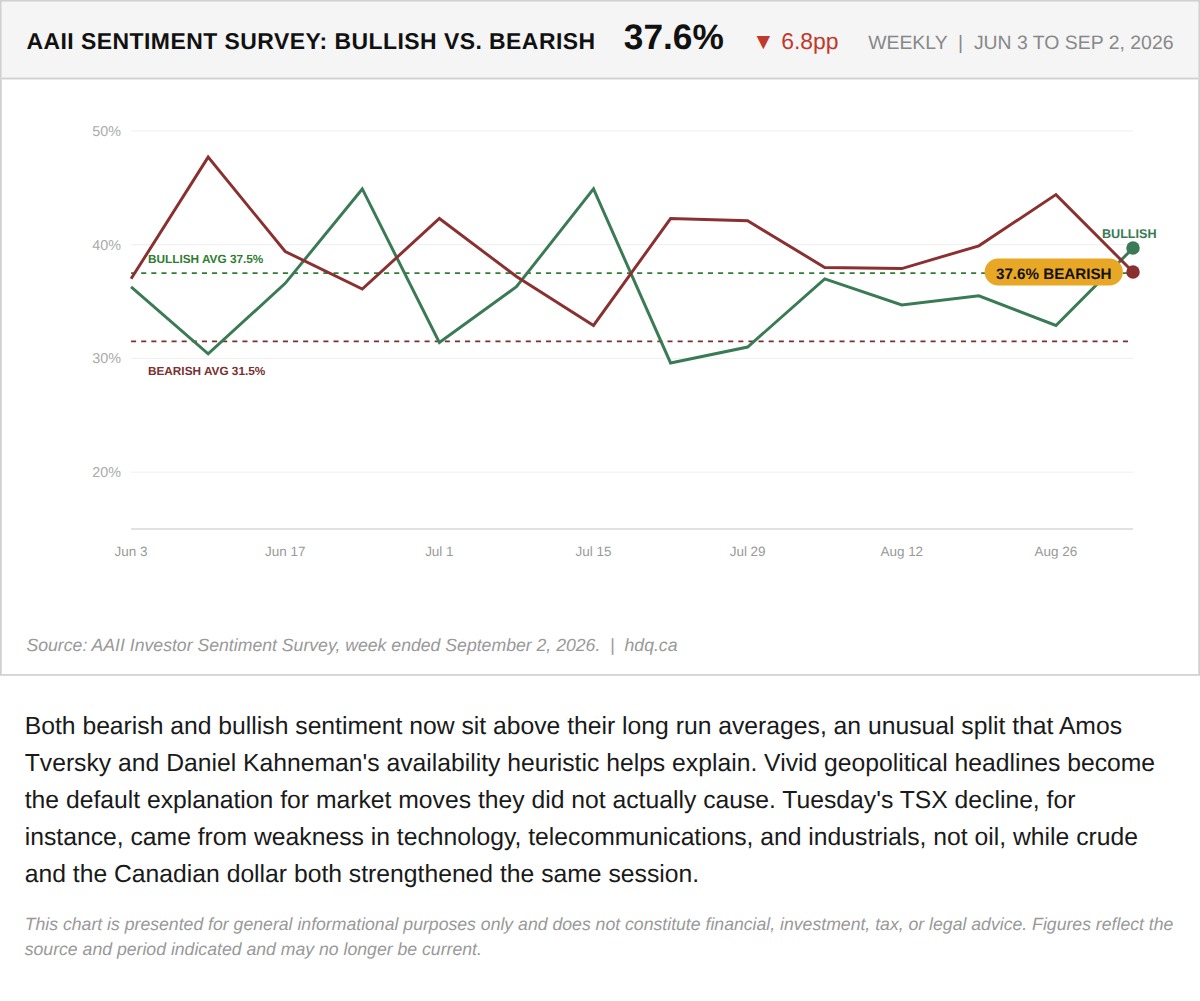
Both bearish and bullish sentiment now sit above their long run averages, an unusual split that Amos Tversky and Daniel Kahneman's availability heuristic helps explain.
Investors Are More Bearish and More Bullish Than Usual, and Tuesday's TSX Move Shows Why
September 9, 2026
View chart & download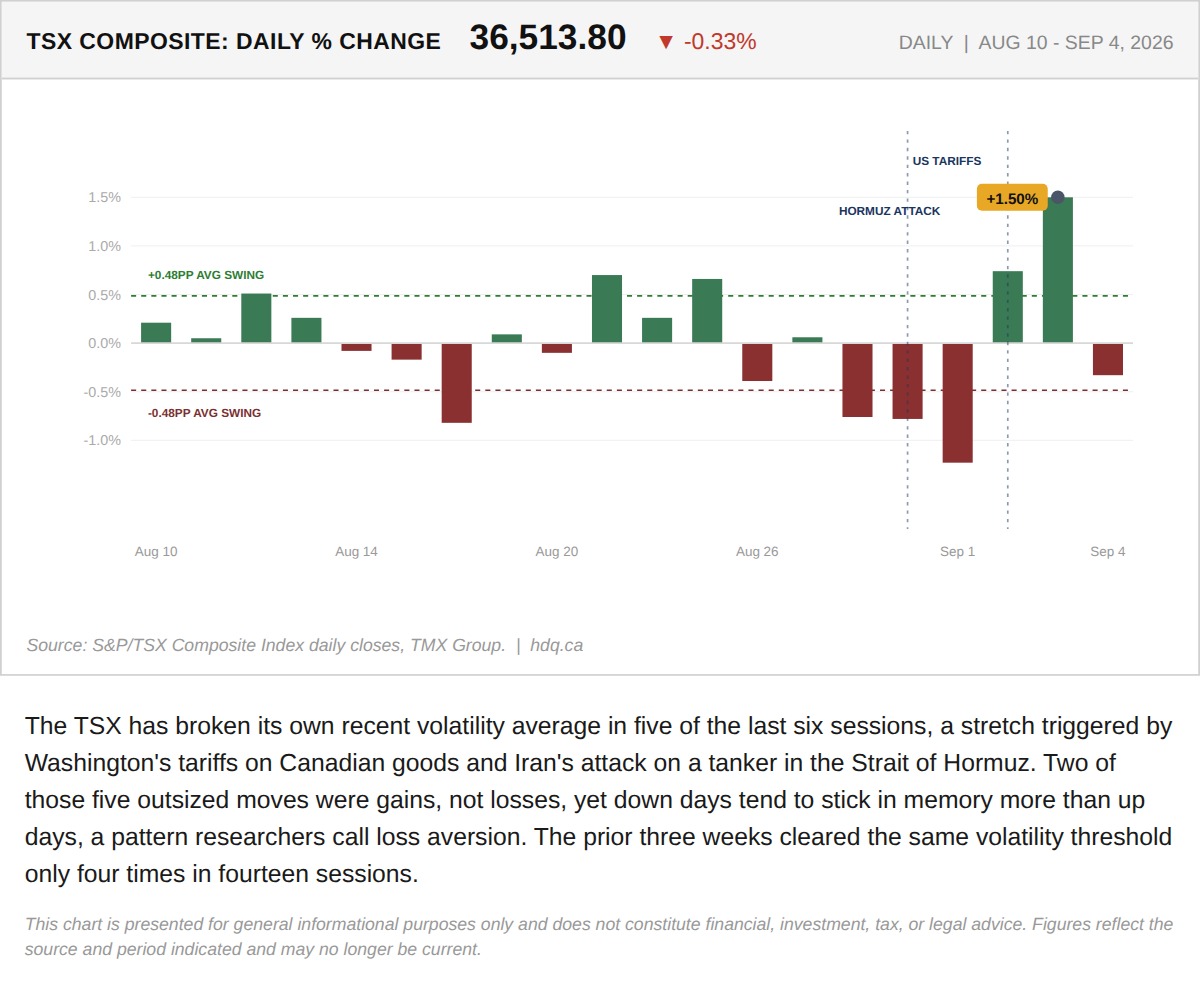
The TSX has broken its own recent volatility average in five of the last six sessions, a stretch triggered by Washington's tariffs on…
Why This Week Feels Worse Than the TSX Actually Performed
September 8, 2026
View chart & download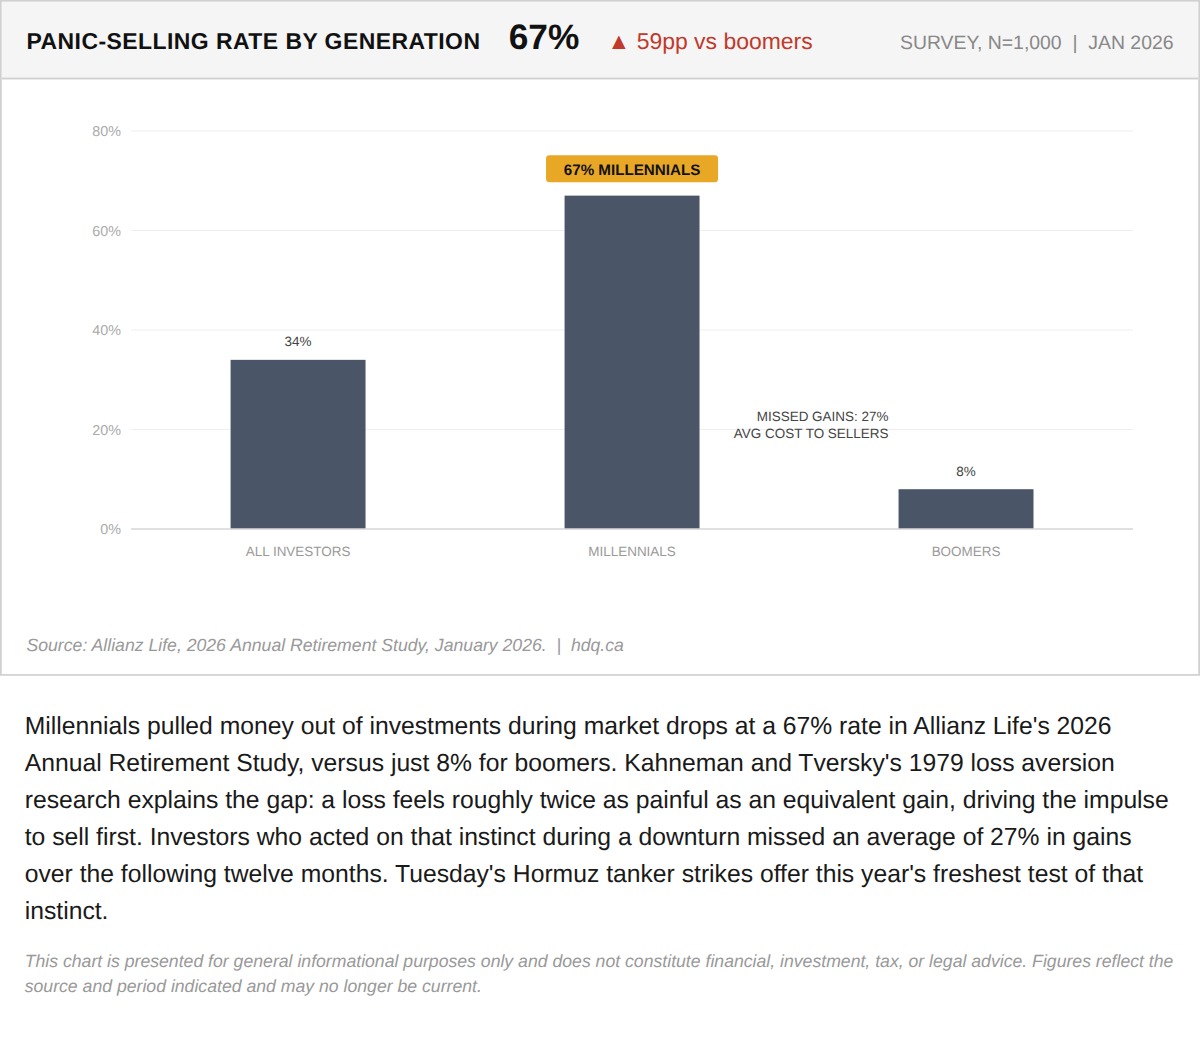
Millennials pulled money out of investments during market drops at a 67% rate in Allianz Life's 2026 Annual Retirement Study, versus just 8% for boomers.
Why Millennials Panic-Sell Eight Times More Than Boomers
September 1, 2026
View chart & download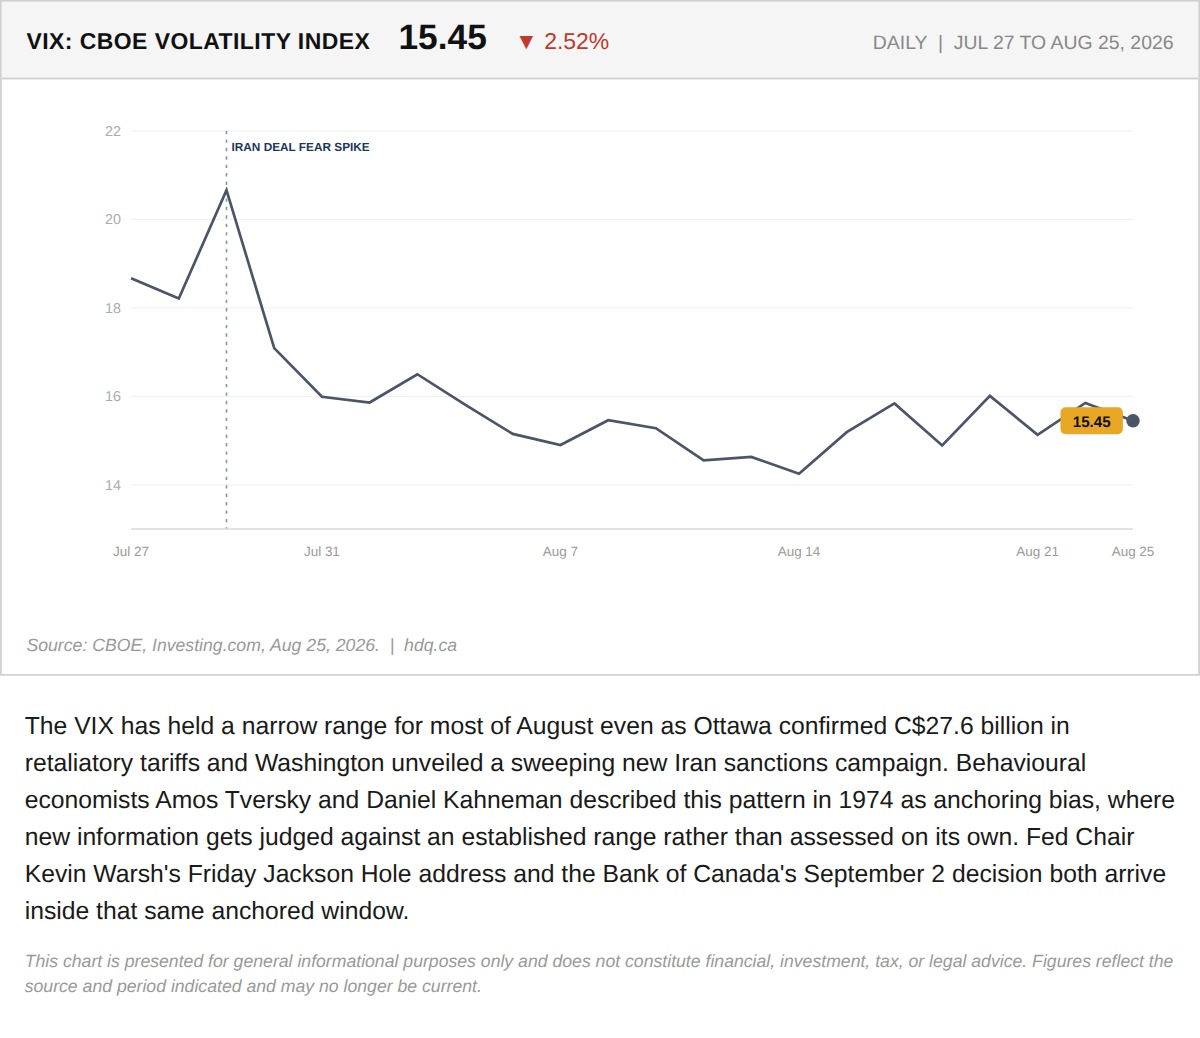
The VIX has held a narrow range for most of August even as Ottawa confirmed C$27.6 billion in retaliatory tariffs and Washington unveiled a sweeping new Iran sanctions campaign.
The VIX Has Not Moved in Three Weeks. That Is Not the Same as Markets Judging the Trade War Small.
August 26, 2026
View chart & download