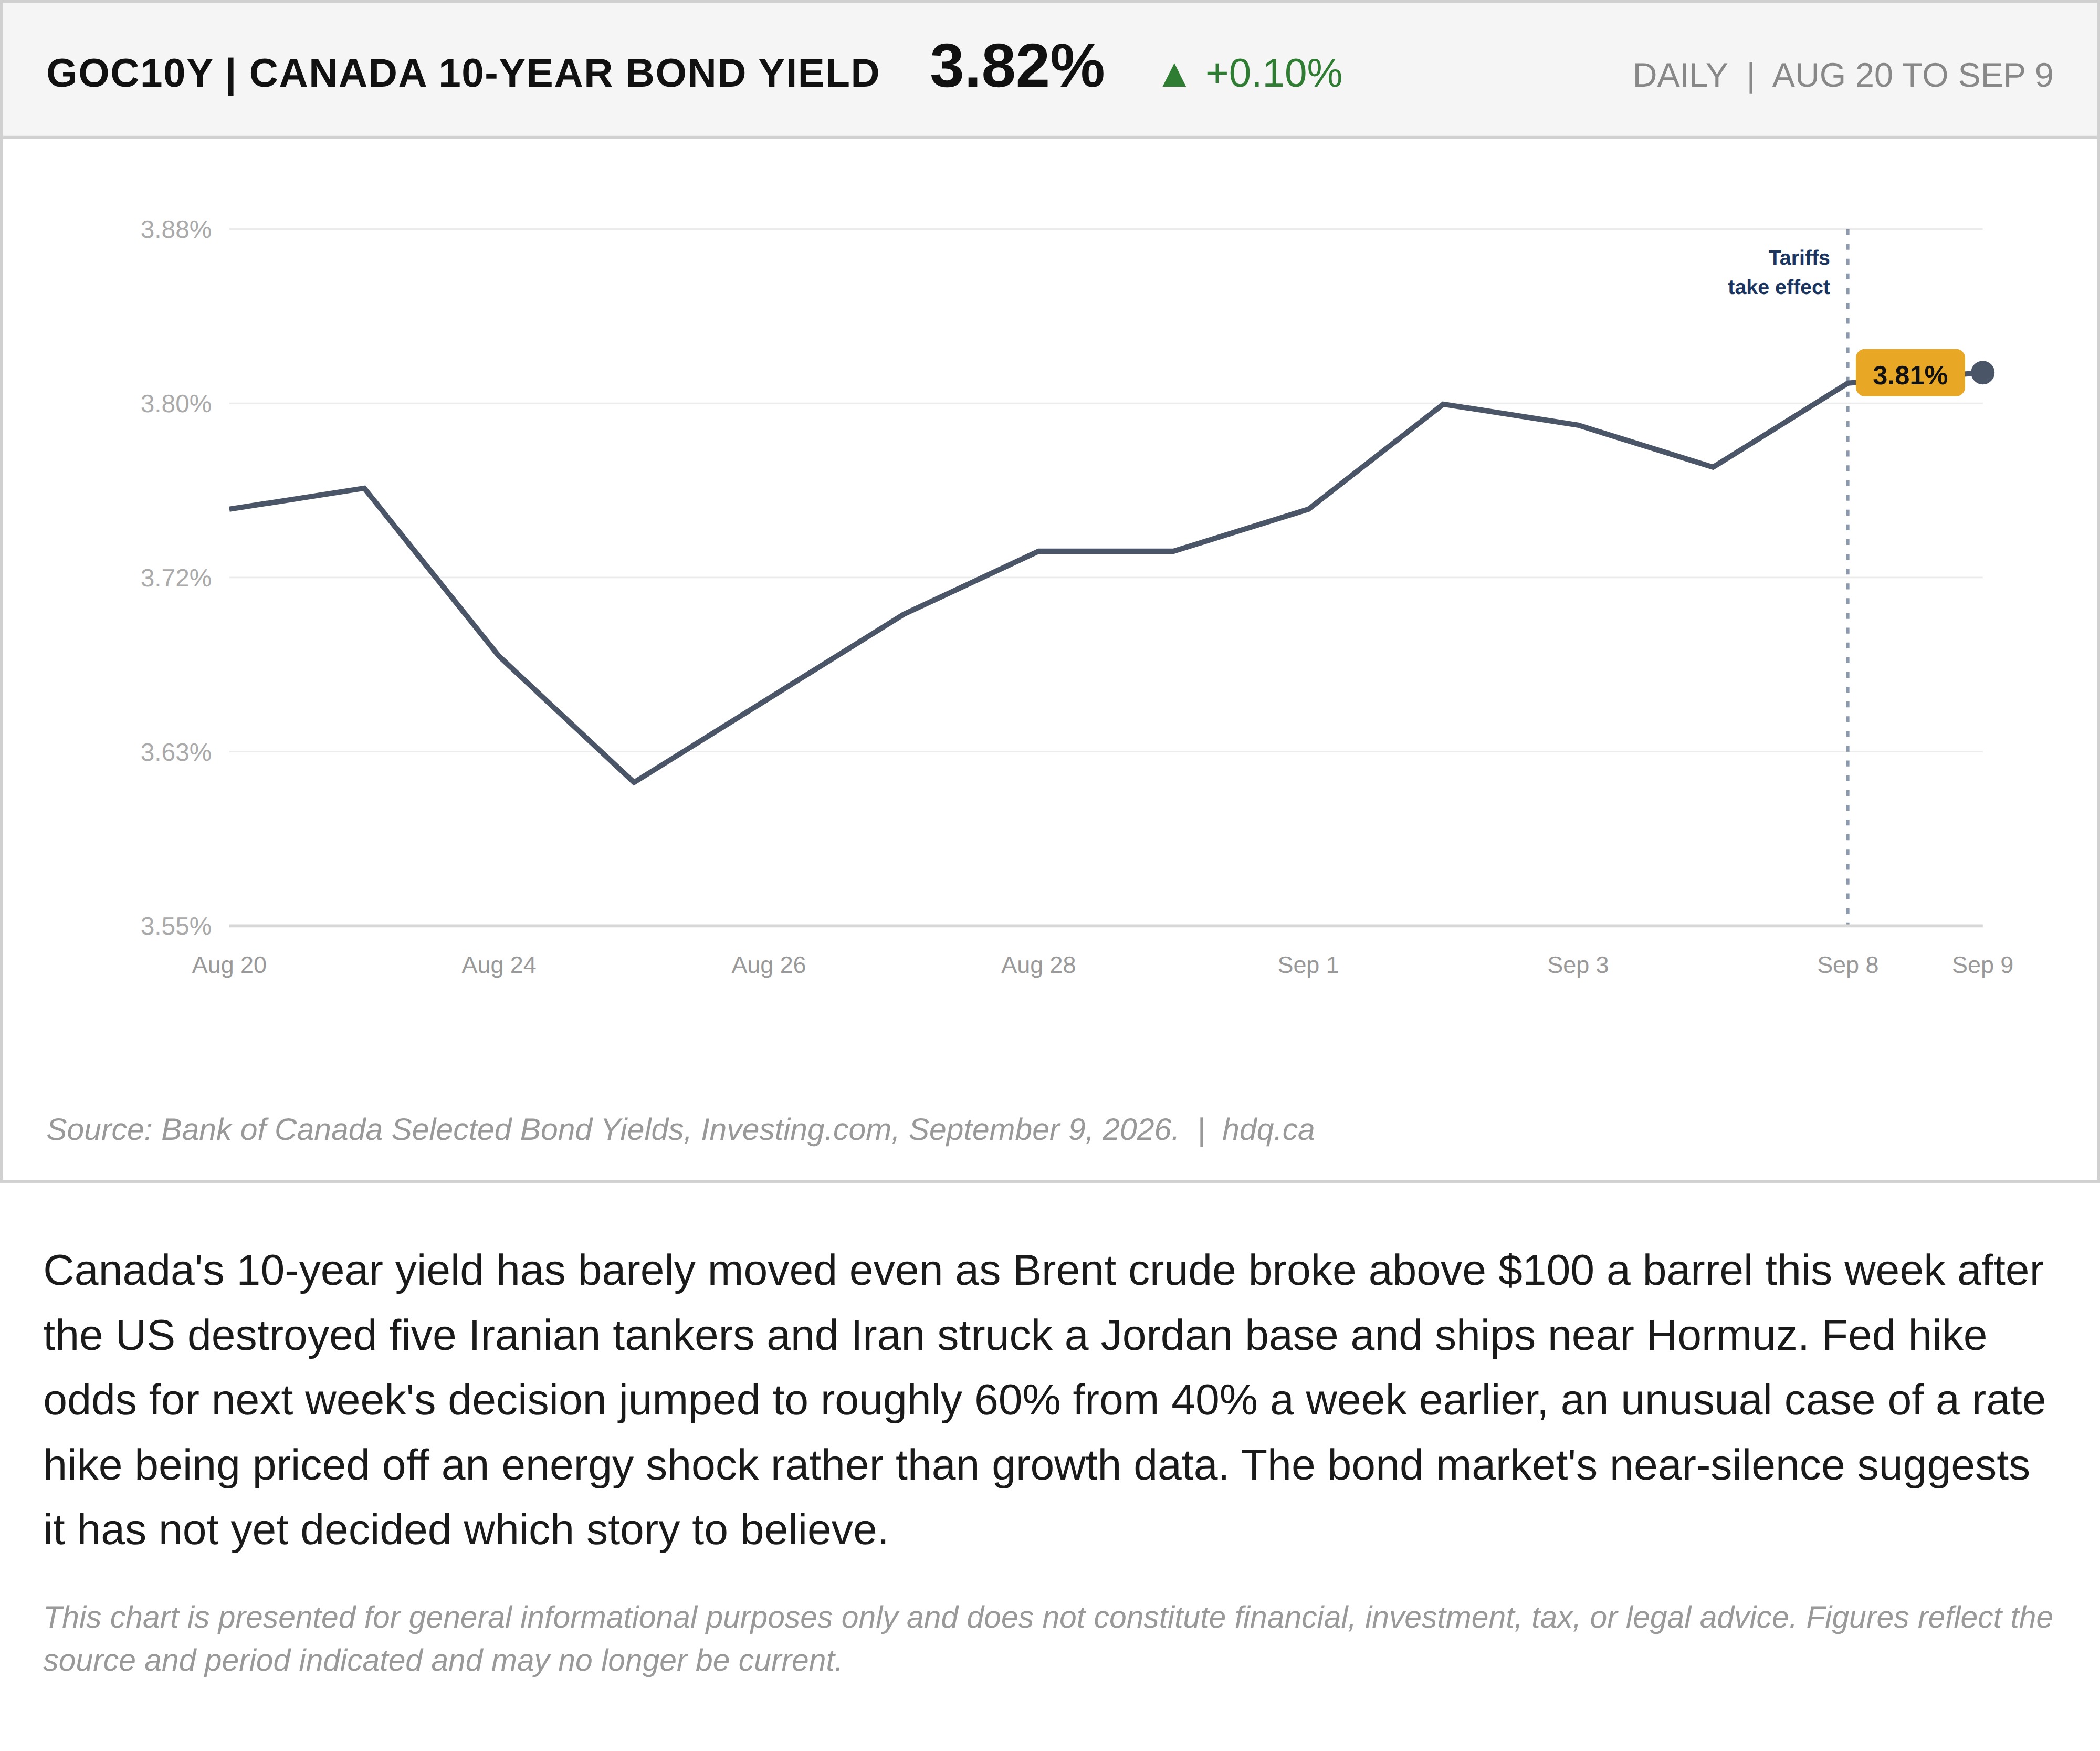
Canada's 10-year yield has barely moved even as Brent crude broke above $100 a barrel this week after the US destroyed five Iranian tankers and Iran struck a Jordan base and ships near Hormuz. Fed hike odds for next week's decision jumped to roughly 60% from 40% a week earlier, an unusual case of a rate hike being priced off an energy shock rather than growth data. The bond market's near-silence suggests it has not yet decided which story to believe.
This chart is presented for general informational purposes only and does not constitute financial, investment, tax, or legal advice. Figures reflect the source and period indicated and may no longer be current.
Related charts
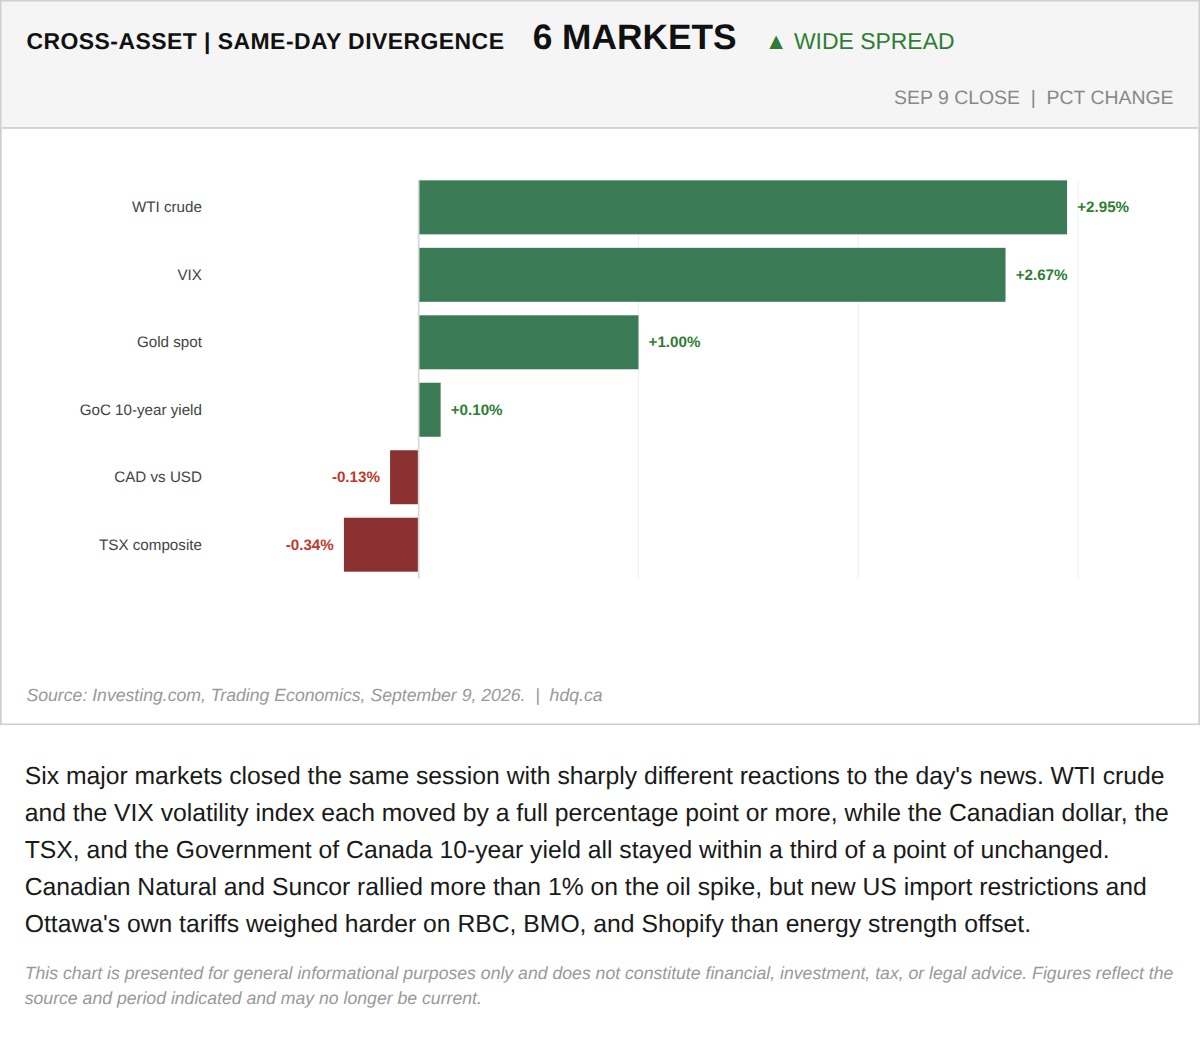
Six major markets closed the same session with sharply different reactions to the day's news.
Six Markets, Six Different Reactions: The Same-Day Divergence Behind September 9's Headlines
September 9, 2026
View chart & download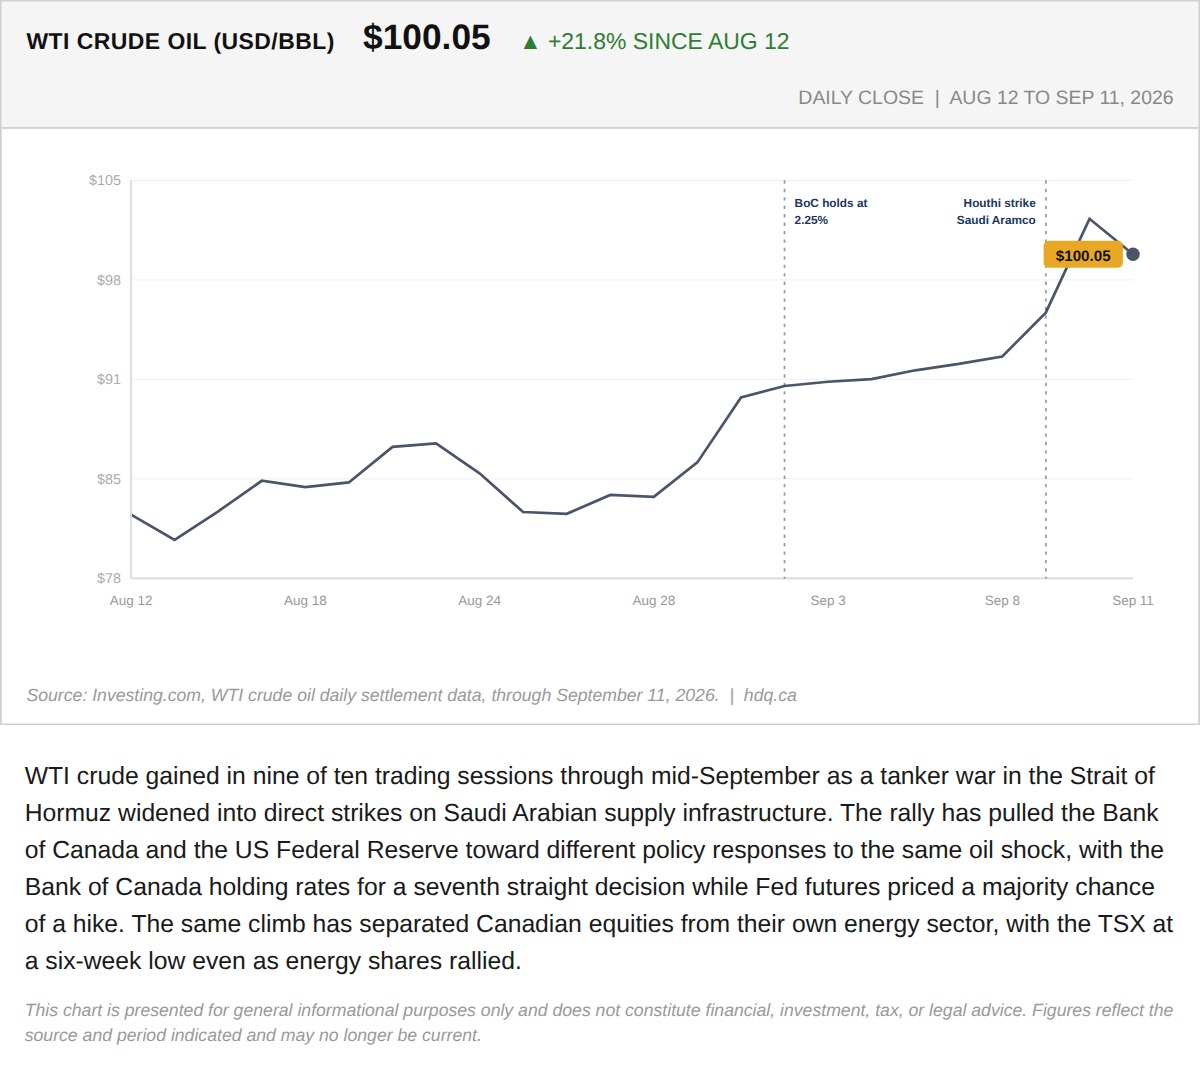
WTI crude gained in nine of ten trading sessions through mid-September as a tanker war in the Strait of Hormuz widened into direct strikes on Saudi Arabian supply infrastructure.
The Week the Same Barrel of Oil Split the BoC From the Fed and the TSX From Its Own Energy Sector
September 12, 2026
View chart & download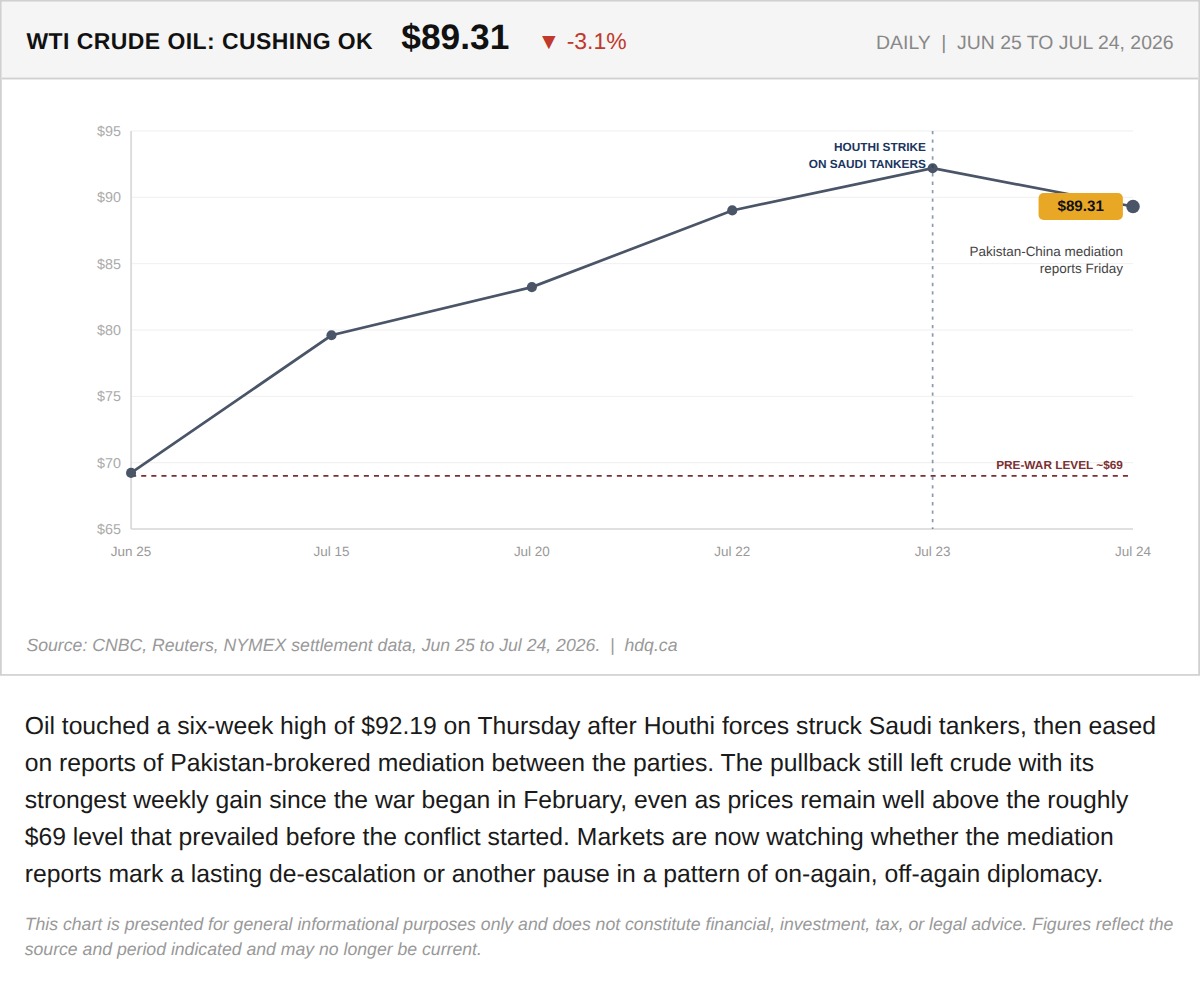
Oil touched a six-week high of $92.19 on Thursday after Houthi forces struck Saudi tankers, then eased on reports of Pakistan-brokered mediation between the parties.
Oil Pulls Back to $89.31 After Six-Week High on Mediation Reports
July 25, 2026
View chart & download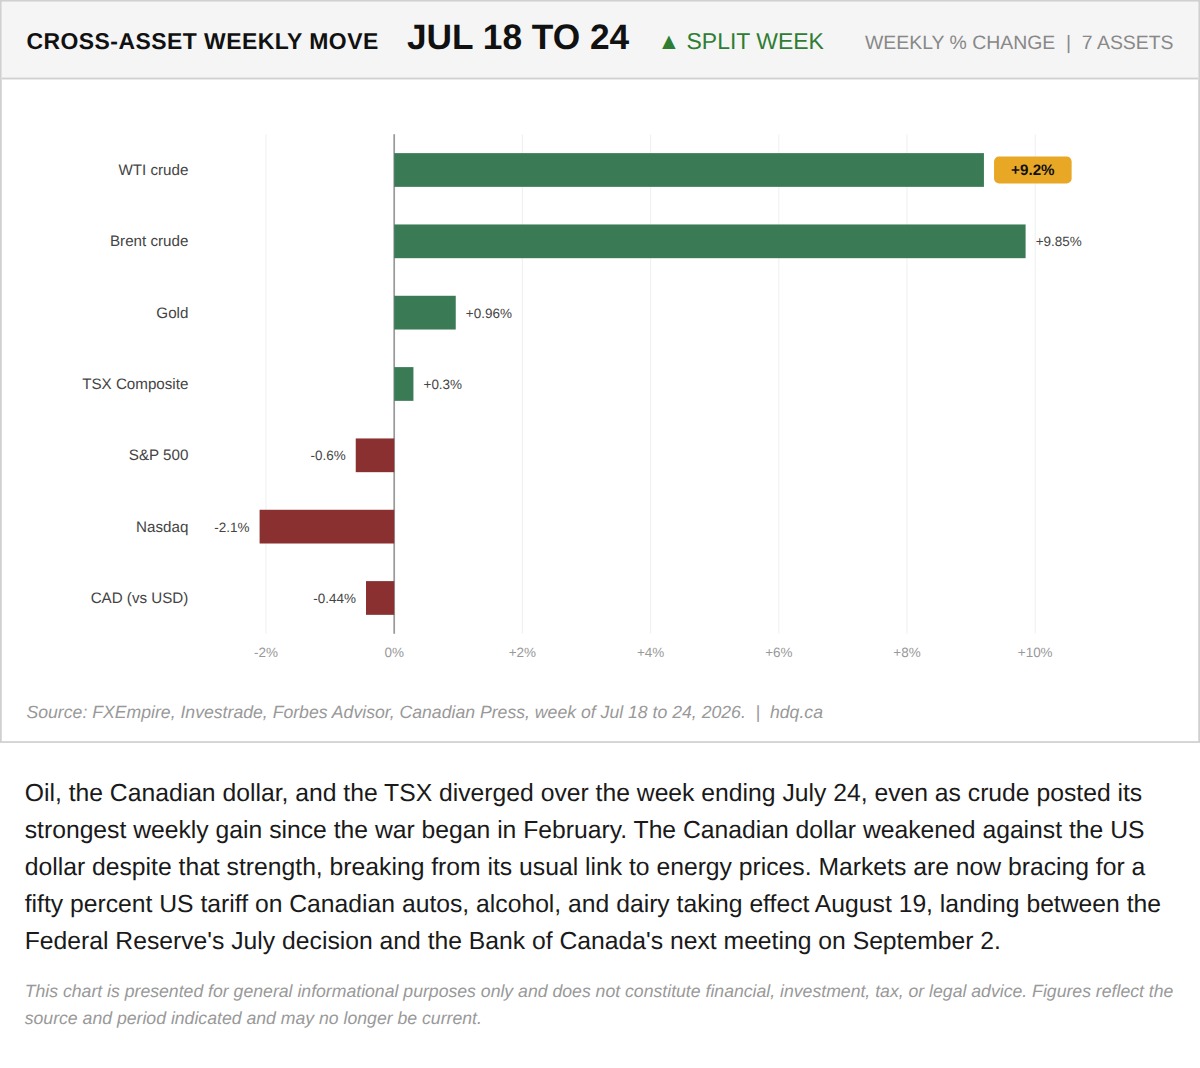
Oil, the Canadian dollar, and the TSX diverged over the week ending July 24, even as crude posted its strongest weekly gain since the war began in February.
Cross-Asset Weekly Moves: Oil Rallies, Loonie Falls Anyway
July 25, 2026
View chart & download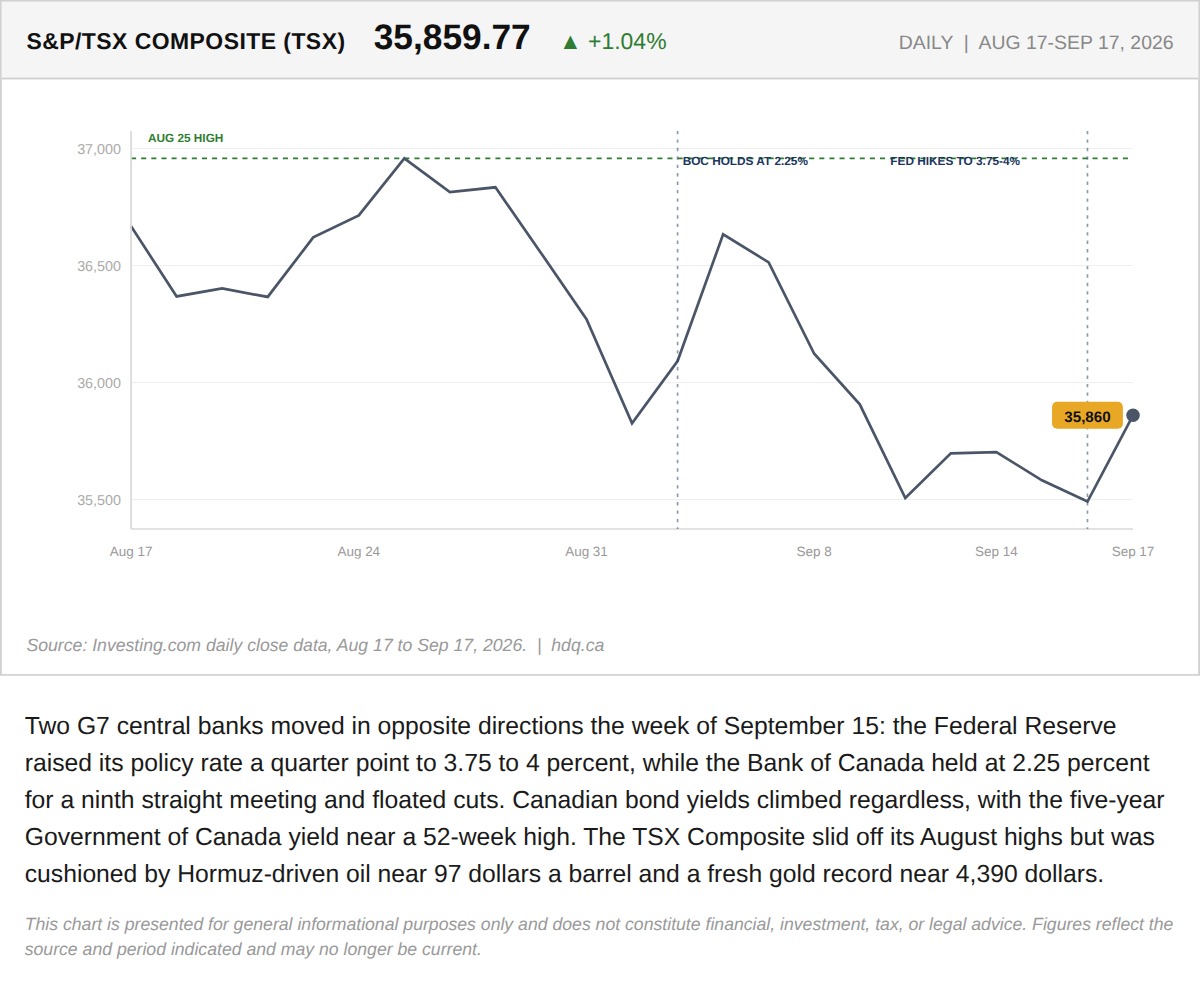
Two G7 central banks moved in opposite directions the week of September 15: the Federal Reserve raised its policy rate a quarter point to…
The Week the Bank of Canada's Own Rate Stopped Setting Canadian Borrowing Costs
September 19, 2026
View chart & download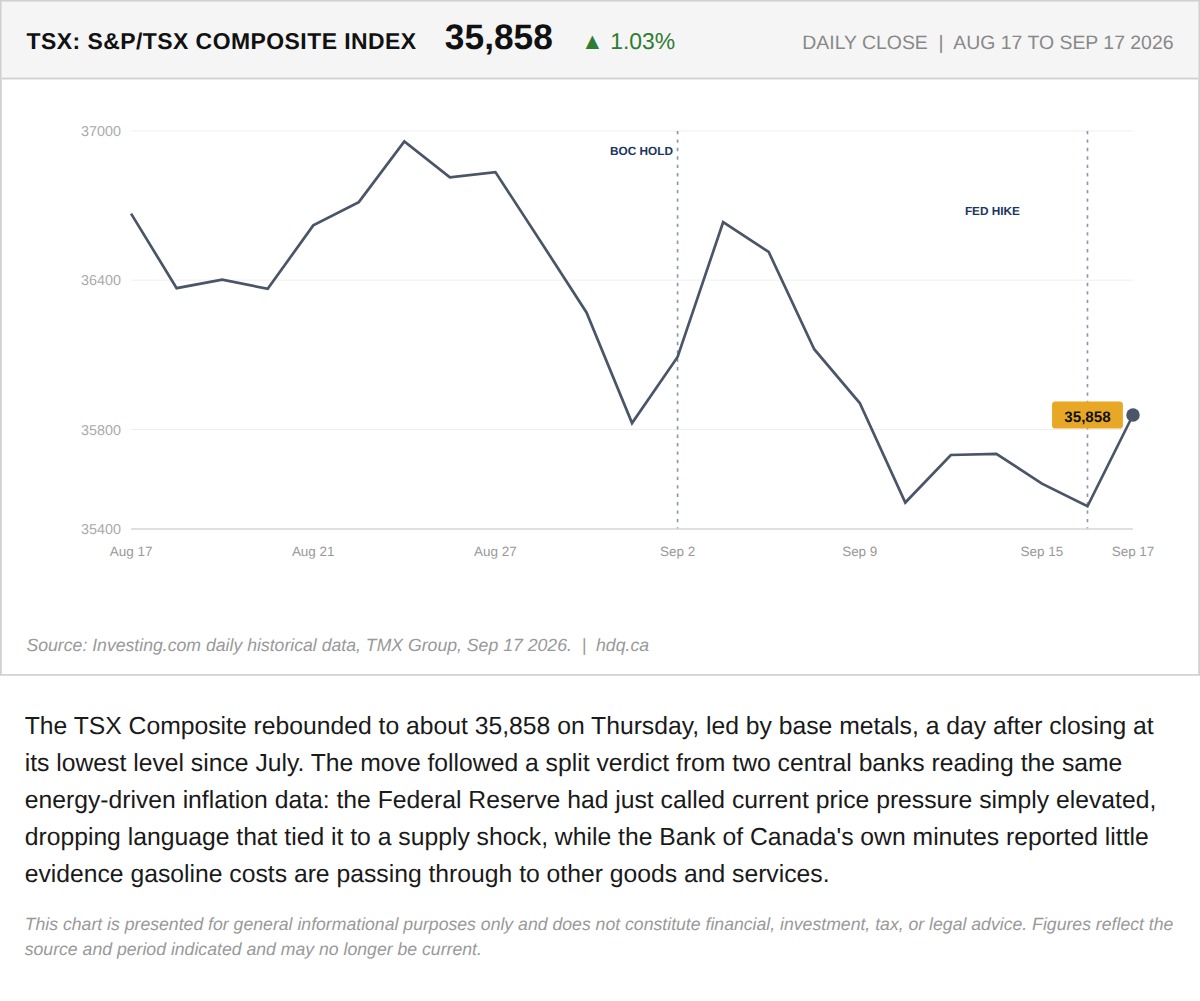
The TSX Composite rebounded to about 35,858 on Thursday, led by base metals, a day after closing at its lowest level since July.
The Fed Called an Oil Shock Elevated the Same Day the BoC Found No Sign It Has Spread
September 17, 2026
View chart & download