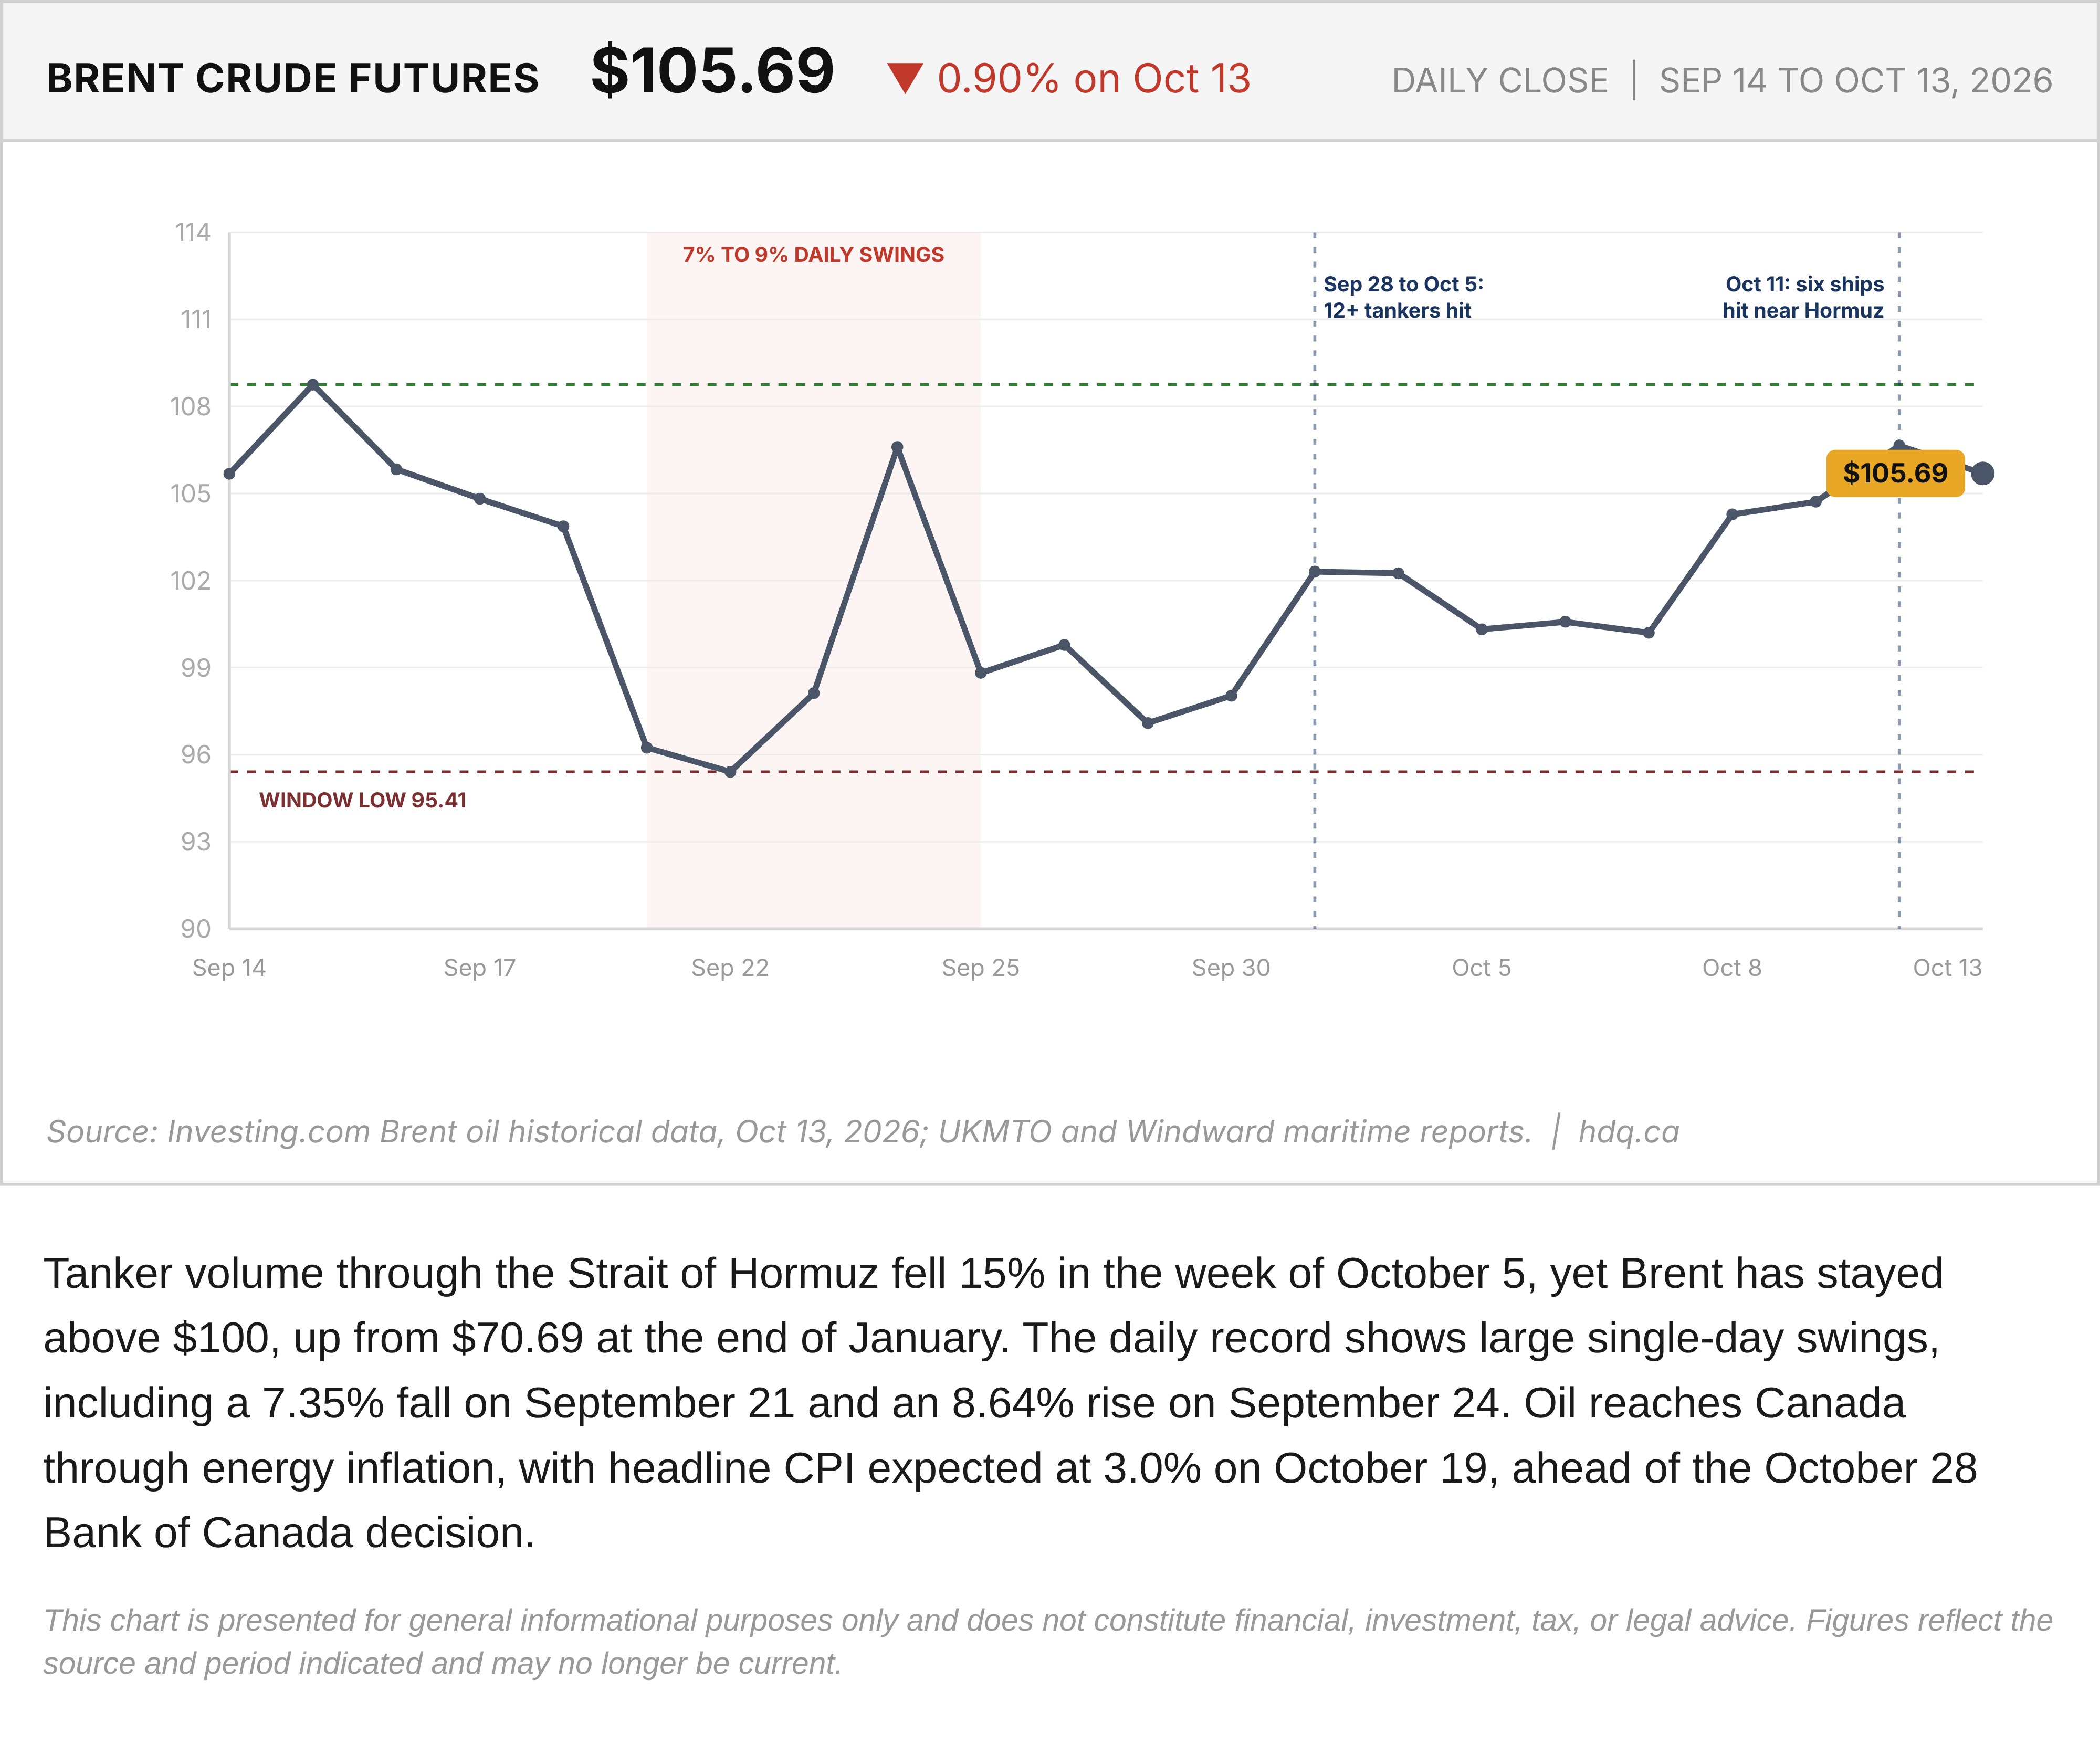
Tanker volume through the Strait of Hormuz fell 15% in the week of October 5, yet Brent has stayed above $100, up from $70.69 at the end of January. The daily record shows large single-day swings, including a 7.35% fall on September 21 and an 8.64% rise on September 24. Oil reaches Canada through energy inflation, with headline CPI expected at 3.0% on October 19, ahead of the October 28 Bank of Canada decision.
This chart is presented for general informational purposes only and does not constitute financial, investment, tax, or legal advice. Figures reflect the source and period indicated and may no longer be current.
Related charts
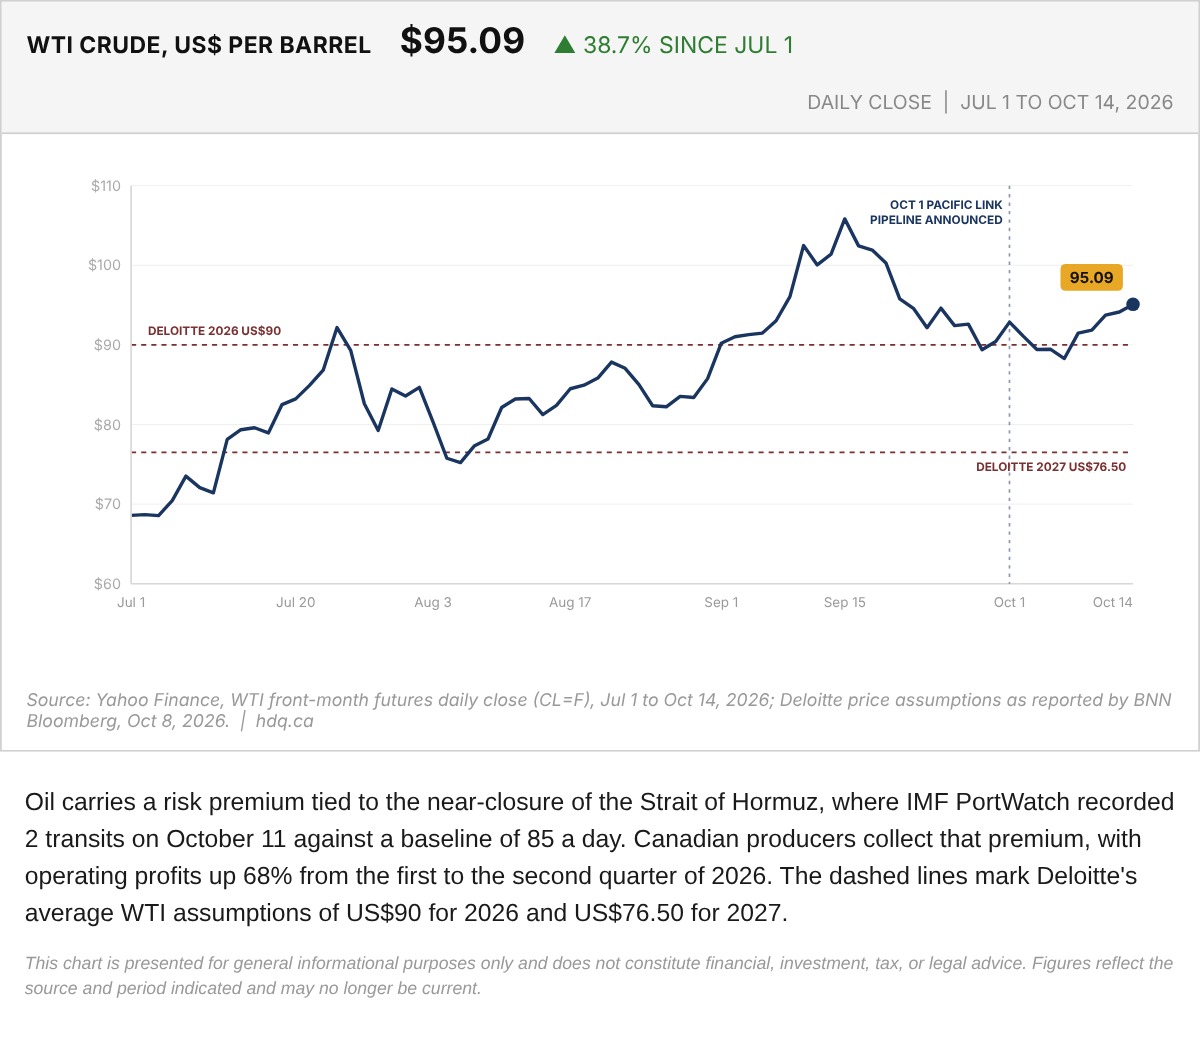
Oil carries a risk premium tied to the near-closure of the Strait of Hormuz, where IMF PortWatch recorded 2 transits on October 11 against a baseline of 85 a day.
WTI Crude Oil Price, July 1 to October 14, 2026
October 14, 2026
View chart & download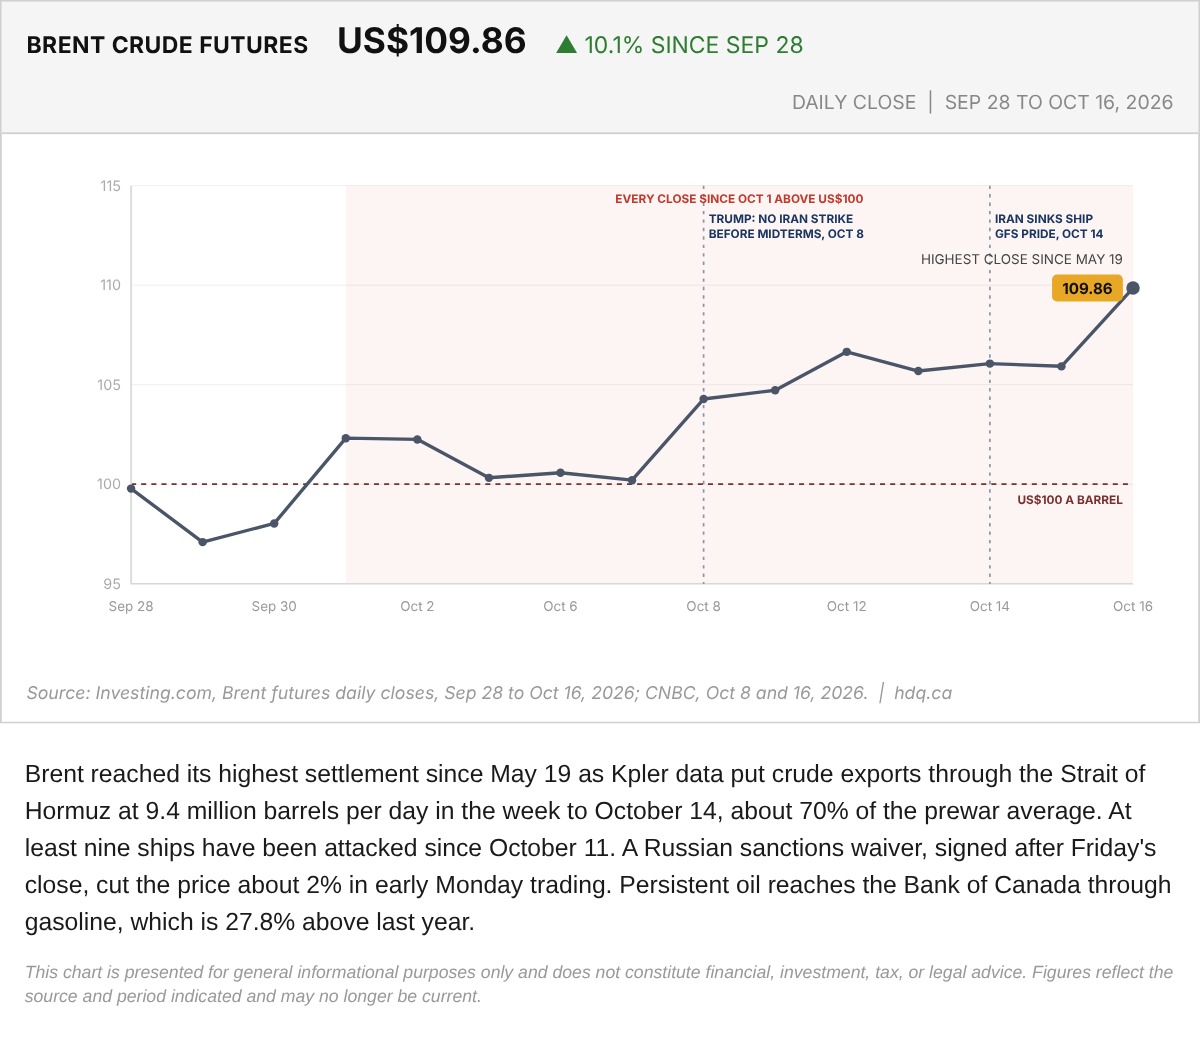
Brent reached its highest settlement since May 19 as Kpler data put crude exports through the Strait of Hormuz at 9.4 million barrels per…
Brent Crude Oil Futures, September 28 to October 16, 2026
October 16, 2026
View chart & download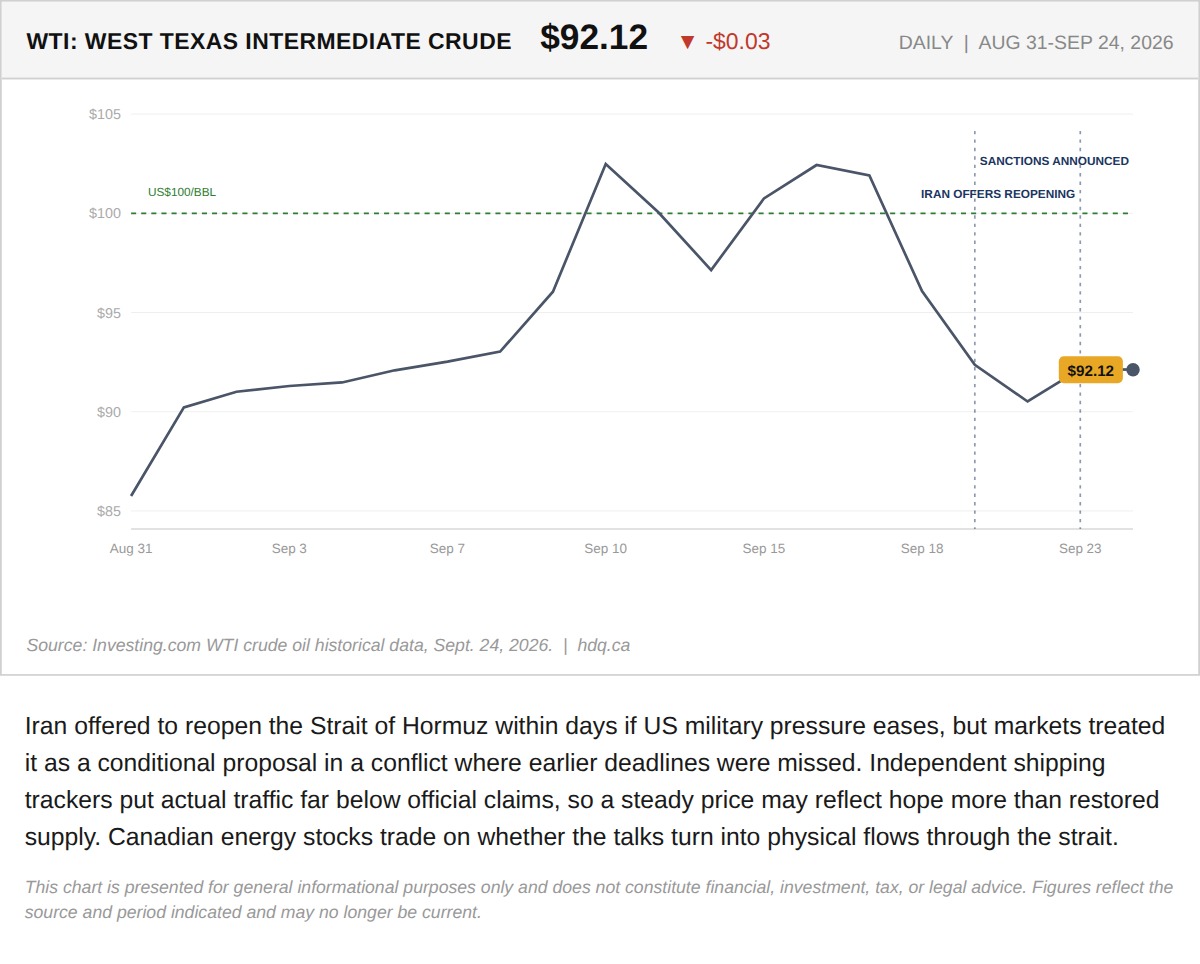
Iran offered to reopen the Strait of Hormuz within days if US military pressure eases, but markets treated it as a conditional proposal in…
WTI Crude Holds Near $92 on Hormuz Reopening Offer
September 24, 2026
View chart & download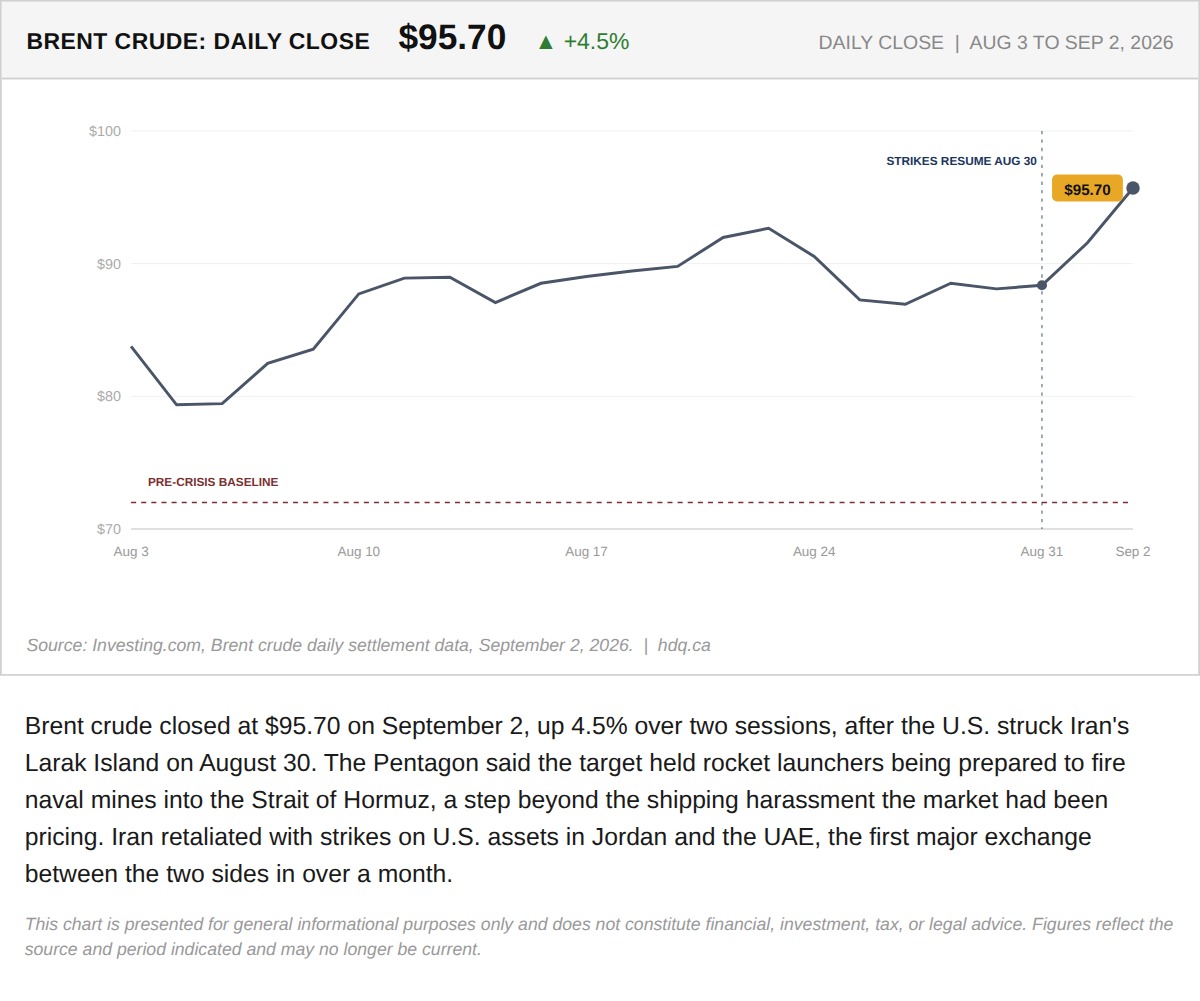
Brent crude closed at $95.70 on September 2, up 4.5% over two sessions, after the U.S.
Brent Crude Rallies 4.5% After U.S. Strike on Iran's Larak Island
September 2, 2026
View chart & download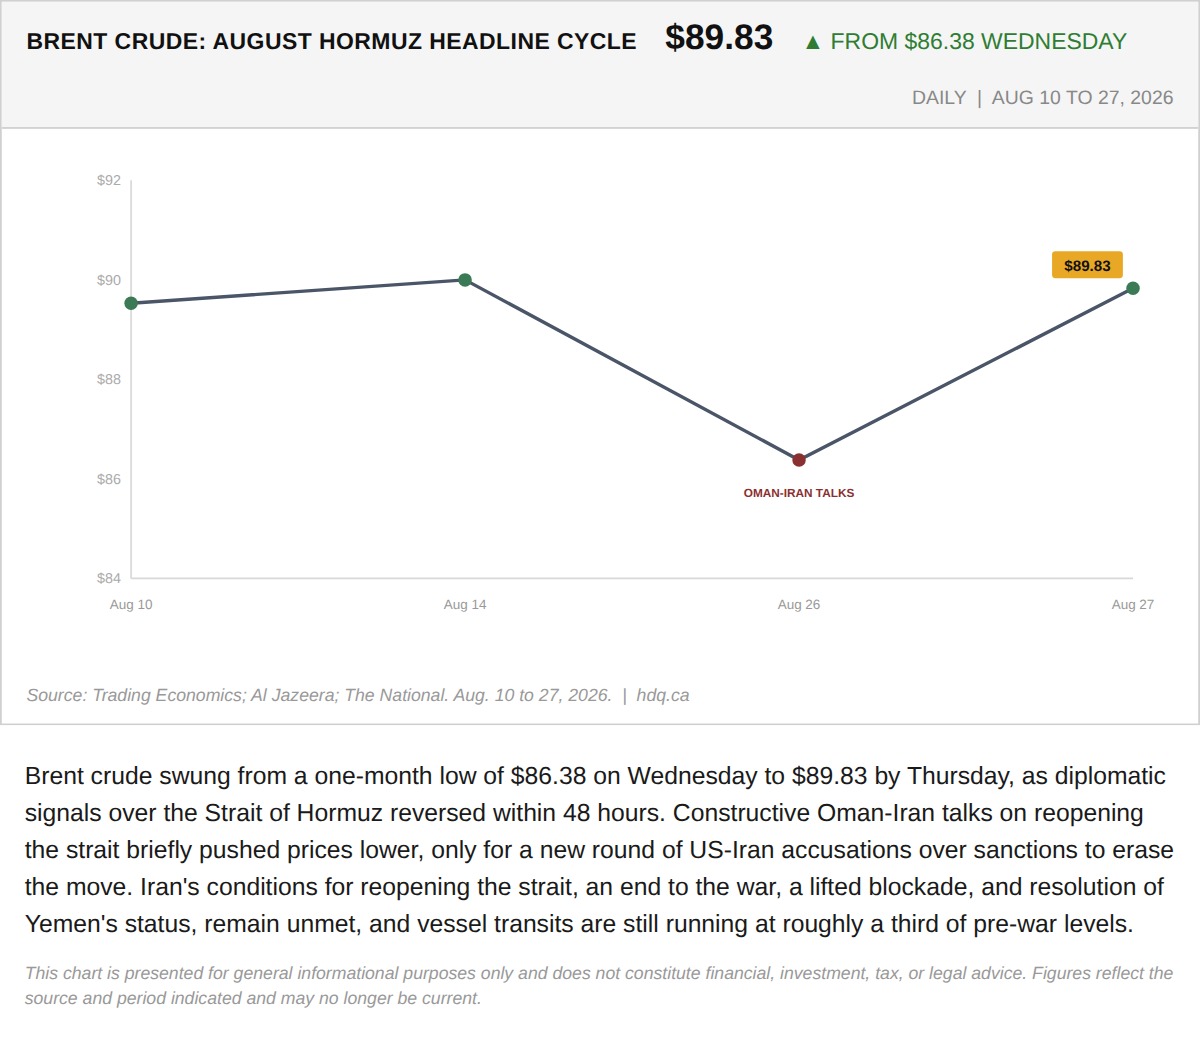
Brent crude swung from a one-month low of $86.38 on Wednesday to $89.83 by Thursday, as diplomatic signals over the Strait of Hormuz reversed within 48 hours.
Oil's 48 Hour Reversal Shows Why Hormuz Remains a Tail Risk, Not a Resolved Story
August 28, 2026
View chart & download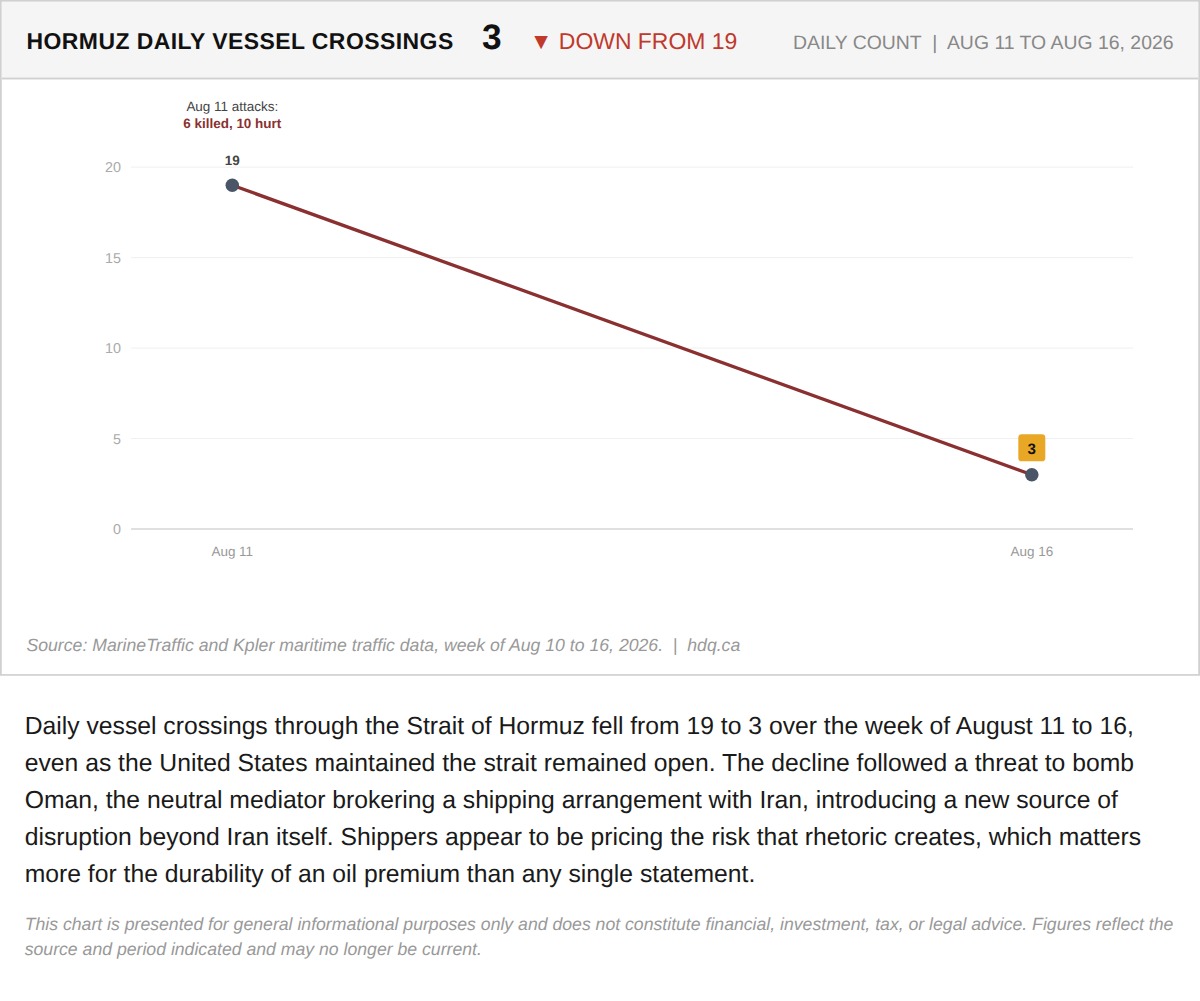
Daily vessel crossings through the Strait of Hormuz fell from 19 to 3 over the week of August 11 to 16, even as the United States maintained the strait remained open.
August 16, 2026
View chart & download