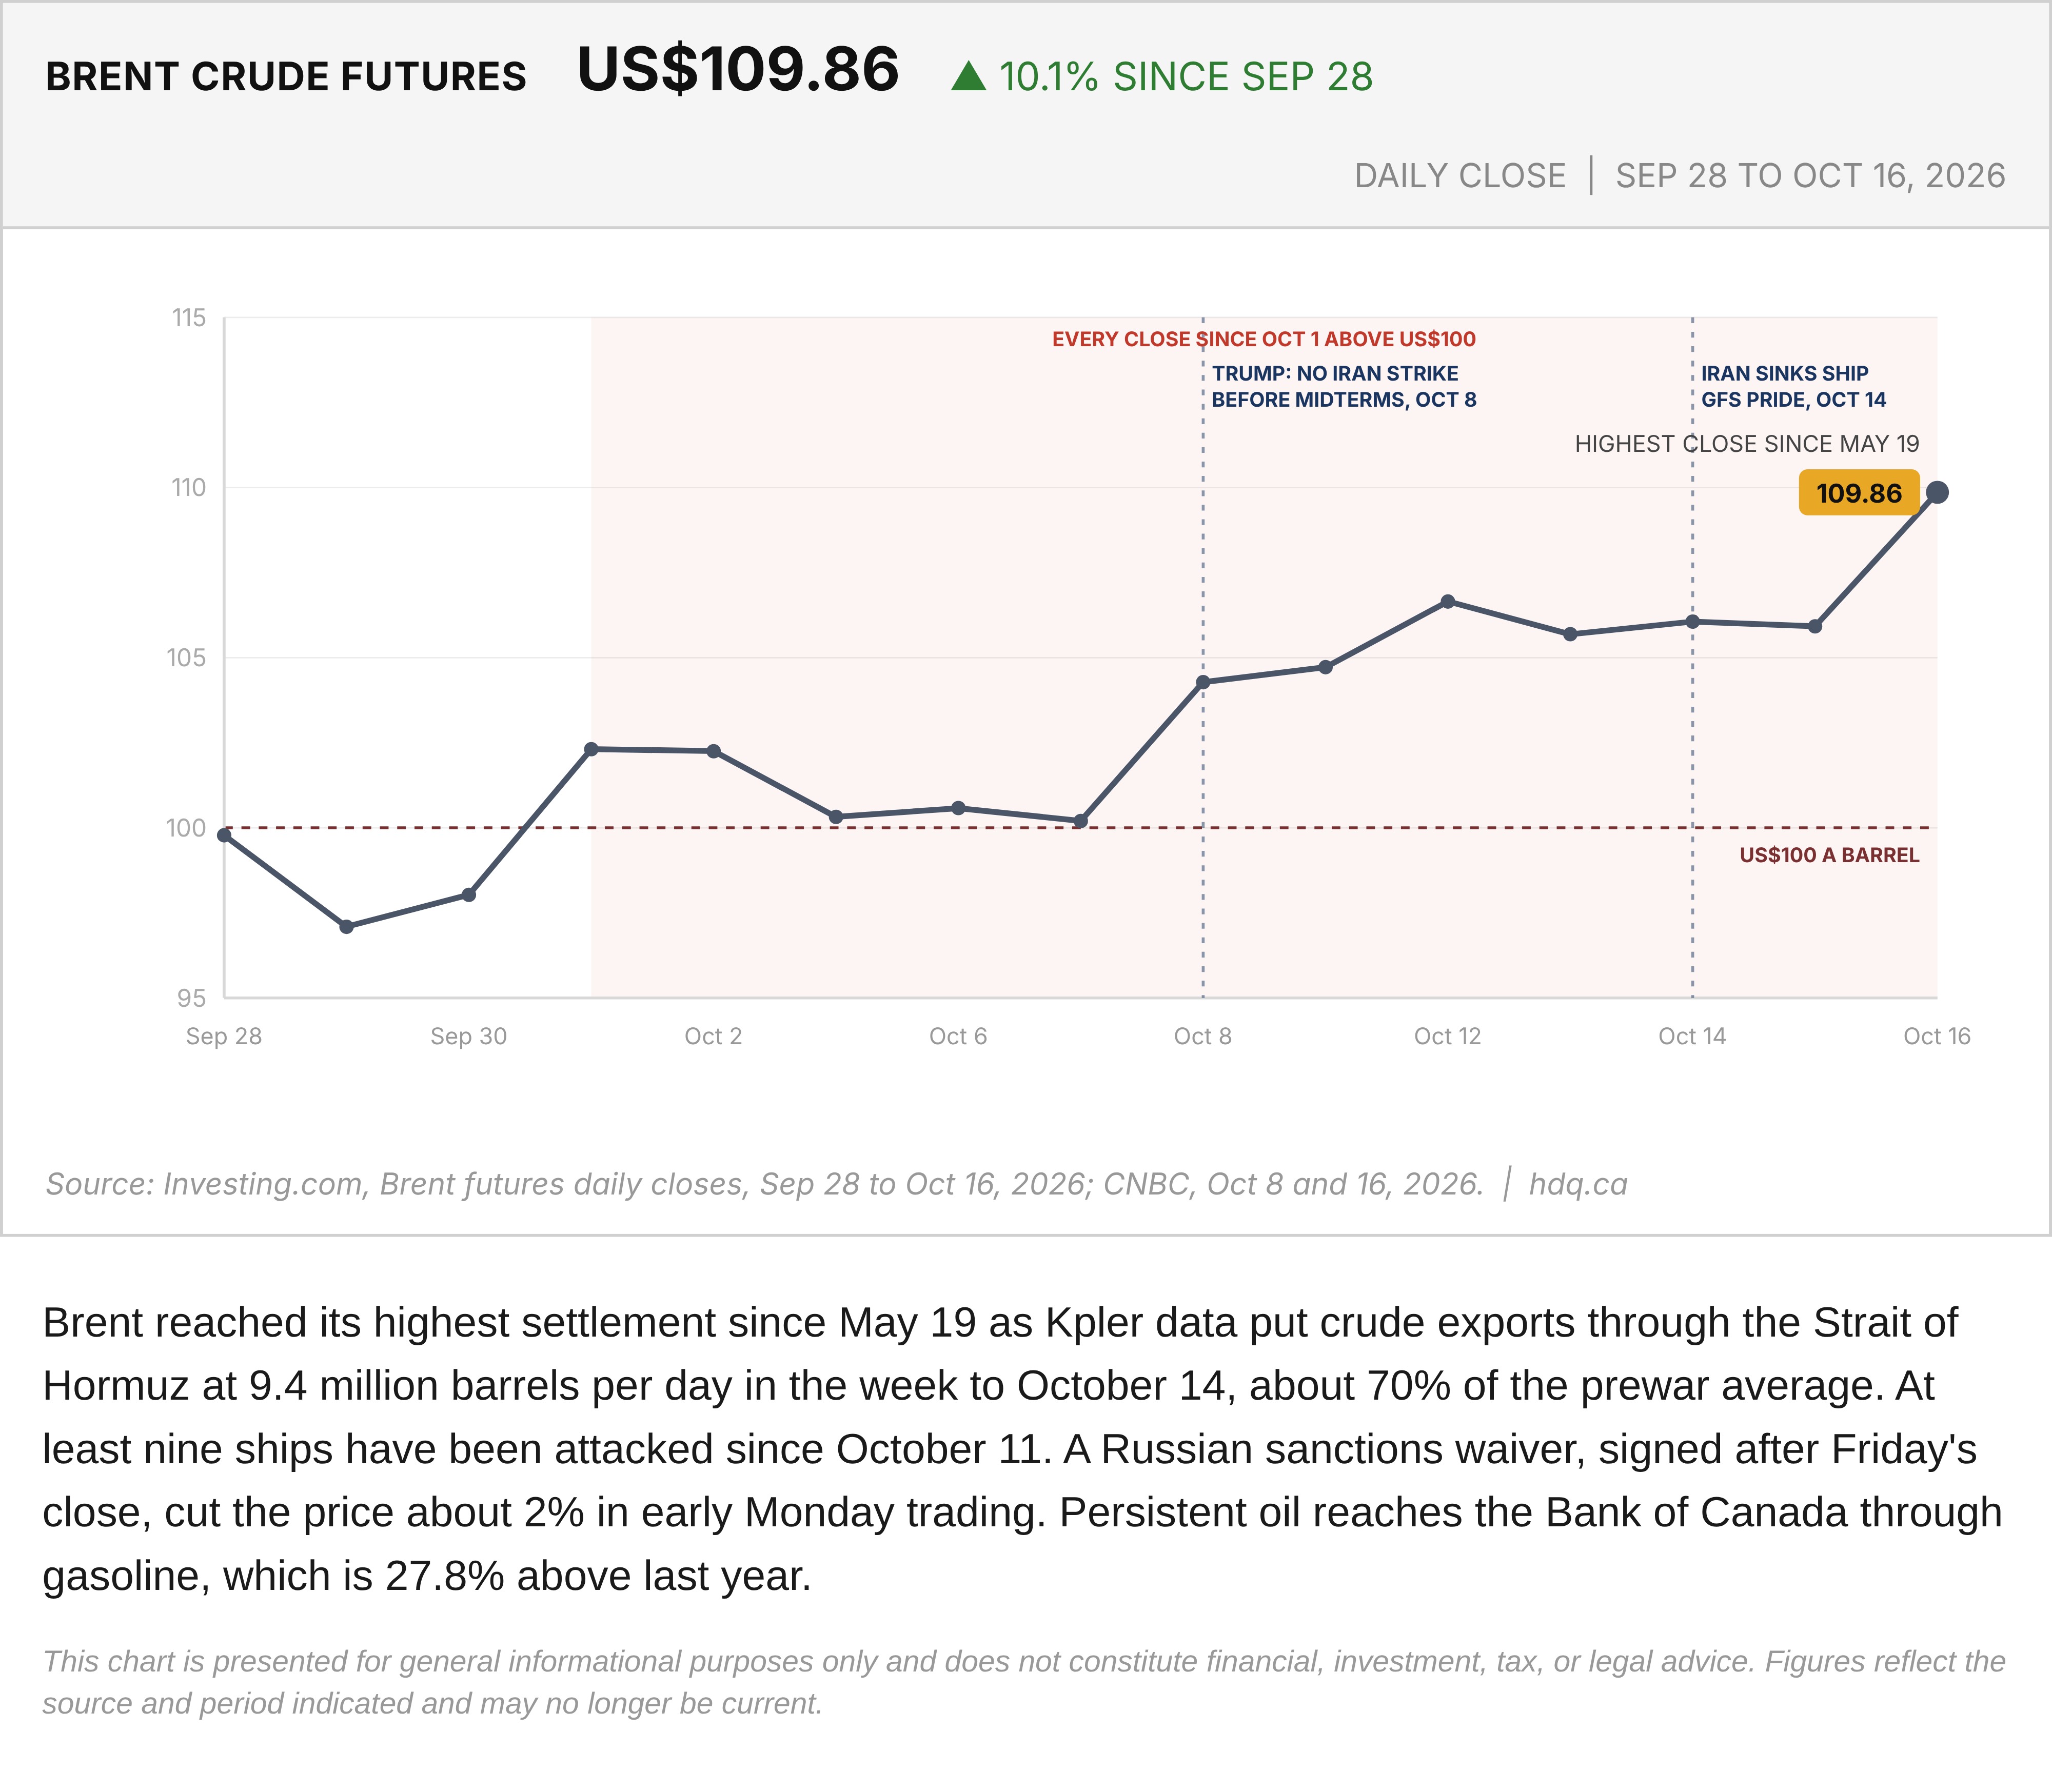
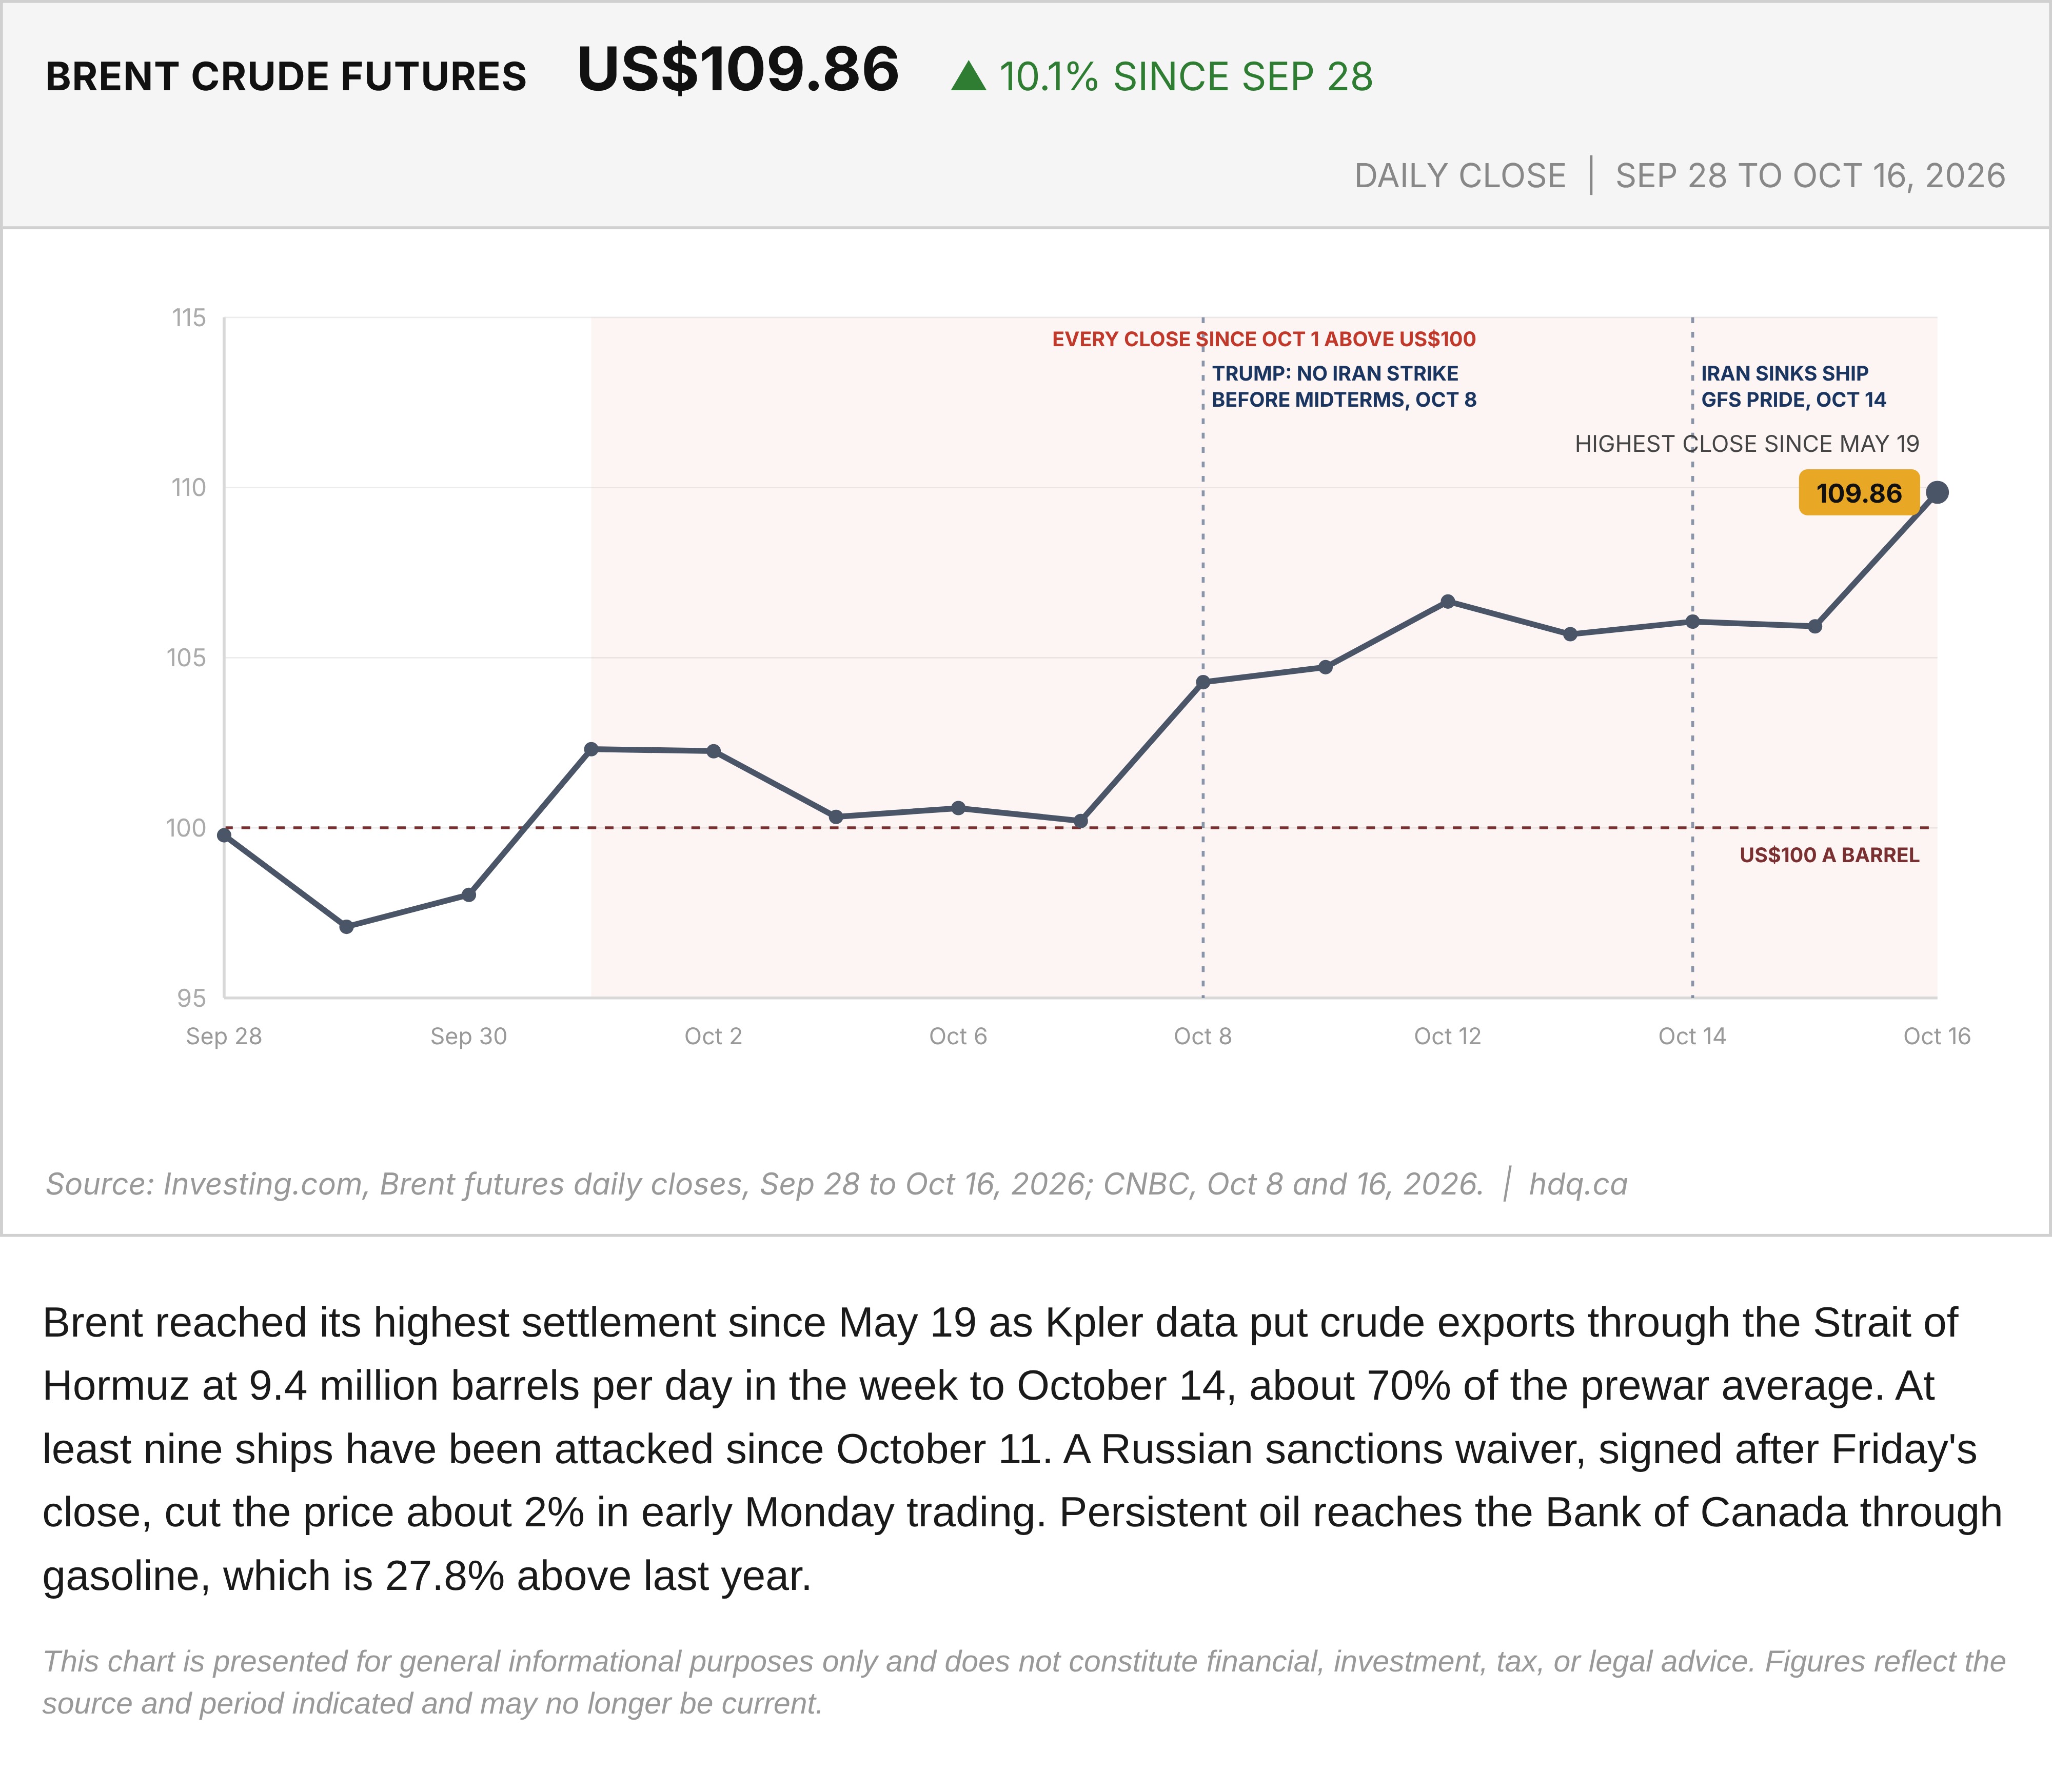
Brent reached its highest settlement since May 19 as Kpler data put crude exports through the Strait of Hormuz at 9.4 million barrels per day in the week to October 14, about 70% of the prewar average. At least nine ships have been attacked since October 11. A Russian sanctions waiver, signed after Friday's close, cut the price about 2% in early Monday trading. Persistent oil reaches the Bank of Canada through gasoline, which is 27.8% above last year.
This chart is presented for general informational purposes only and does not constitute financial, investment, tax, or legal advice. Figures reflect the source and period indicated and may no longer be current.
Related charts
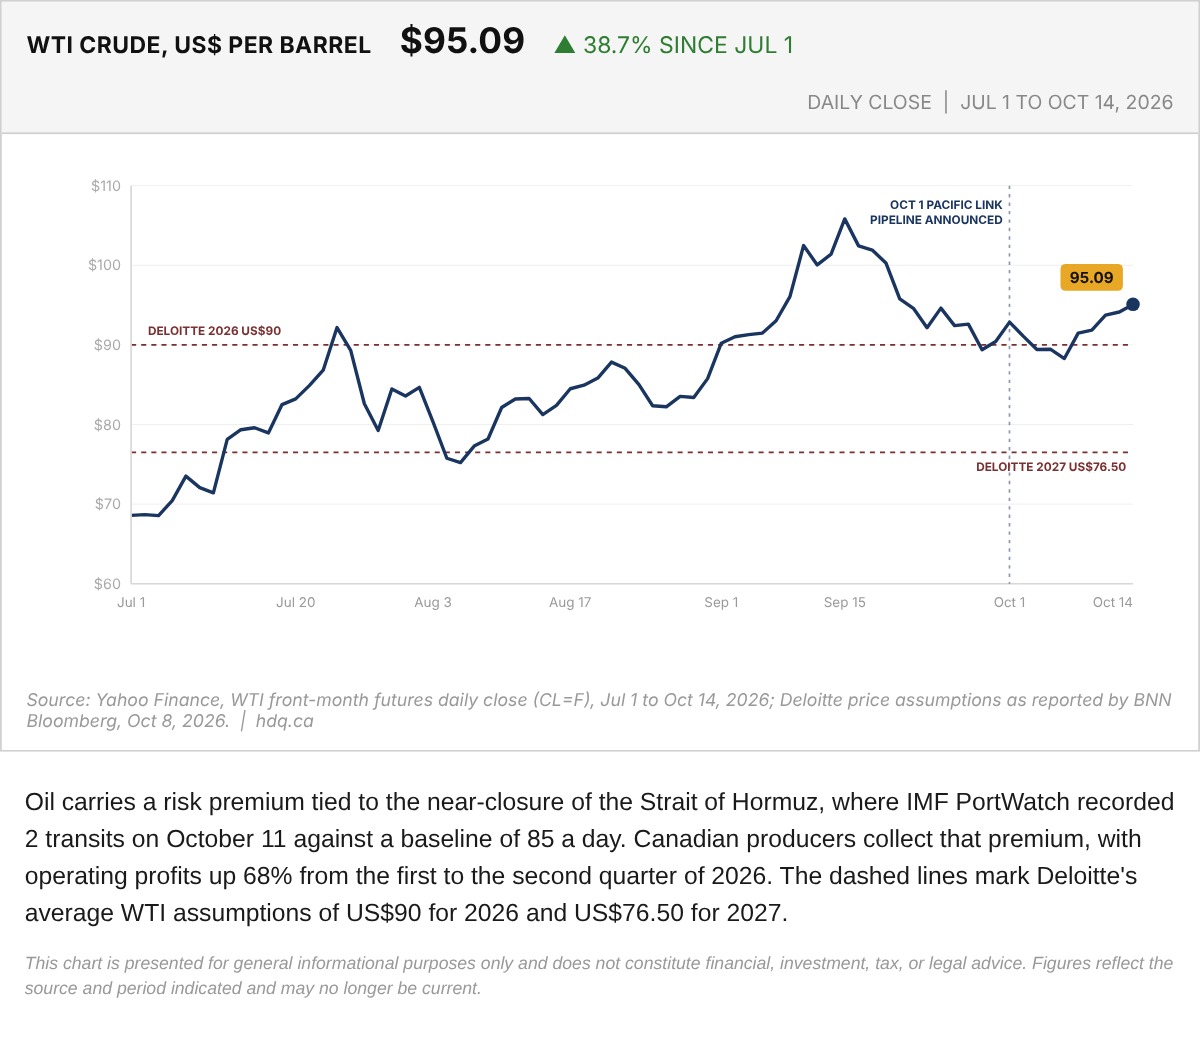
Oil carries a risk premium tied to the near-closure of the Strait of Hormuz, where IMF PortWatch recorded 2 transits on October 11 against a baseline of 85 a day.
WTI Crude Oil Price, July 1 to October 14, 2026
October 14, 2026
View chart & download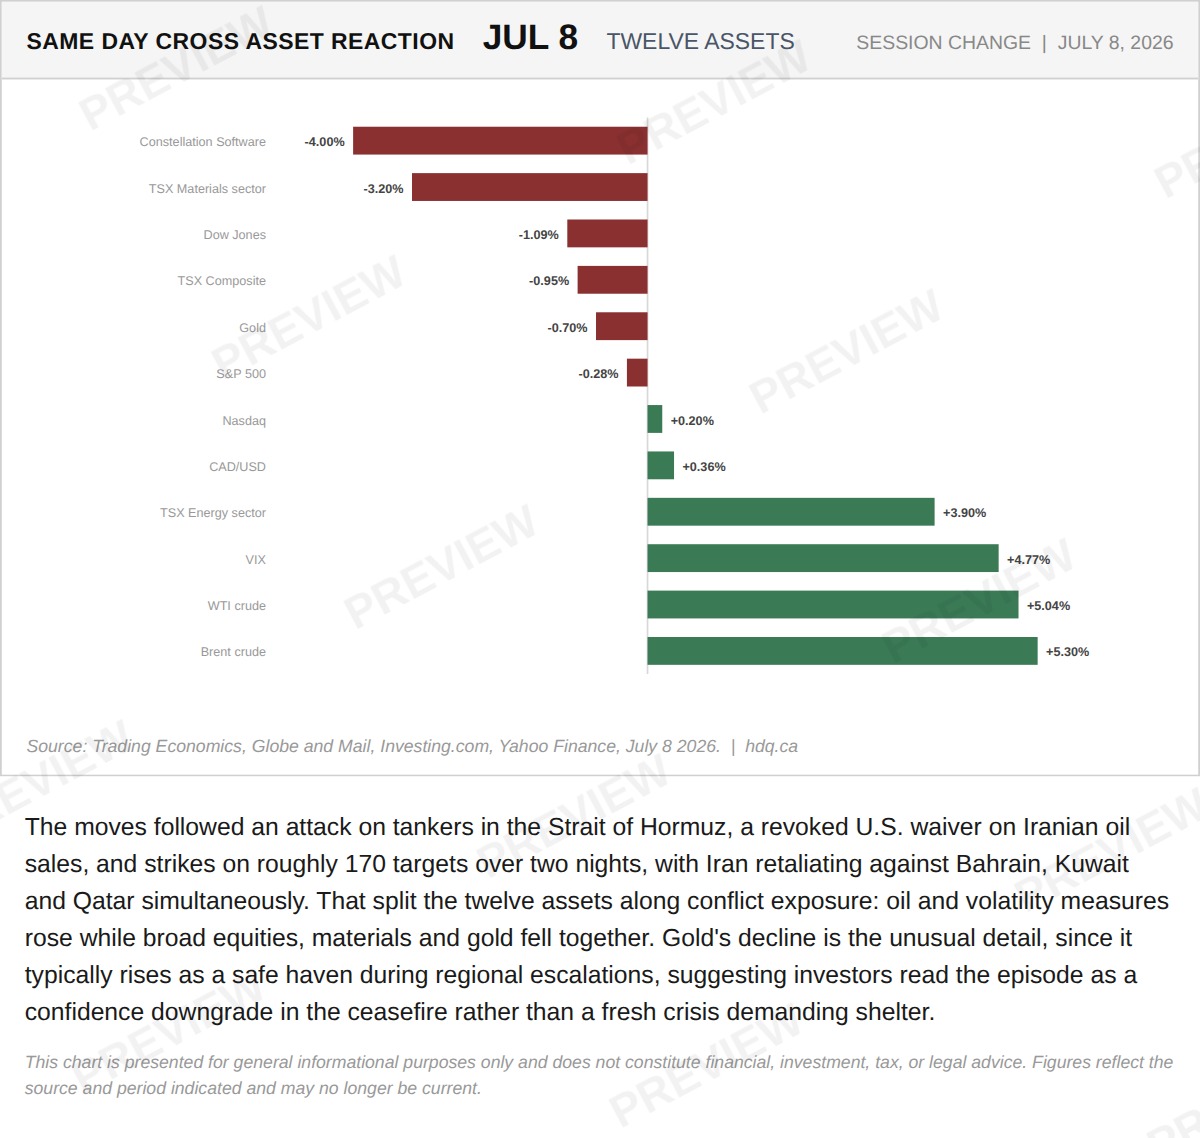
The moves followed an attack on tankers in the Strait of Hormuz, a revoked U.S.
The Chain From a Tanker Attack in Hormuz to a Four Percent Day for TSX Energy Stocks
July 9, 2026
View chart & download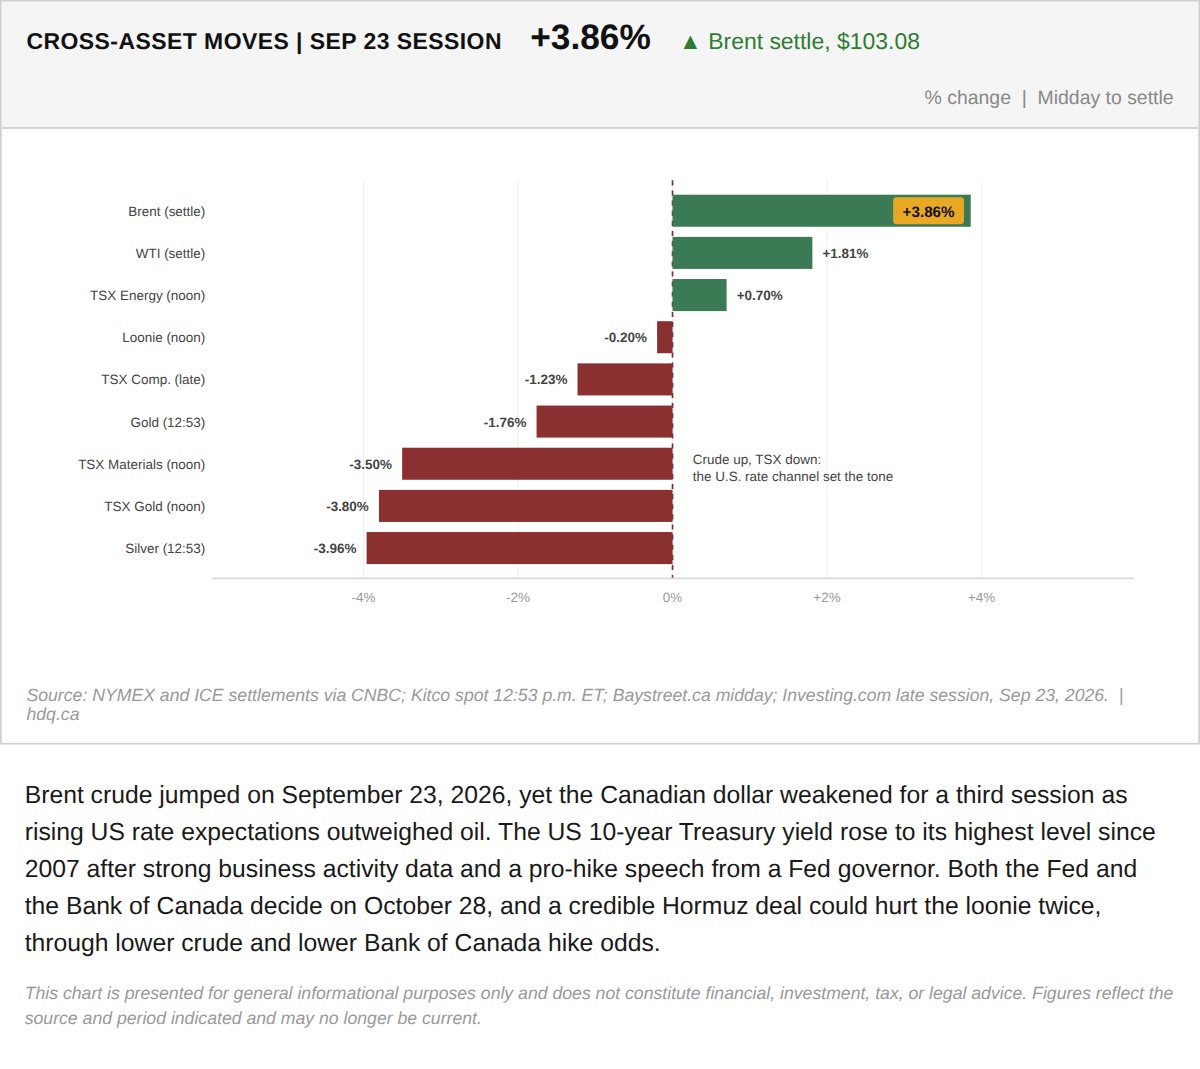
Brent crude jumped on September 23, 2026, yet the Canadian dollar weakened for a third session as rising US rate expectations outweighed oil.
Brent Jumps While the Canadian Dollar and TSX Fall in the September 23 Session
September 23, 2026
View chart & download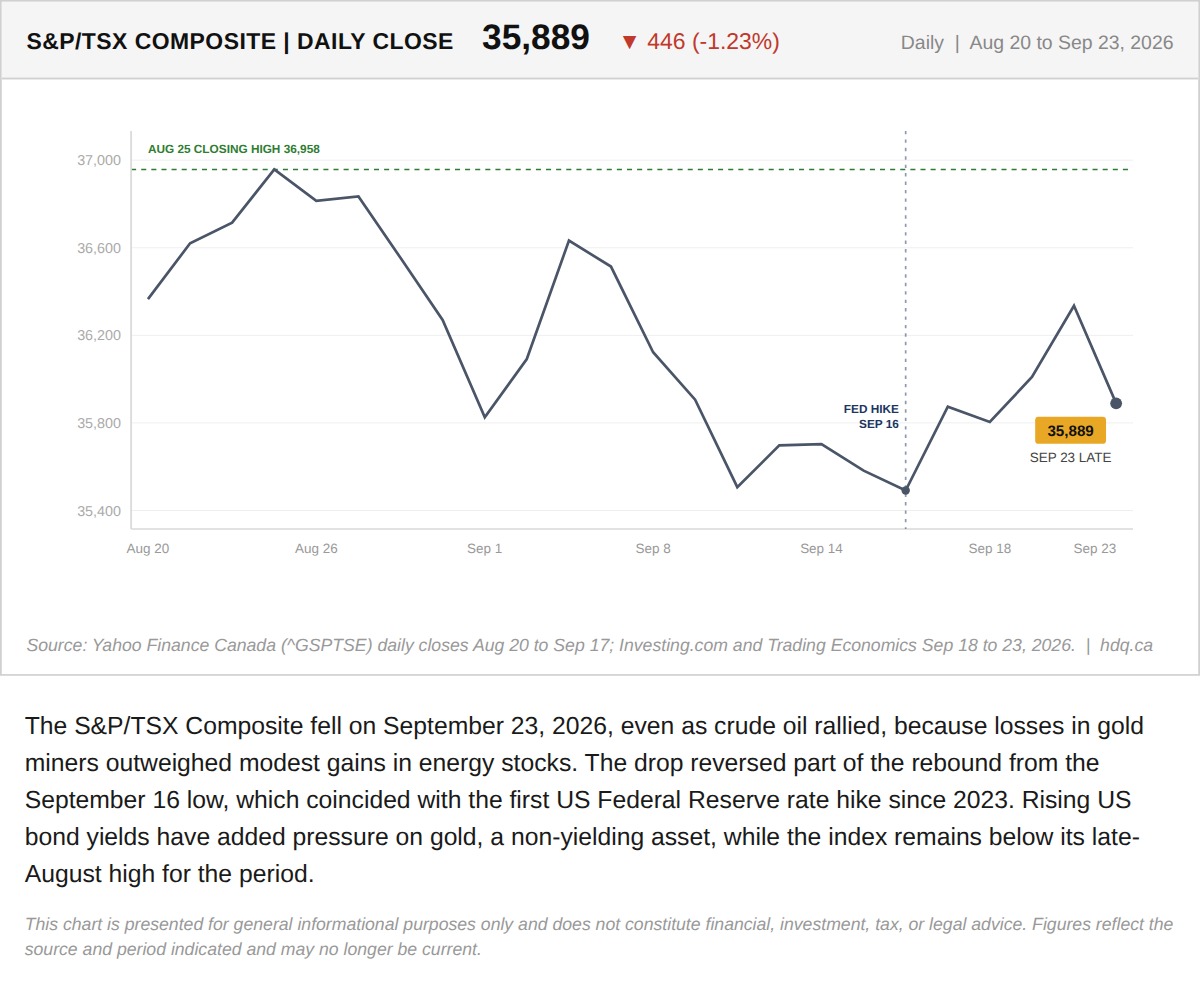
The S&P/TSX Composite fell on September 23, 2026, even as crude oil rallied, because losses in gold miners outweighed modest gains in energy stocks.
TSX Composite Falls Despite an Oil Rally as Gold Stocks Slide
September 23, 2026
View chart & download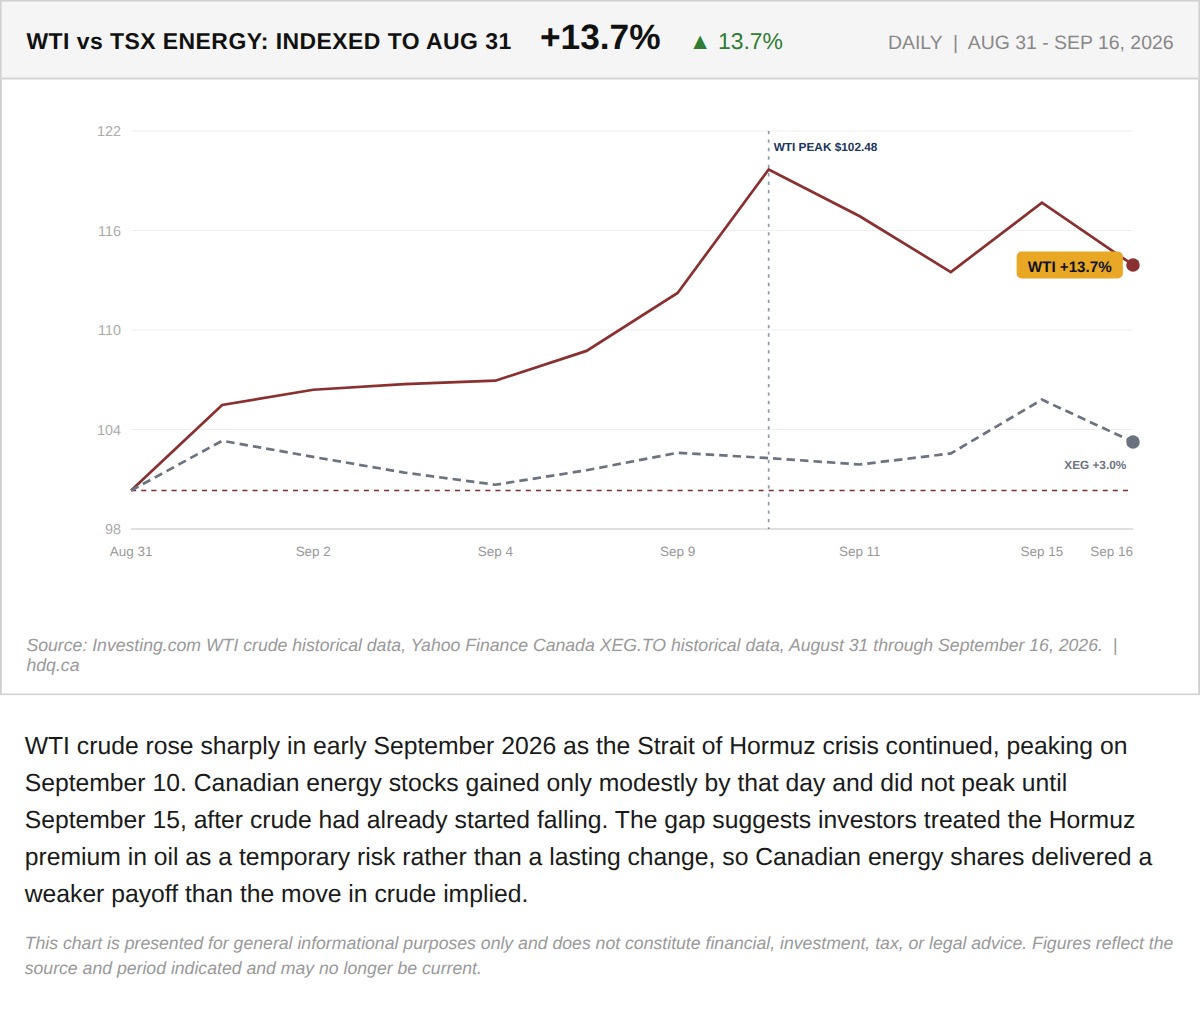
WTI crude rose sharply in early September 2026 as the Strait of Hormuz crisis continued, peaking on September 10.
The Hormuz Premium Did Not Show Up in Canadian Energy Stocks
September 22, 2026
View chart & download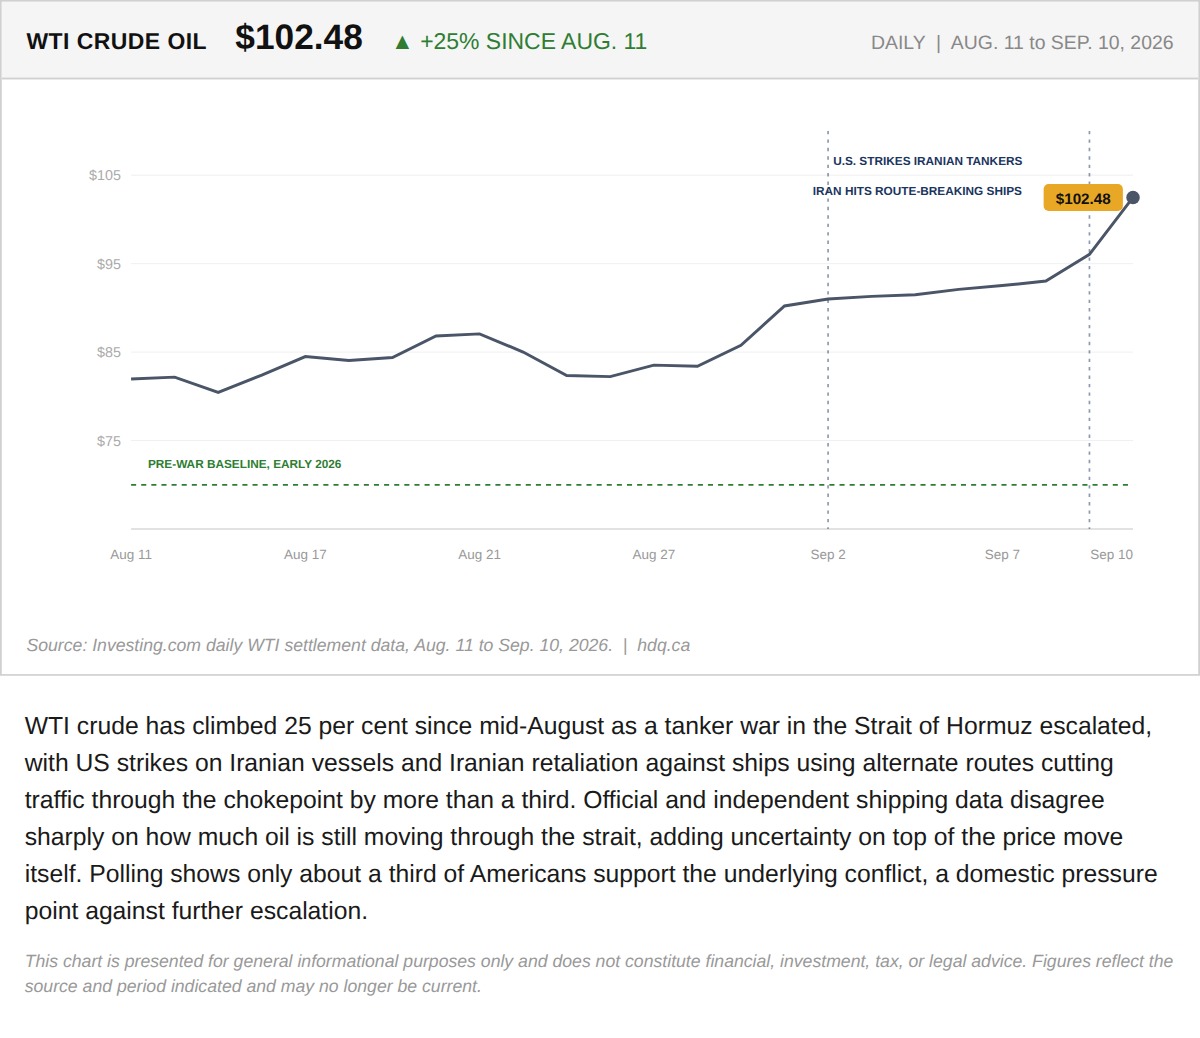
WTI crude has climbed 25 per cent since mid-August as a tanker war in the Strait of Hormuz escalated, with US strikes on Iranian vessels…
The Tanker War in the Strait of Hormuz Just Repriced Every Canadian Energy Position
September 11, 2026
View chart & download