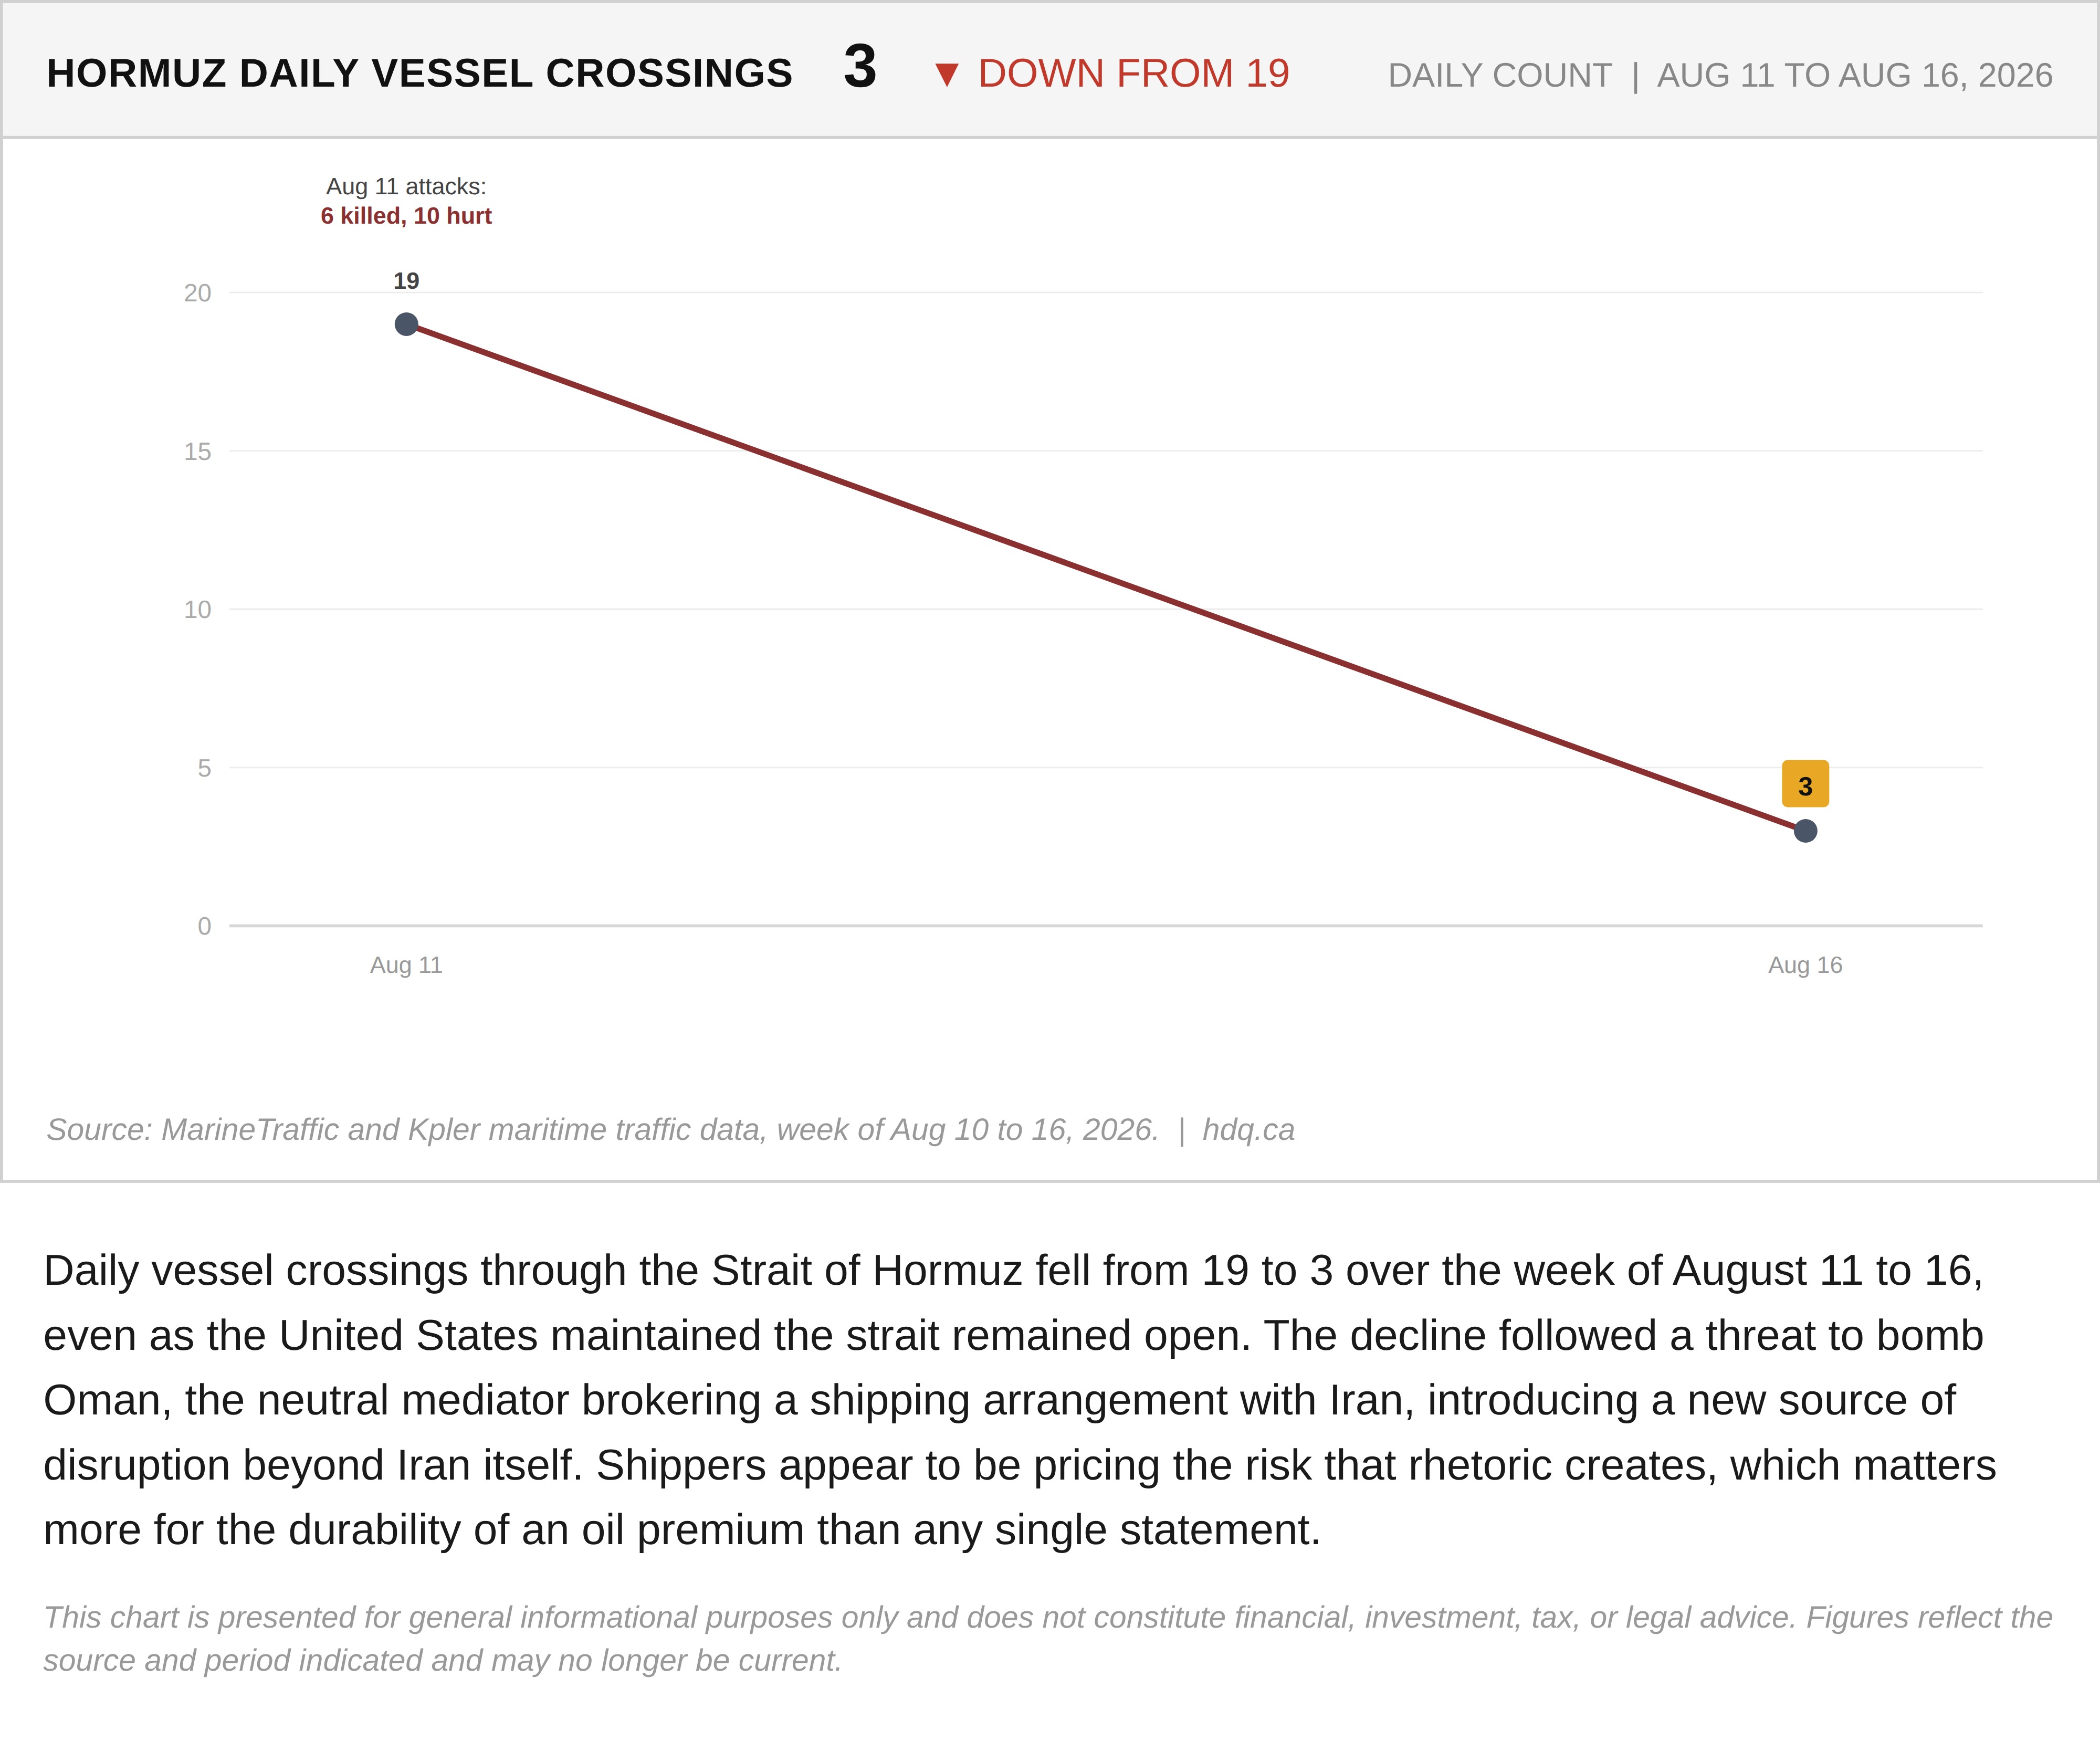
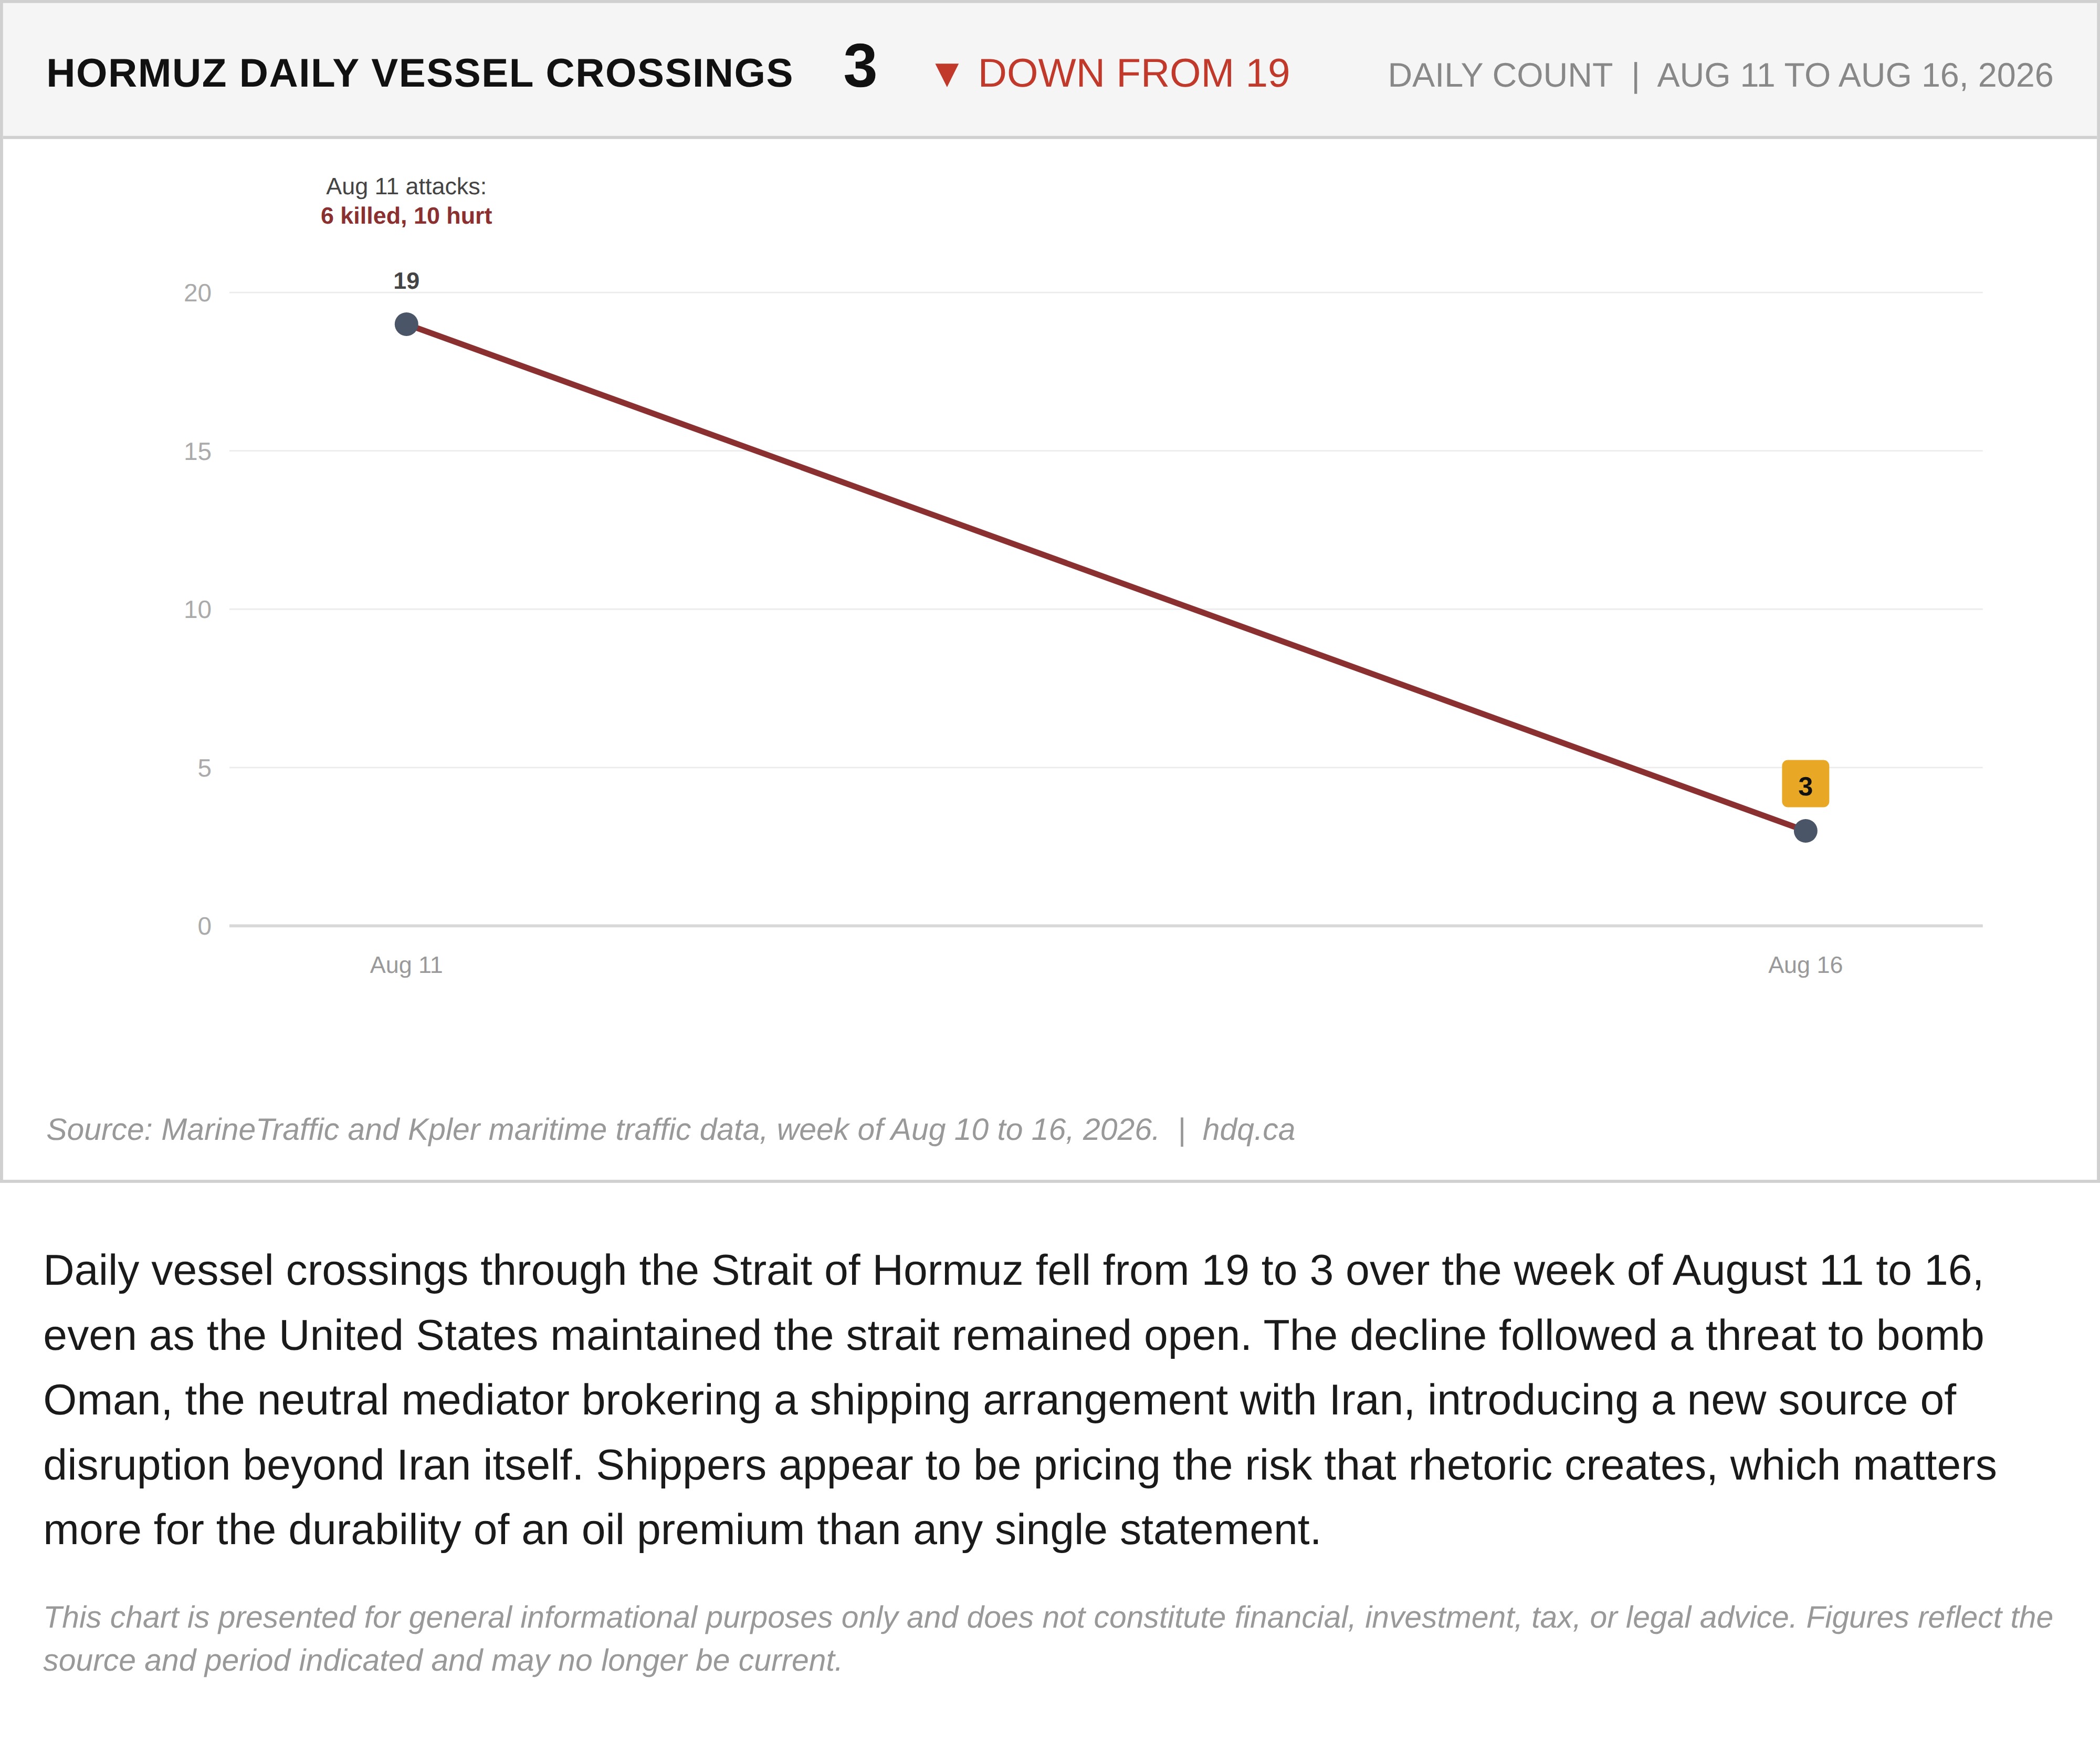
Daily vessel crossings through the Strait of Hormuz fell from 19 to 3 over the week of August 11 to 16, even as the United States maintained the strait remained open. The decline followed a threat to bomb Oman, the neutral mediator brokering a shipping arrangement with Iran, introducing a new source of disruption beyond Iran itself. Shippers appear to be pricing the risk that rhetoric creates, which matters more for the durability of an oil premium than any single statement.
This chart is presented for general informational purposes only and does not constitute financial, investment, tax, or legal advice. Figures reflect the source and period indicated and may no longer be current.
Related charts
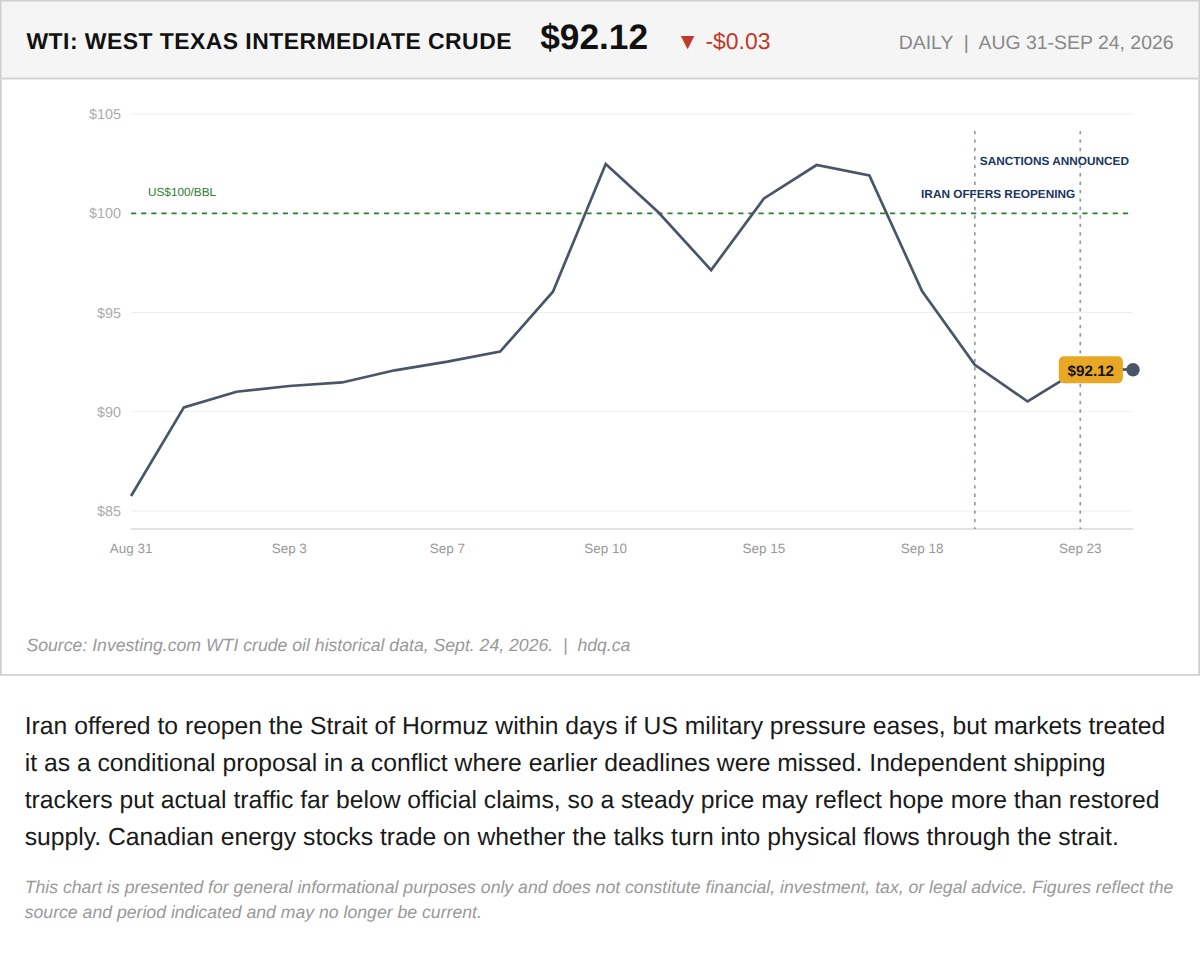
Iran offered to reopen the Strait of Hormuz within days if US military pressure eases, but markets treated it as a conditional proposal in…
WTI Crude Holds Near $92 on Hormuz Reopening Offer
September 24, 2026
View chart & download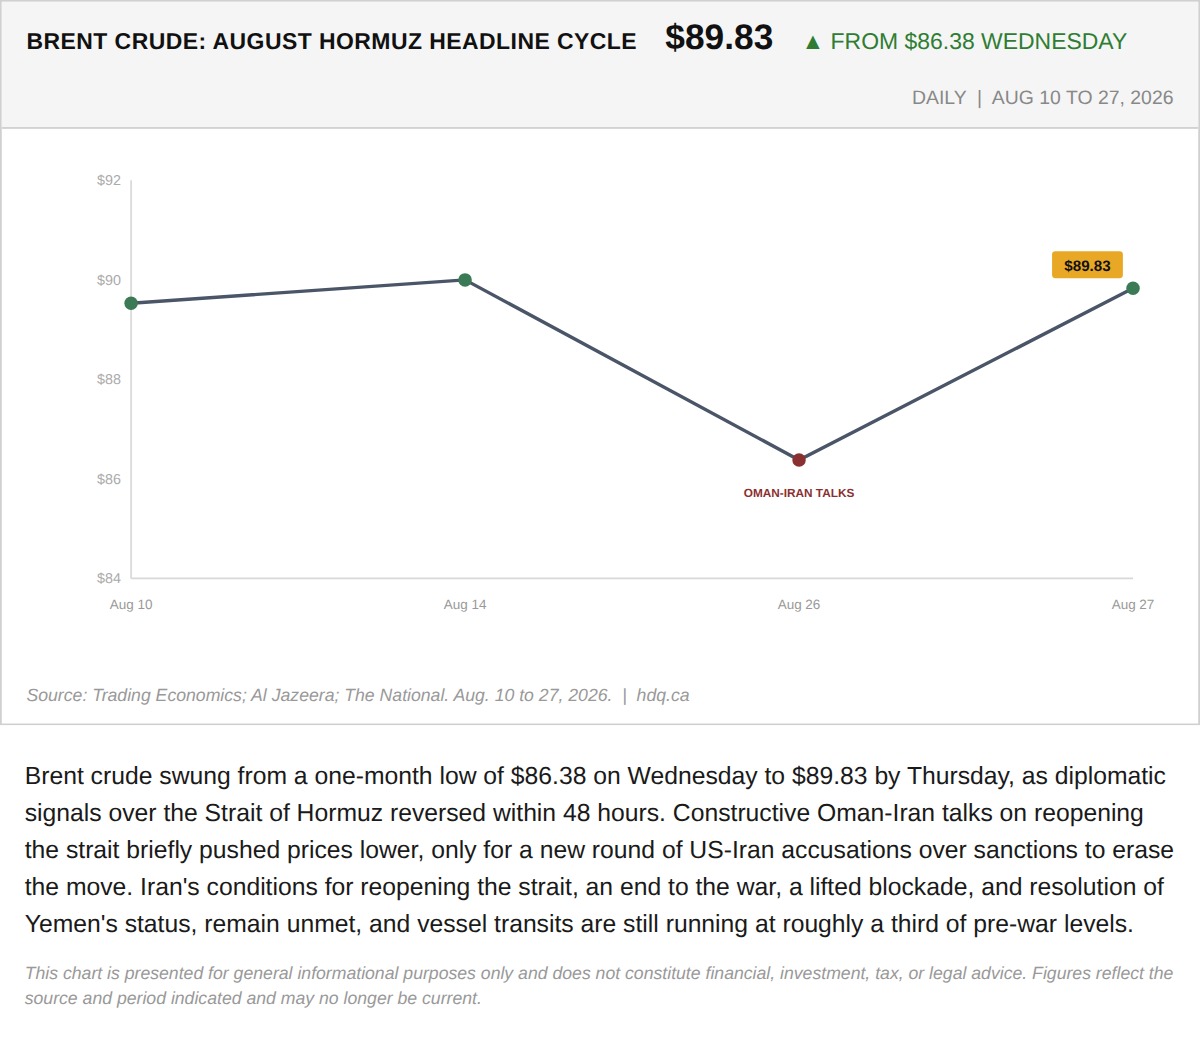
Brent crude swung from a one-month low of $86.38 on Wednesday to $89.83 by Thursday, as diplomatic signals over the Strait of Hormuz reversed within 48 hours.
Oil's 48 Hour Reversal Shows Why Hormuz Remains a Tail Risk, Not a Resolved Story
August 28, 2026
View chart & download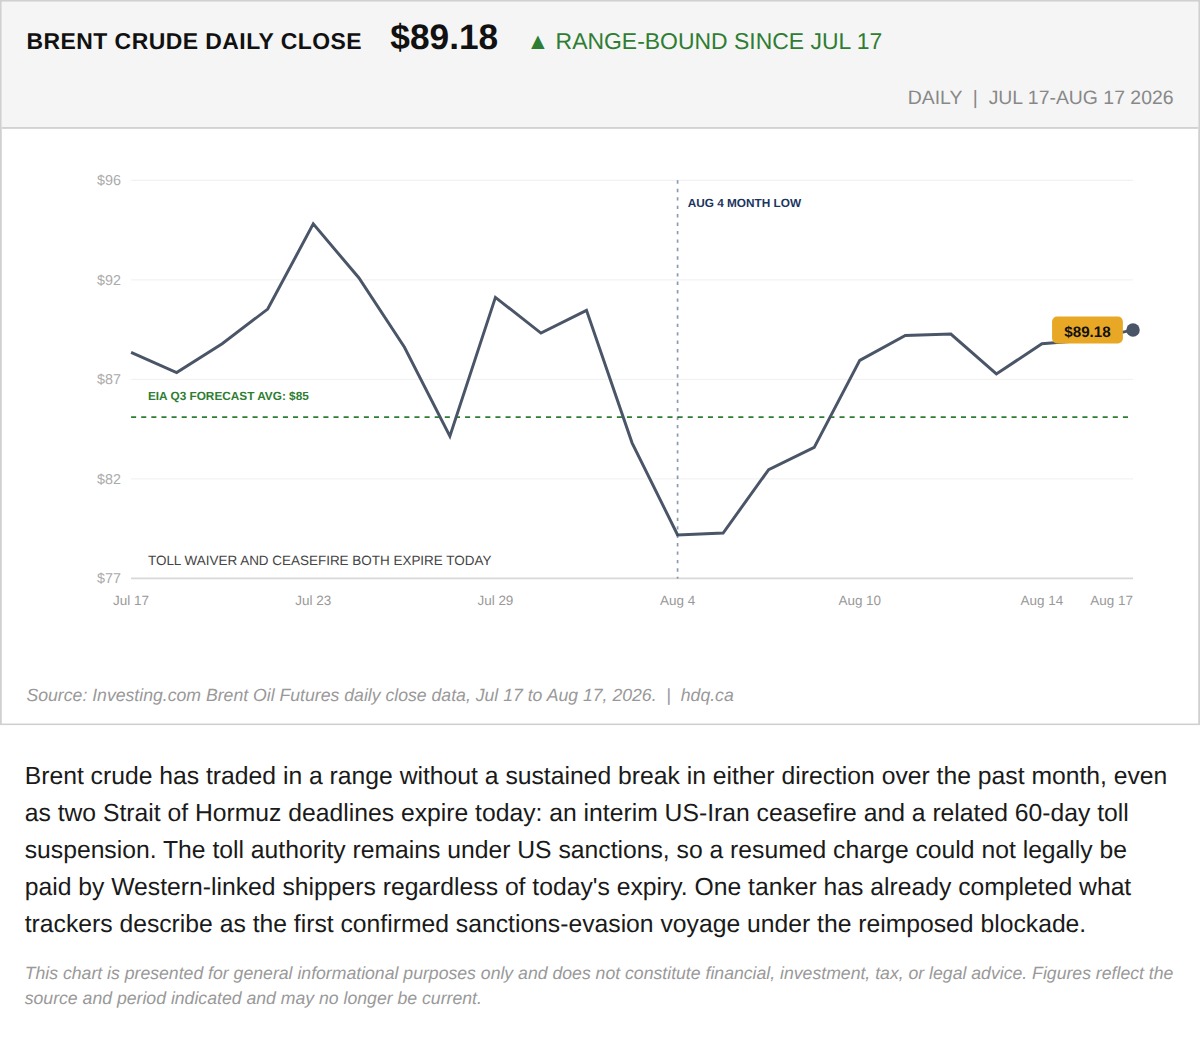
Brent crude has traded in a range without a sustained break in either direction over the past month, even as two Strait of Hormuz deadlines…
Two Deadlines Expire in the Strait of Hormuz Today. The Market Has Been Pricing Around Both.
August 17, 2026
View chart & download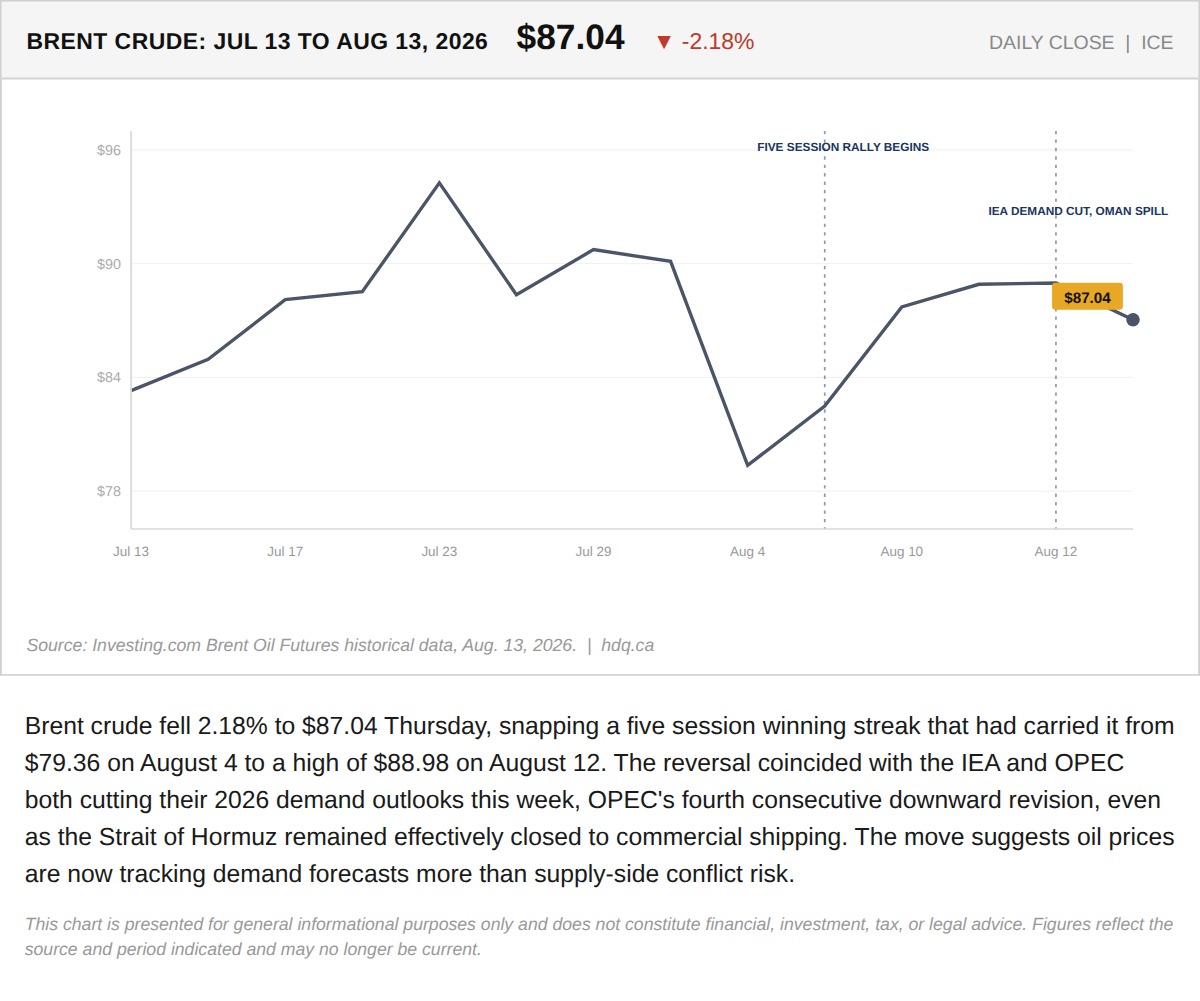
Brent crude fell 2.18% to $87.04 Thursday, snapping a five session winning streak that had carried it from $79.36 on August 4 to a high of $88.98 on August 12.
Oil Fell This Week. The Hormuz Rhetoric Didn't.
August 14, 2026
View chart & download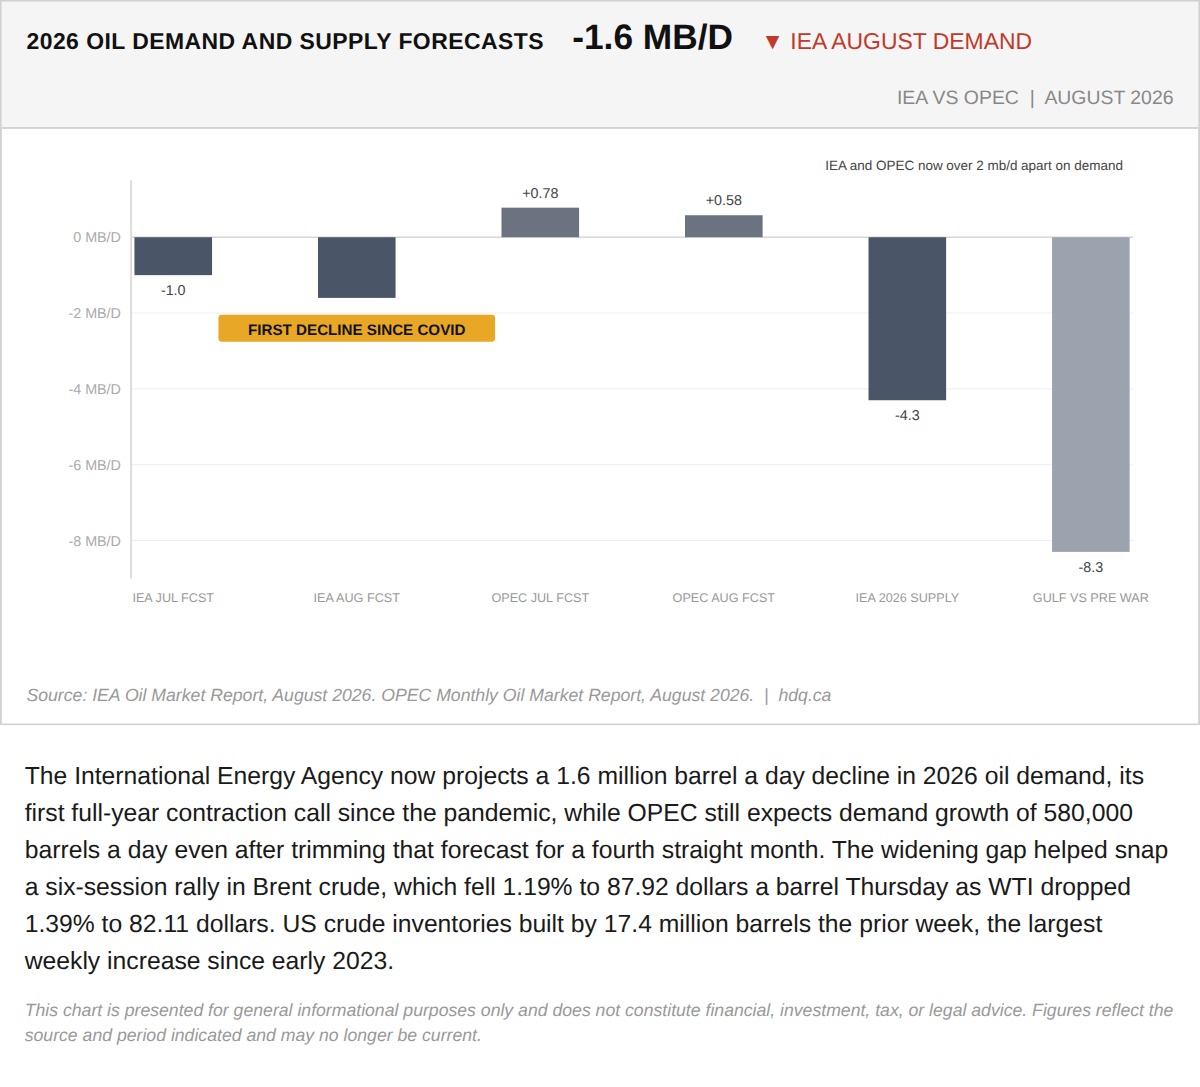
The International Energy Agency now projects a 1.6 million barrel a day decline in 2026 oil demand, its first full-year contraction call…
The IEA and OPEC Are Now Two Million Barrels Apart on Oil Demand
August 13, 2026
View chart & download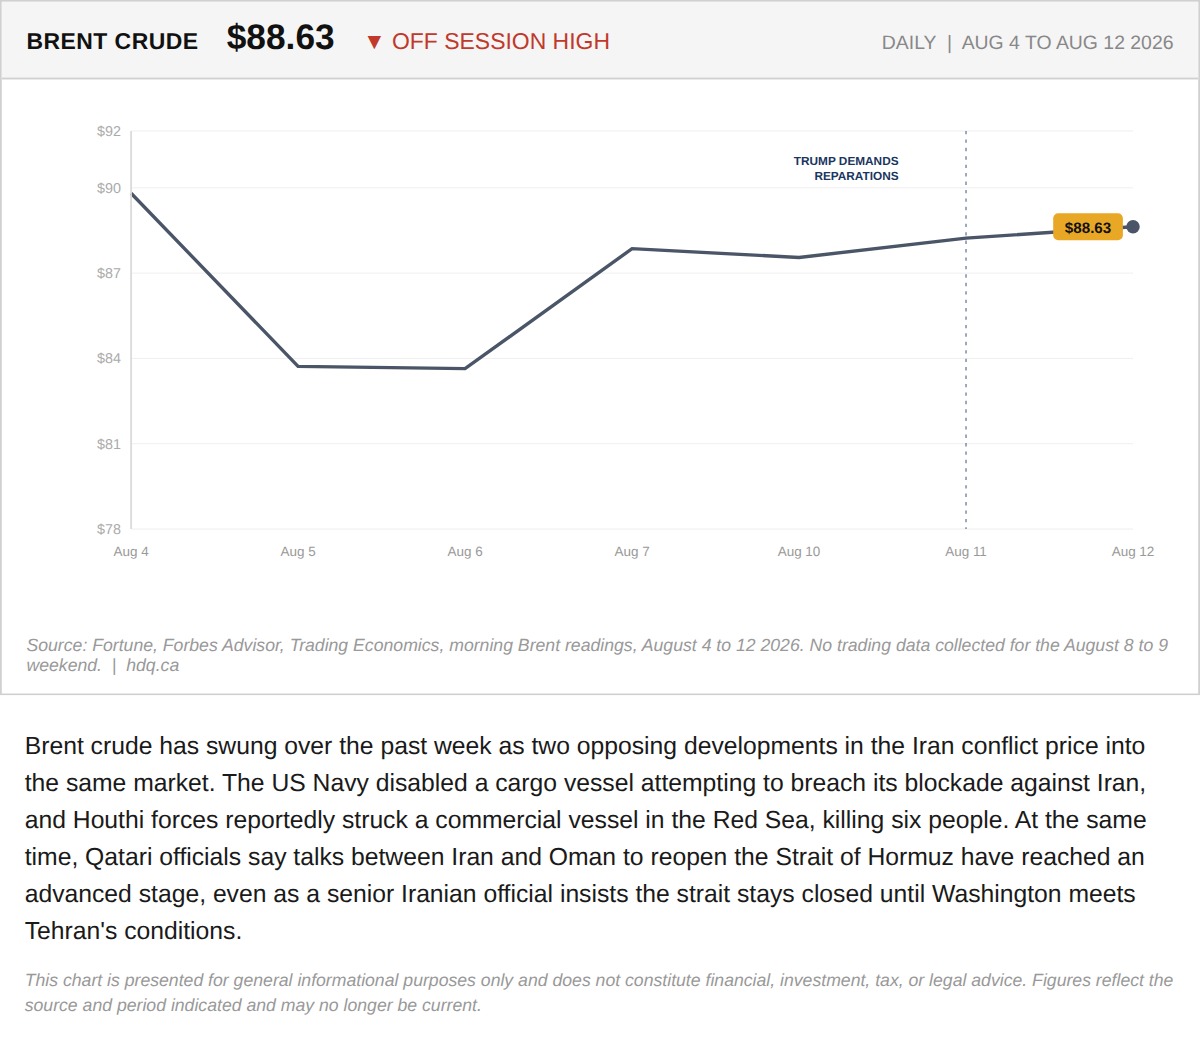
Brent crude has swung over the past week as two opposing developments in the Iran conflict price into the same market.
The US Navy Disabled a Ship Enforcing the Iran Blockade. Iran and Oman Are Still Talking.
August 12, 2026
View chart & download