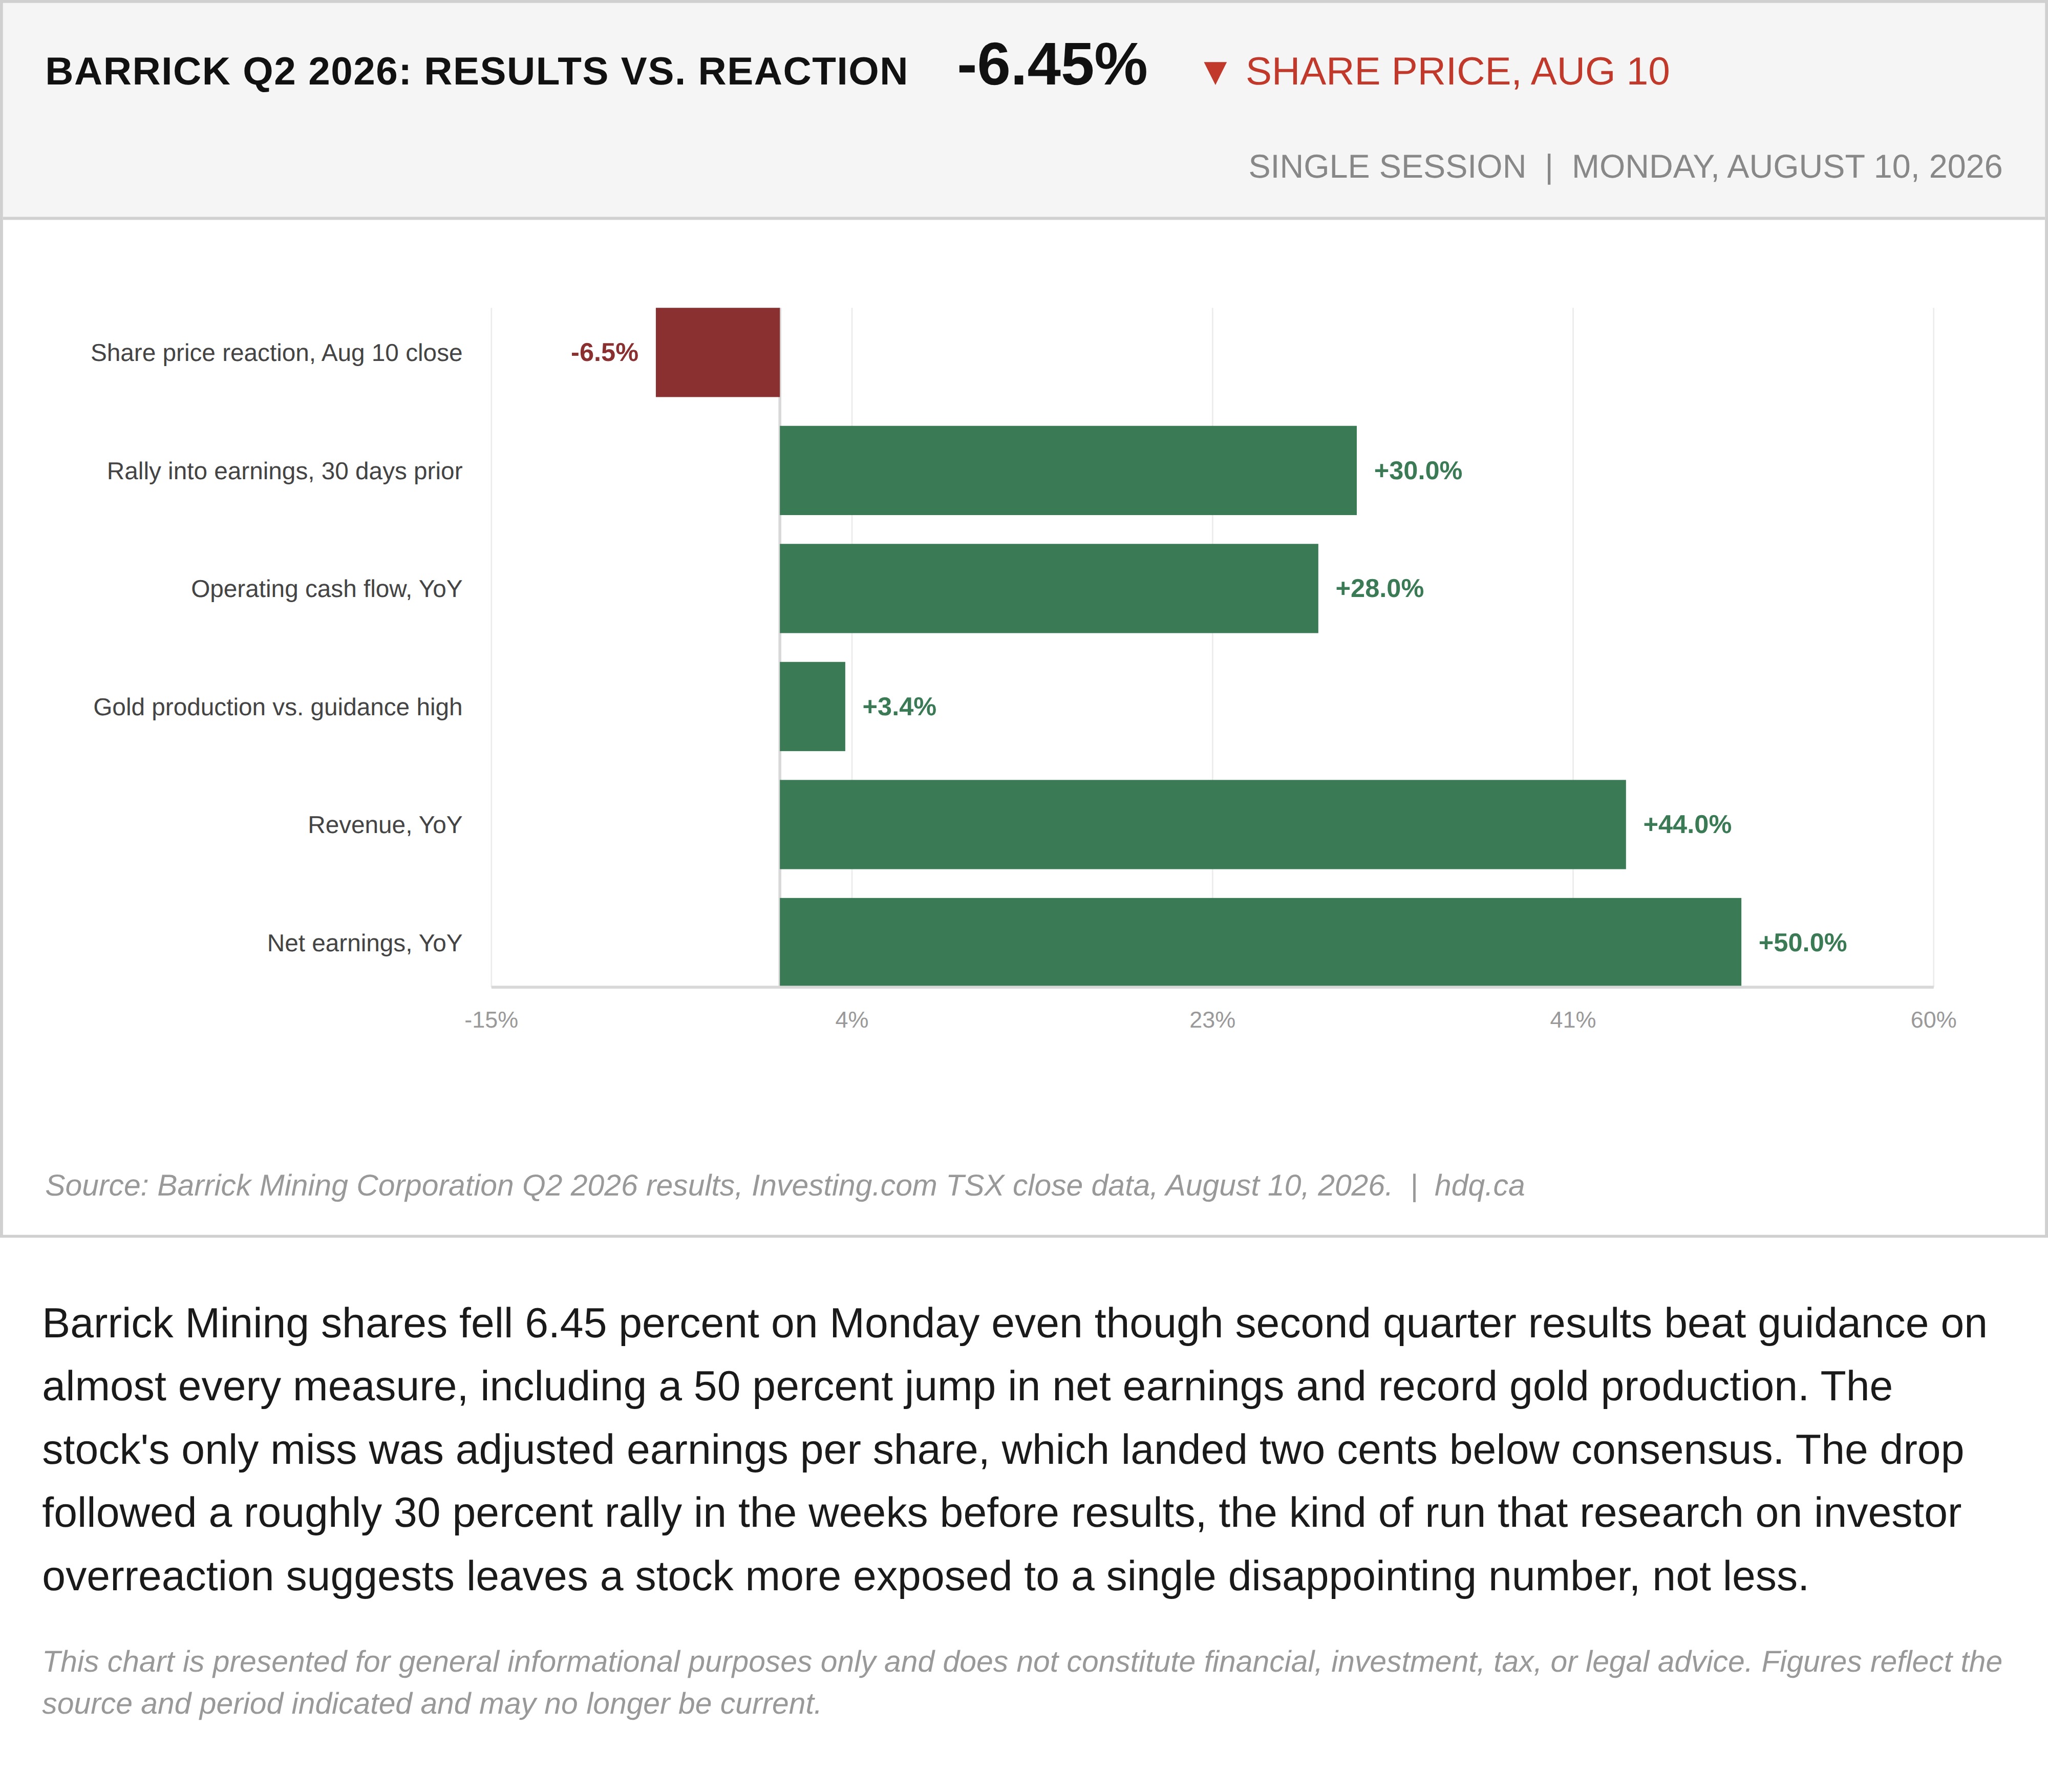
Barrick Mining shares fell 6.45 percent on Monday even though second quarter results beat guidance on almost every measure, including a 50 percent jump in net earnings and record gold production. The stock's only miss was adjusted earnings per share, which landed two cents below consensus. The drop followed a roughly 30 percent rally in the weeks before results, the kind of run that research on investor overreaction suggests leaves a stock more exposed to a single disappointing number, not less.
This chart is presented for general informational purposes only and does not constitute financial, investment, tax, or legal advice. Figures reflect the source and period indicated and may no longer be current.
Related charts
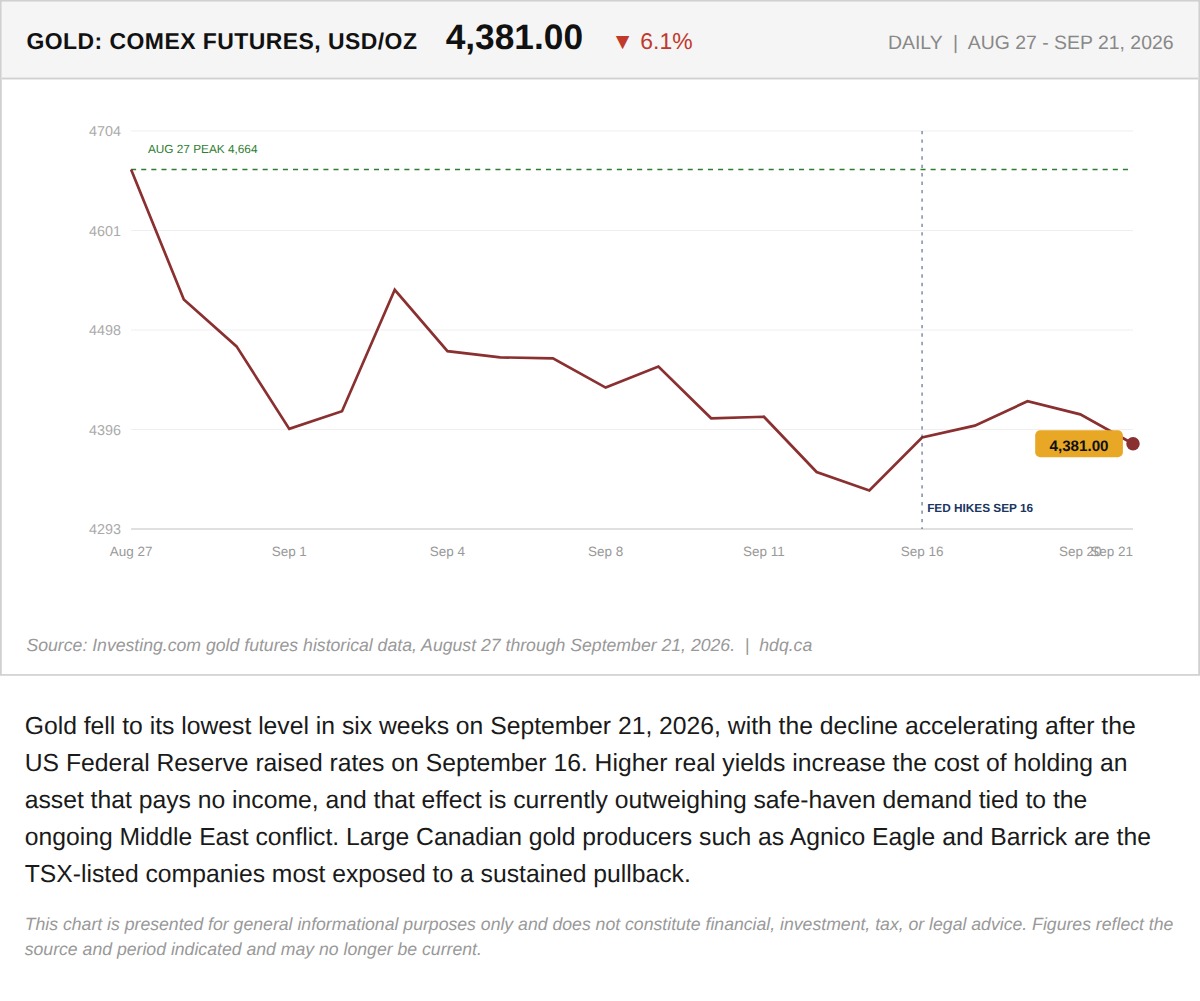
Gold fell to its lowest level in six weeks on September 21, 2026, with the decline accelerating after the US Federal Reserve raised rates on September 16.
Gold Falls to a Six-Week Low as the Fed Hike Outweighs the War Premium
September 22, 2026
View chart & download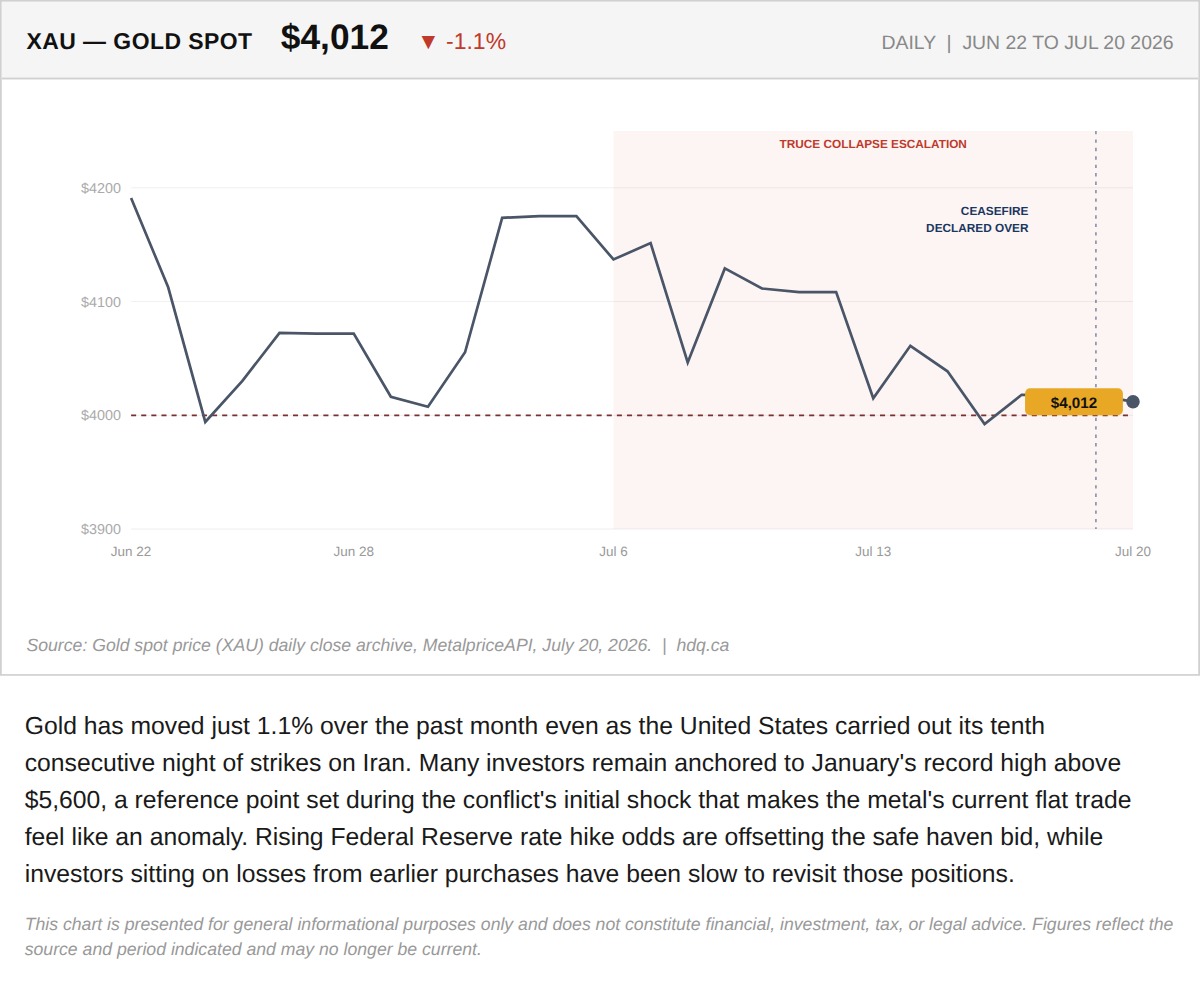
Gold has moved just 1.1% over the past month even as the United States carried out its tenth consecutive night of strikes on Iran.
Gold Has Not Moved in a Month, Even as the Iran War Intensifies
July 21, 2026
View chart & download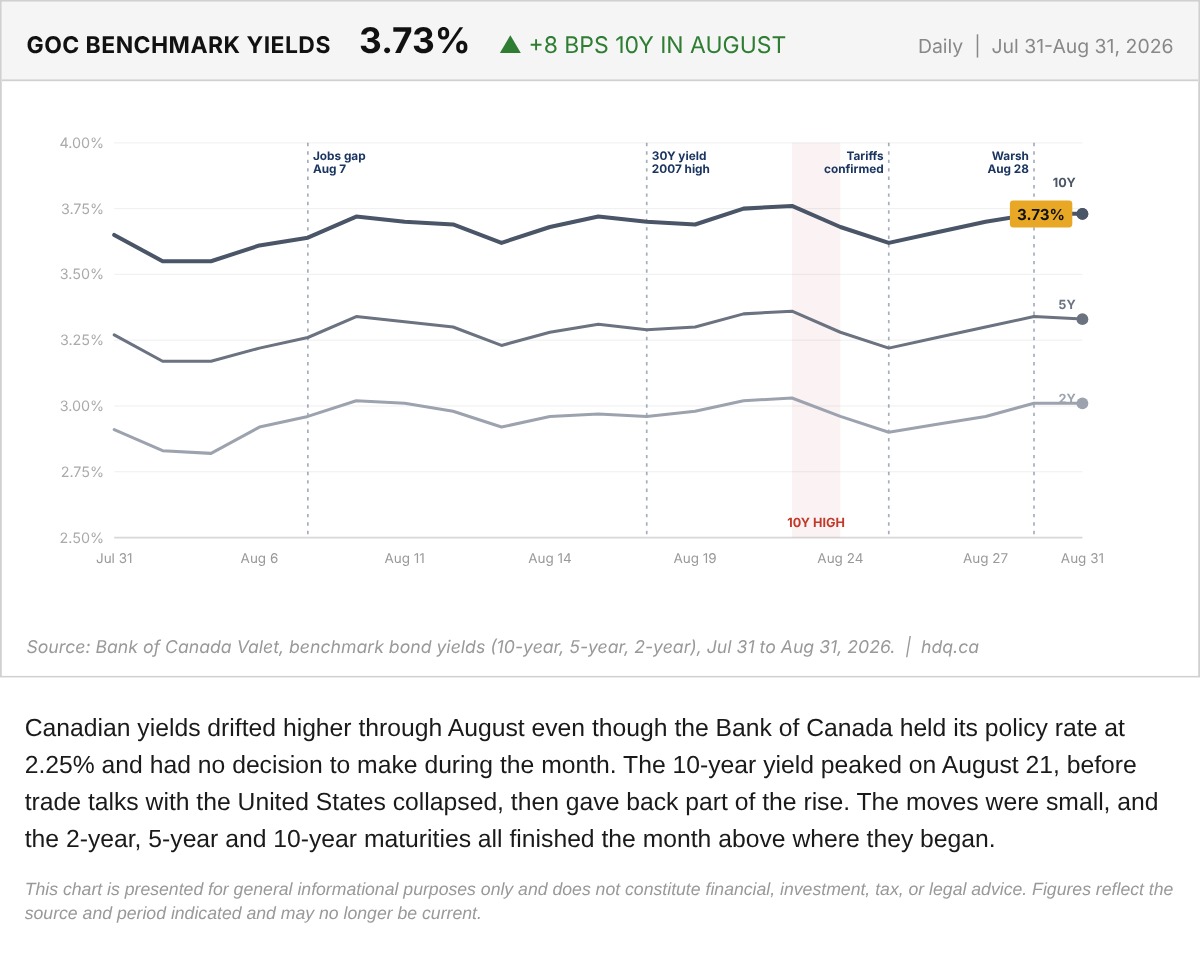
Canadian yields drifted higher through August even though the Bank of Canada held its policy rate at 2.25% and had no decision to make during the month.
Government of Canada Benchmark Yields, August 2026
August 31, 2026
View chart & download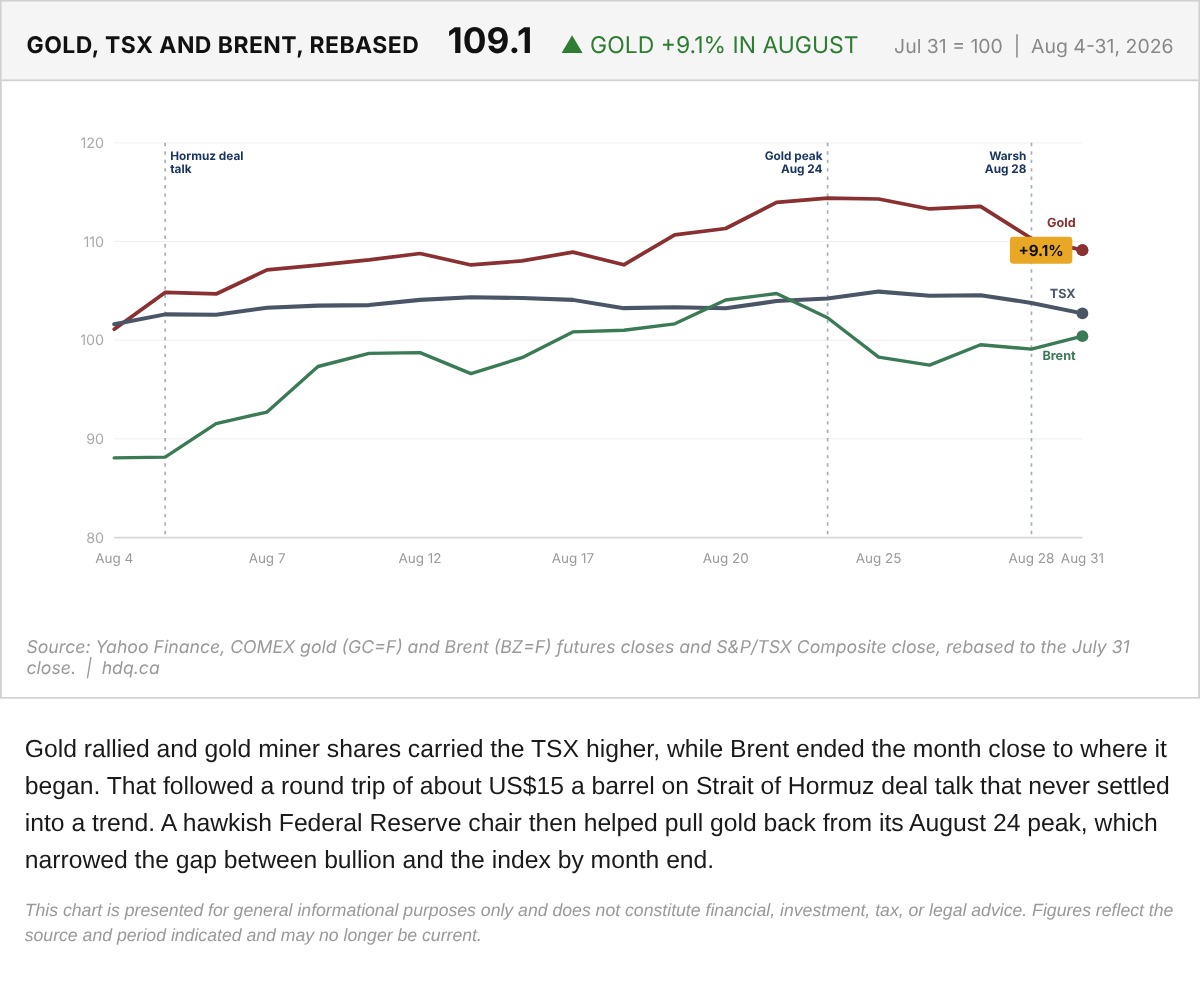
Gold rallied and gold miner shares carried the TSX higher, while Brent ended the month close to where it began.
Gold, TSX and Brent Rebased to the July 31 Close
August 31, 2026
View chart & download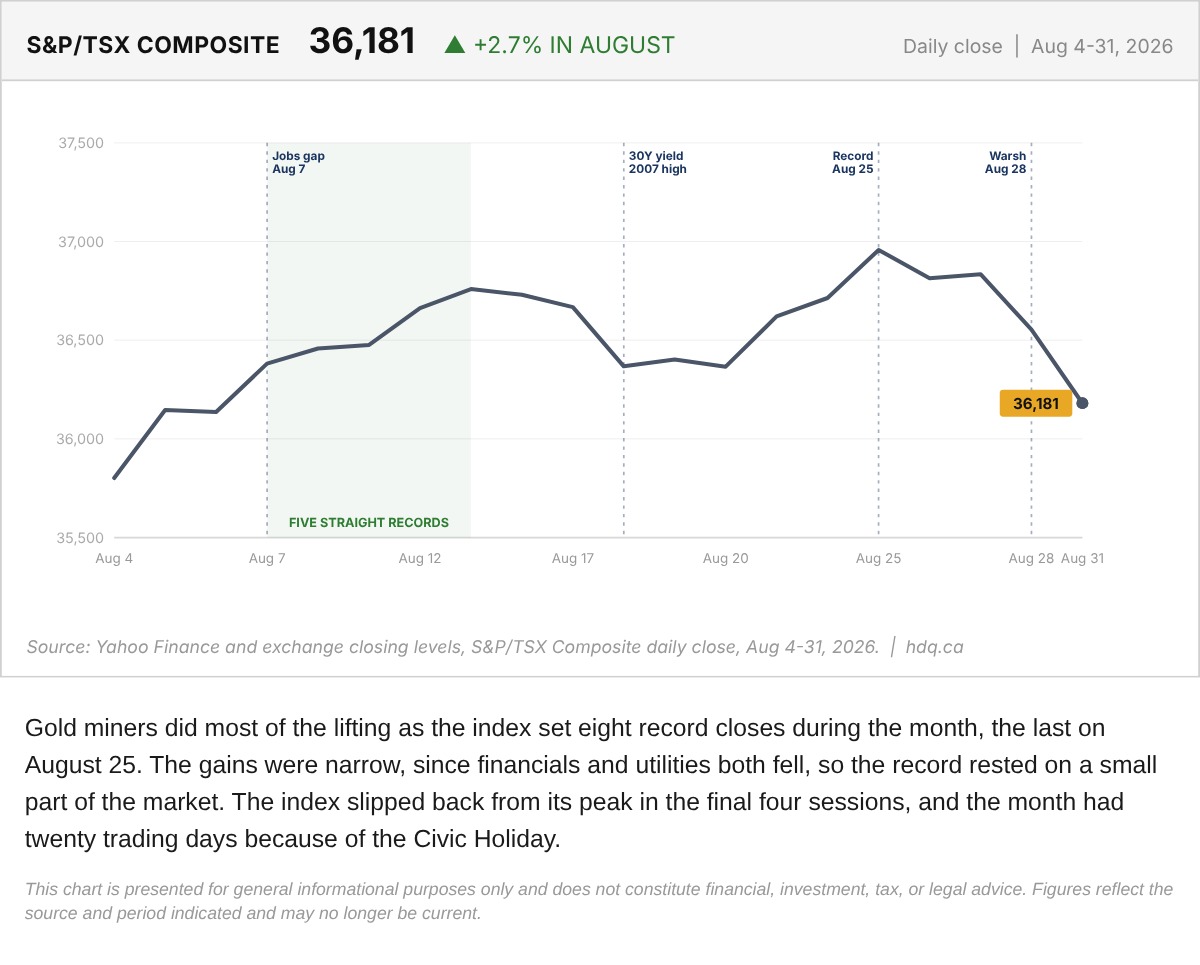
Gold miners did most of the lifting as the index set eight record closes during the month, the last on August 25.
S&P/TSX Composite Daily Close Through August 2026
August 31, 2026
View chart & download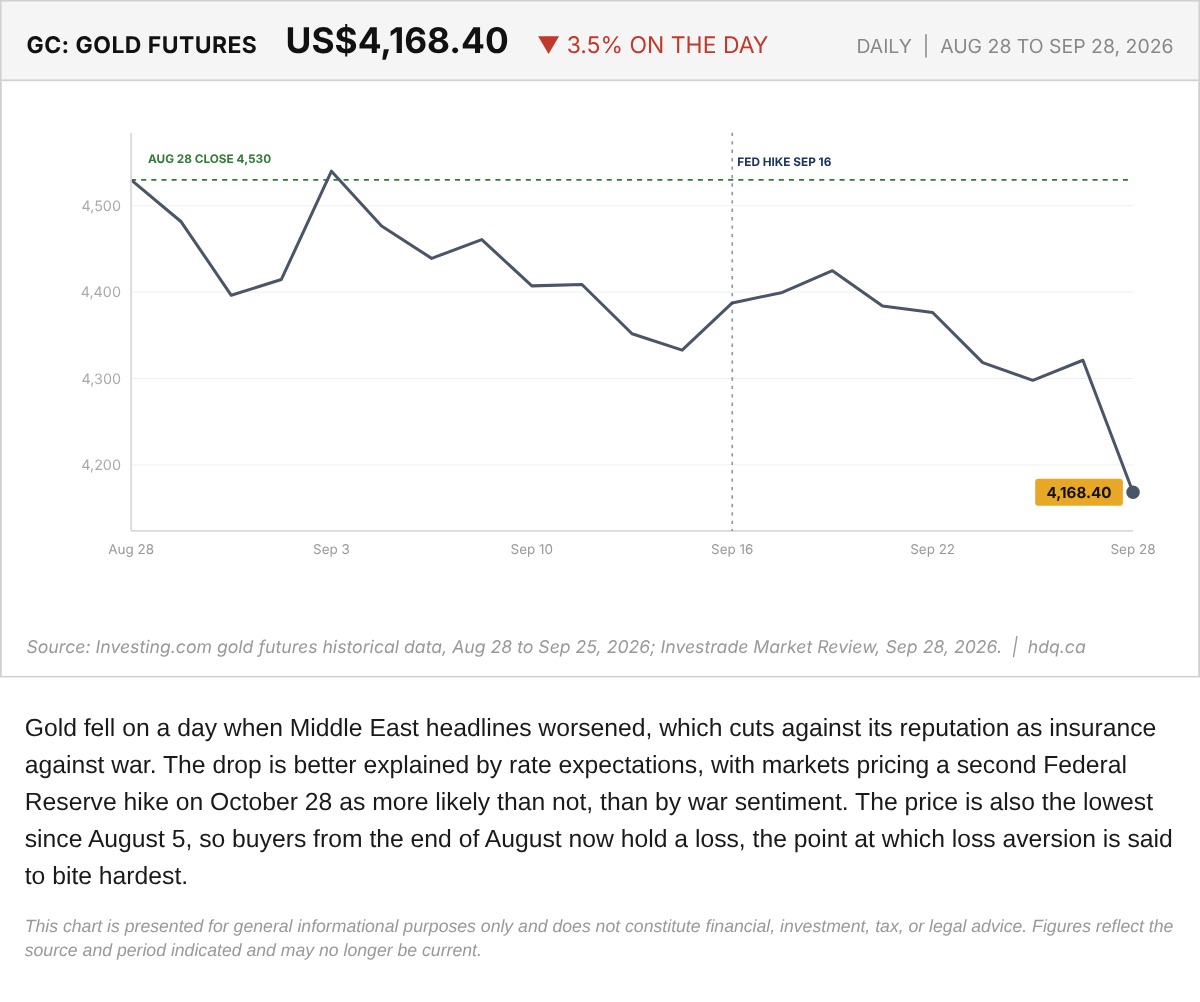
Gold fell on a day when Middle East headlines worsened, which cuts against its reputation as insurance against war.
Gold Futures After the September 28 Selloff, August 28 to September 28, 2026
September 29, 2026
View chart & download