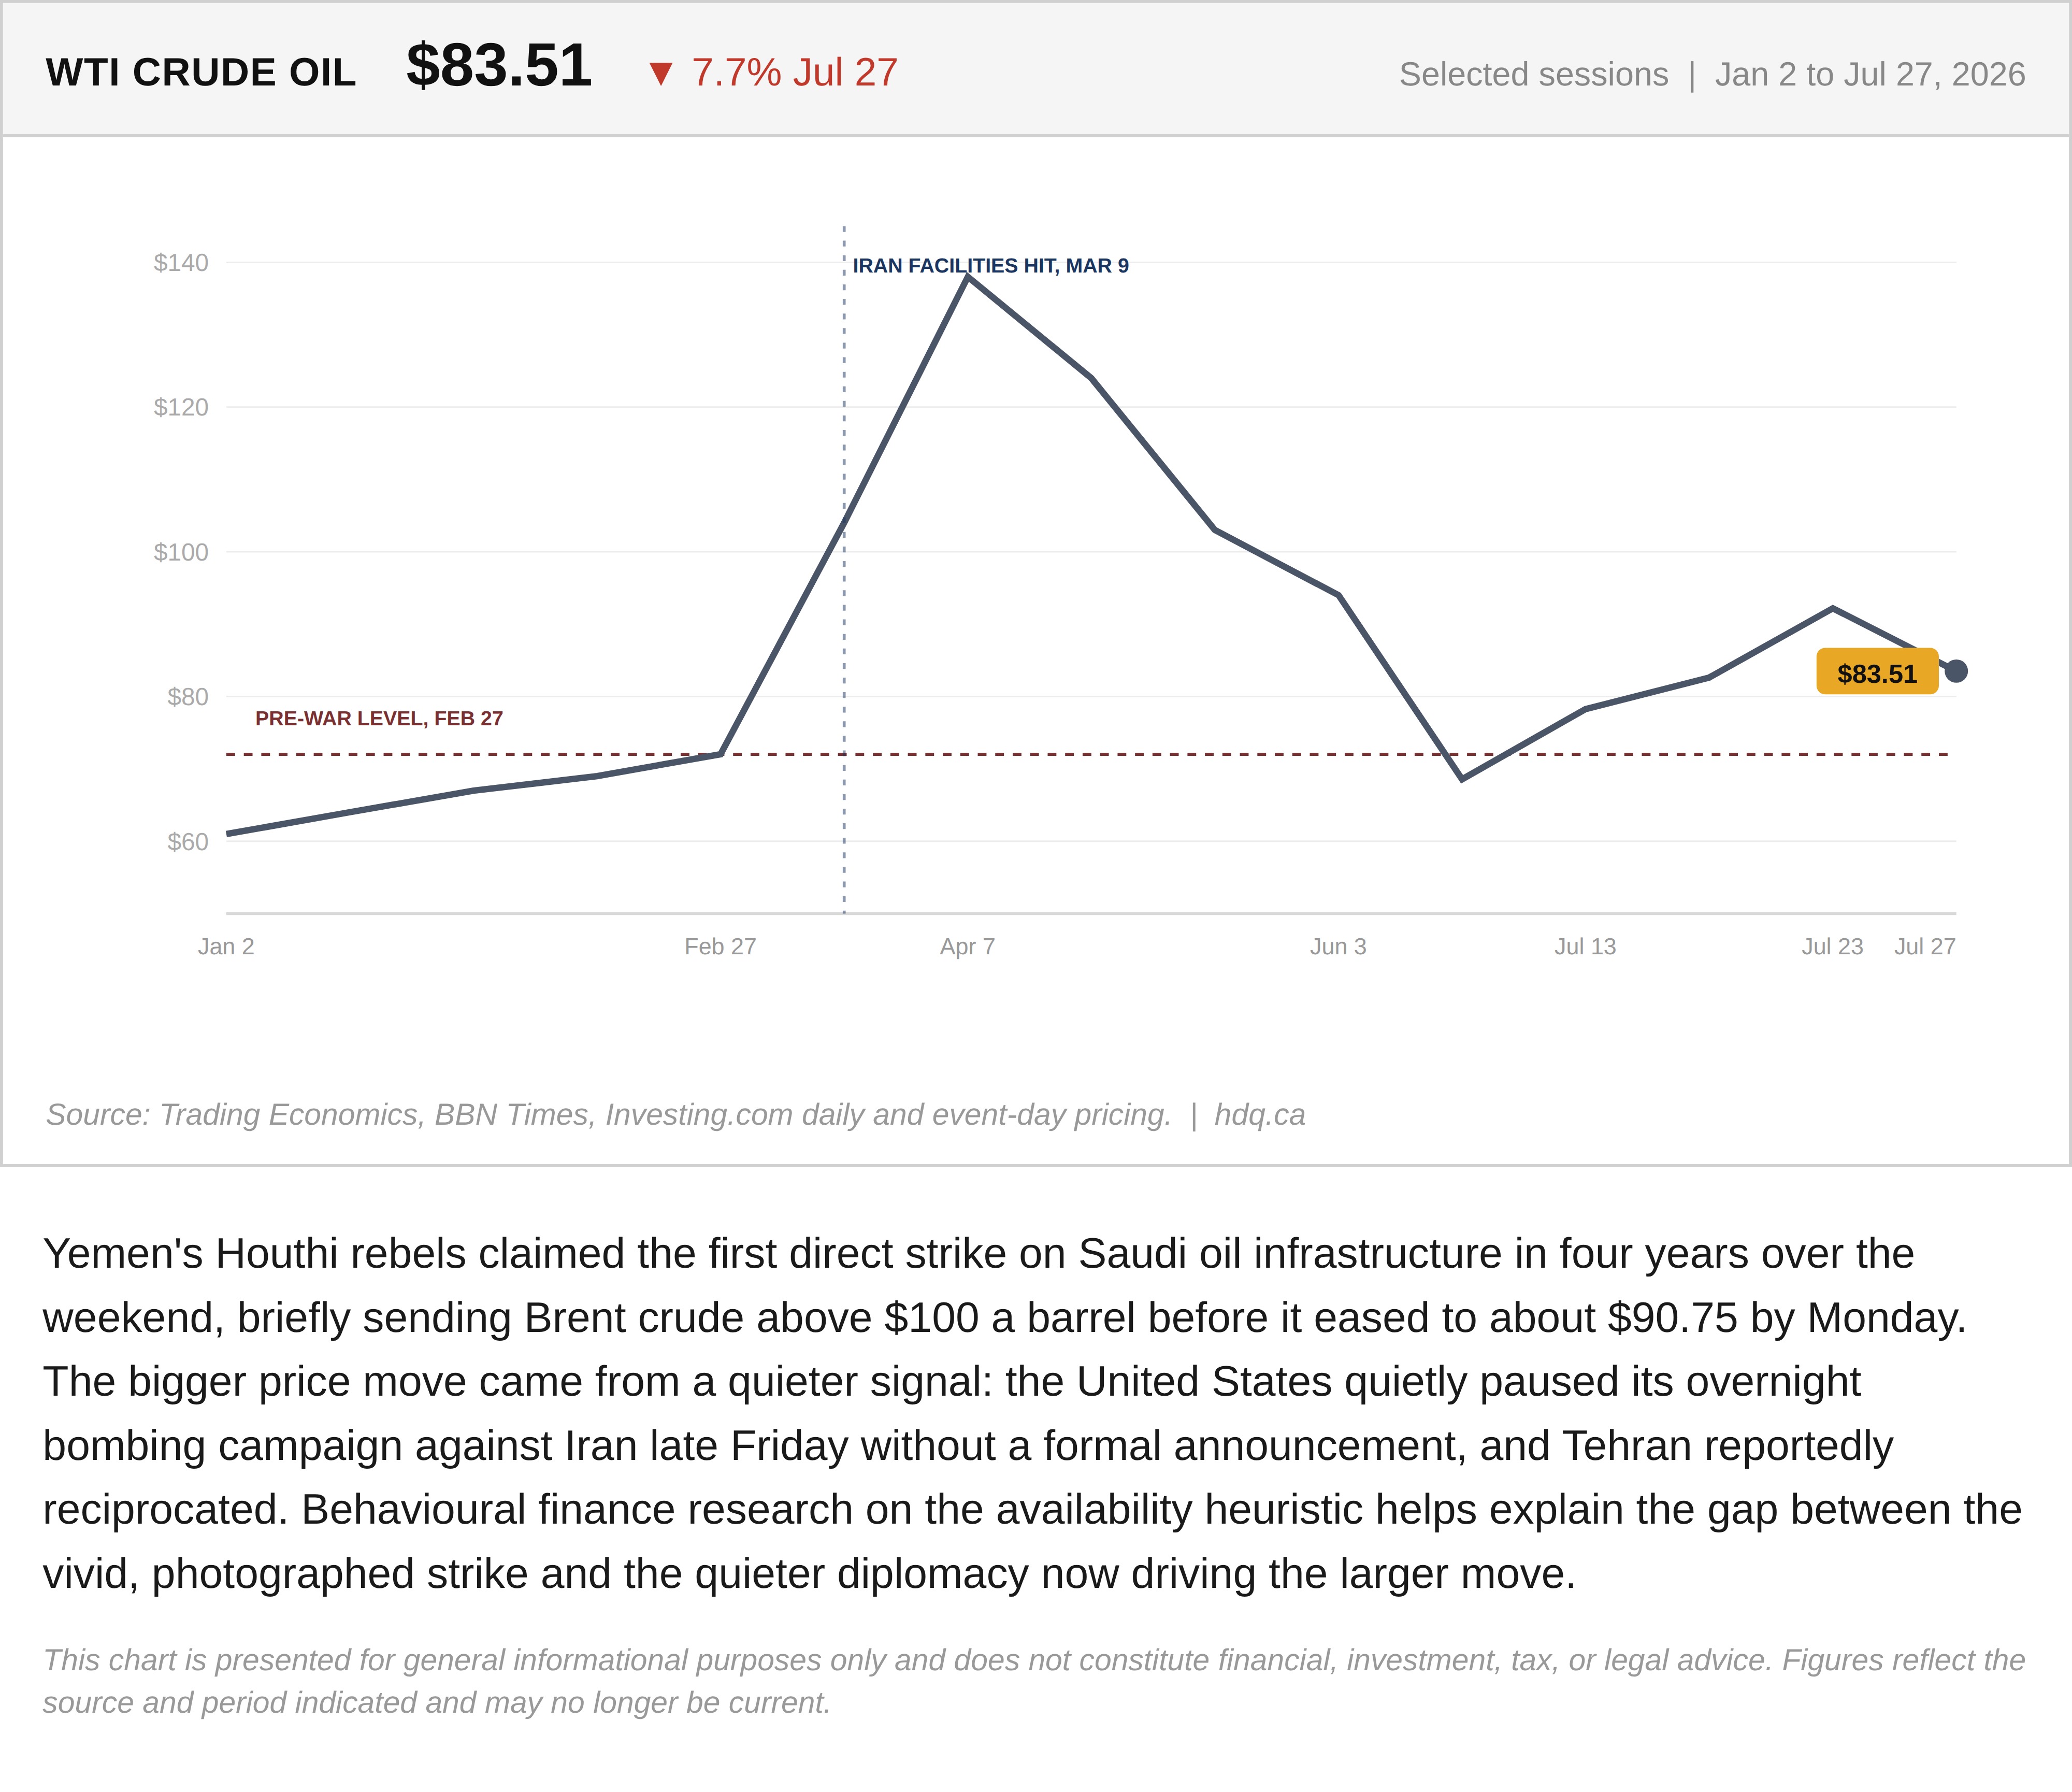
Yemen's Houthi rebels claimed the first direct strike on Saudi oil infrastructure in four years over the weekend, briefly sending Brent crude above $100 a barrel before it eased to about $90.75 by Monday. The bigger price move came from a quieter signal: the United States quietly paused its overnight bombing campaign against Iran late Friday without a formal announcement, and Tehran reportedly reciprocated. Behavioural finance research on the availability heuristic helps explain the gap between the vivid, photographed strike and the quieter diplomacy now driving the larger move.
This chart is presented for general informational purposes only and does not constitute financial, investment, tax, or legal advice. Figures reflect the source and period indicated and may no longer be current.

Related charts
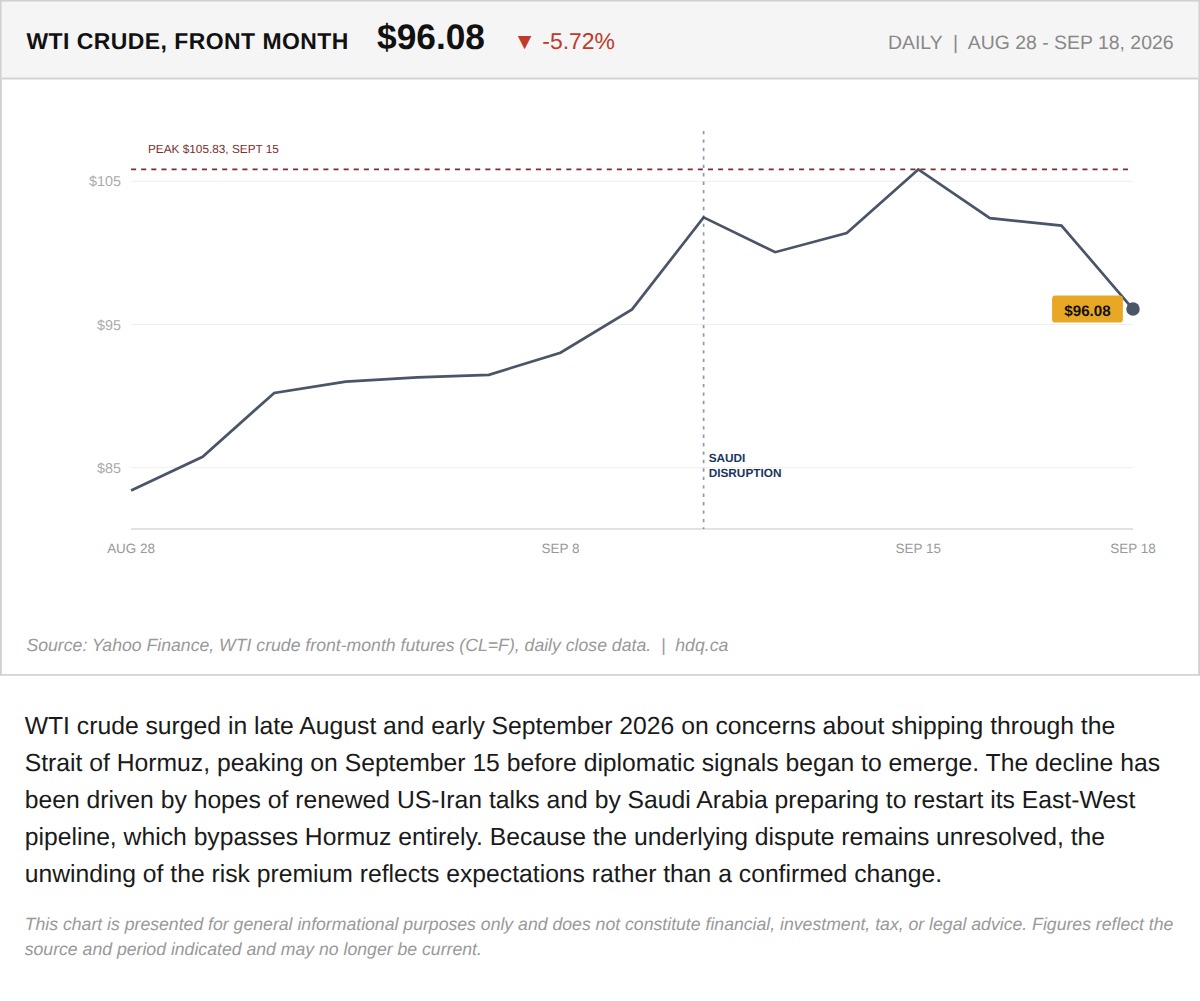
WTI crude surged in late August and early September 2026 on concerns about shipping through the Strait of Hormuz, peaking on September 15 before diplomatic signals began to emerge.
The Oil Market Has Priced a Hormuz Outcome That Has Not Happened Yet
September 23, 2026
View chart & download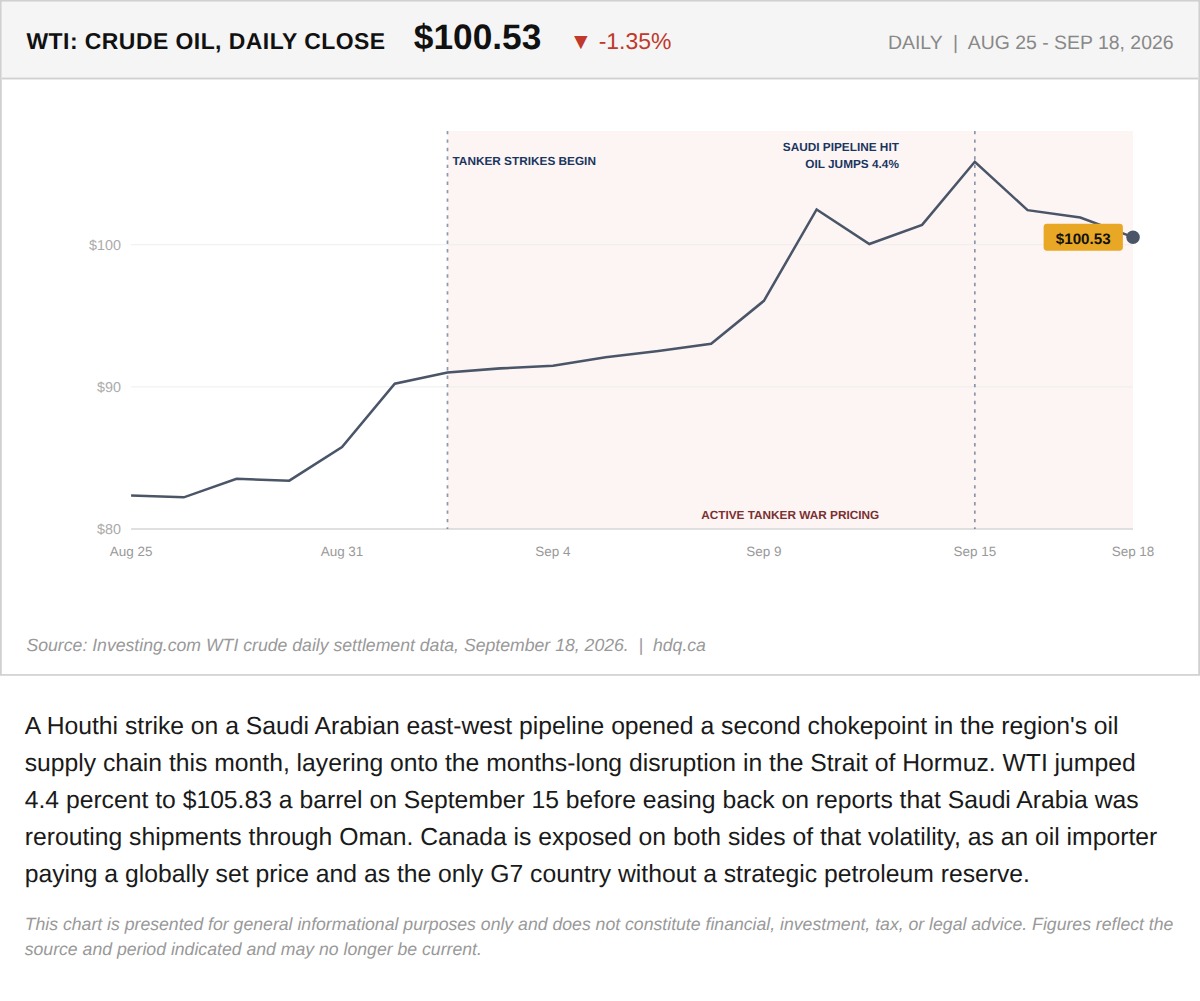
A Houthi strike on a Saudi Arabian east-west pipeline opened a second chokepoint in the region's oil supply chain this month, layering onto…
The Strait of Hormuz Story Just Got a Second Chokepoint, and Canada Has Exposure on Both Sides
September 18, 2026
View chart & download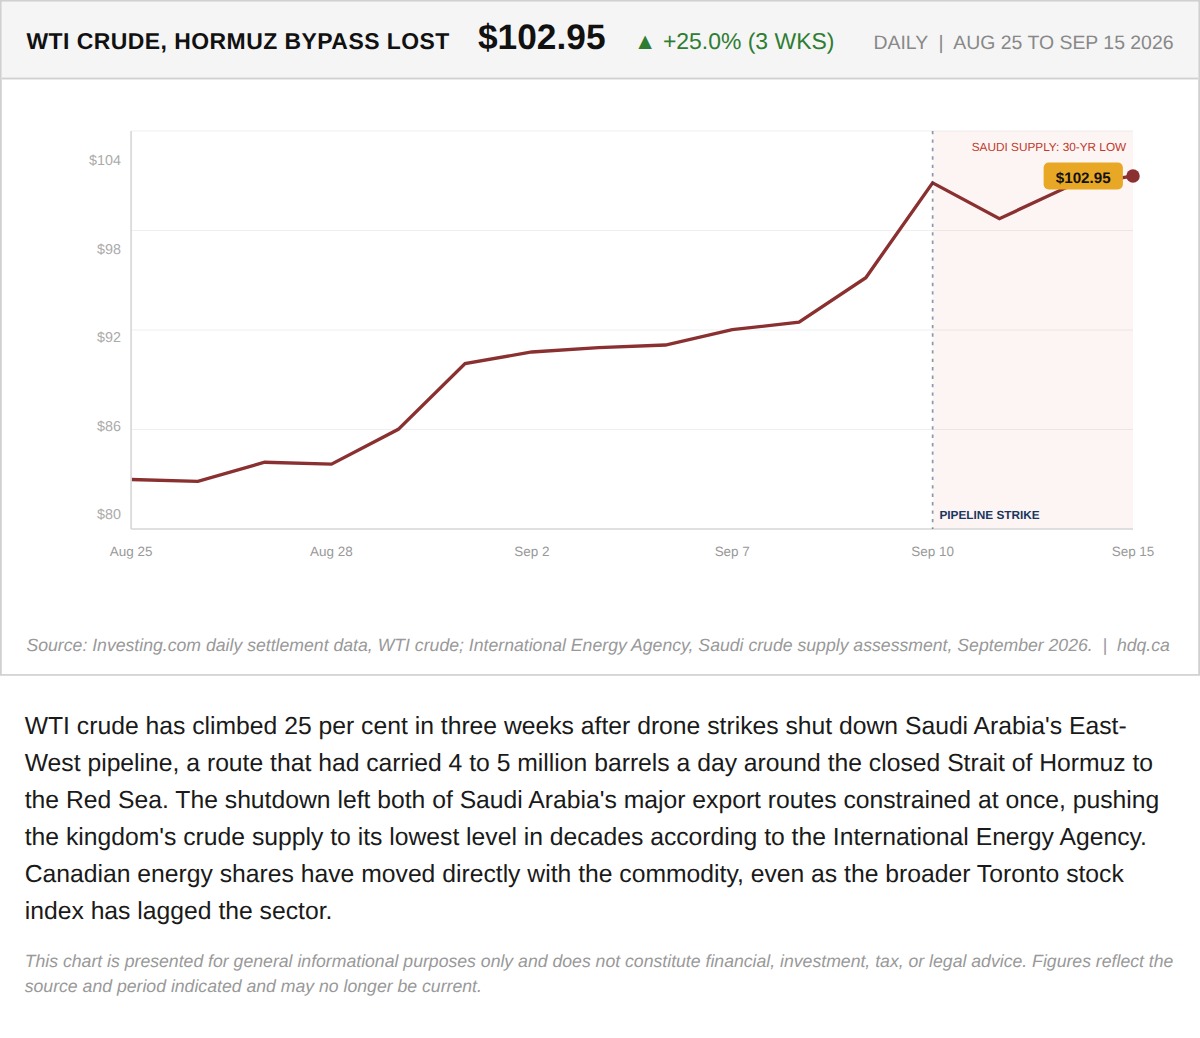
WTI crude has climbed 25 per cent in three weeks after drone strikes shut down Saudi Arabia's East-West pipeline, a route that had carried…
Iran Closed the Strait of Hormuz. This Week, Militias Closed the Detour Around It.
September 15, 2026
View chart & download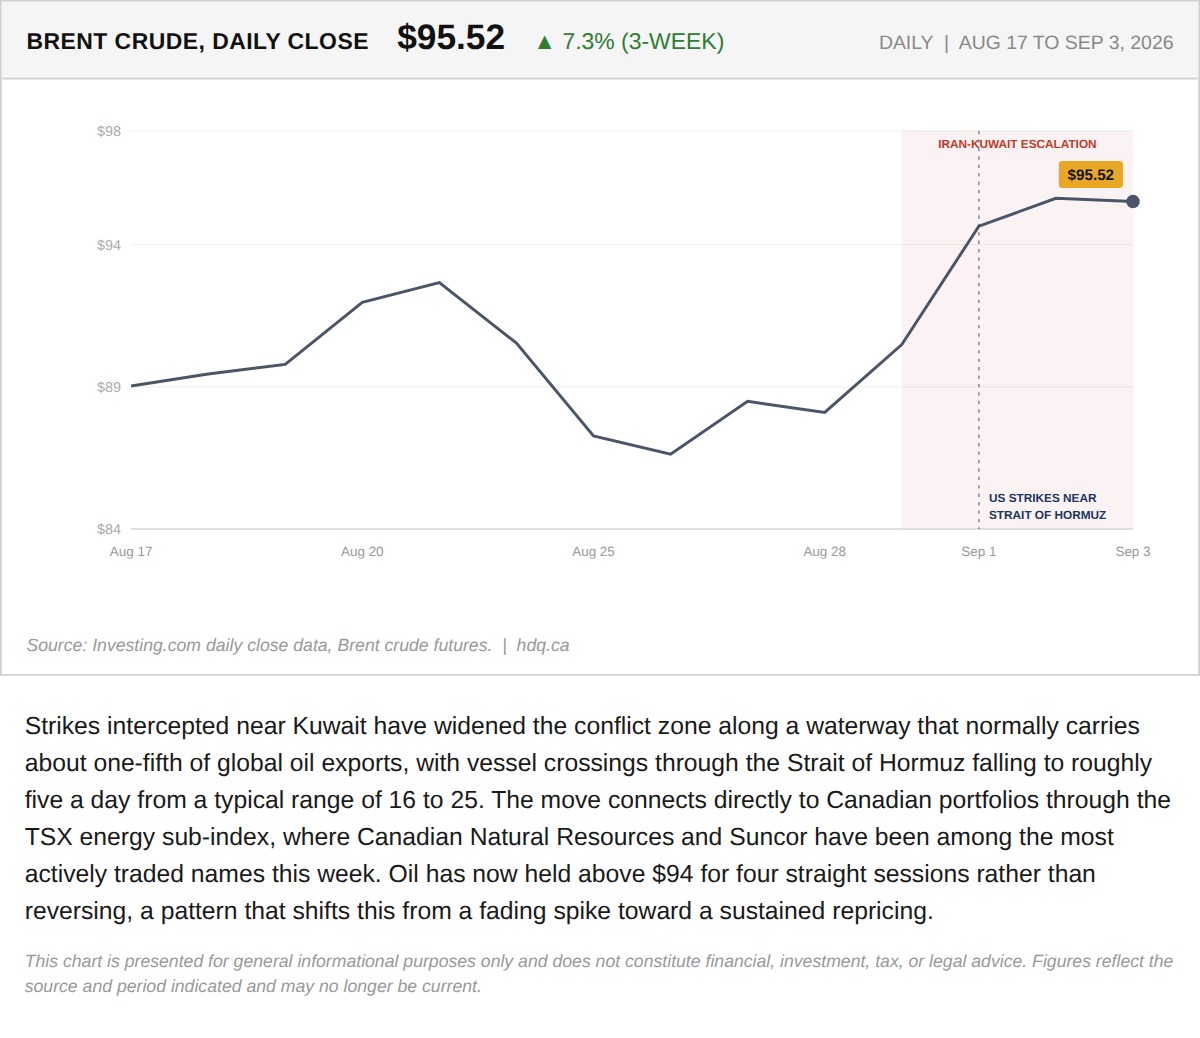
Strikes intercepted near Kuwait have widened the conflict zone along a waterway that normally carries about one-fifth of global oil…
September 4, 2026
View chart & download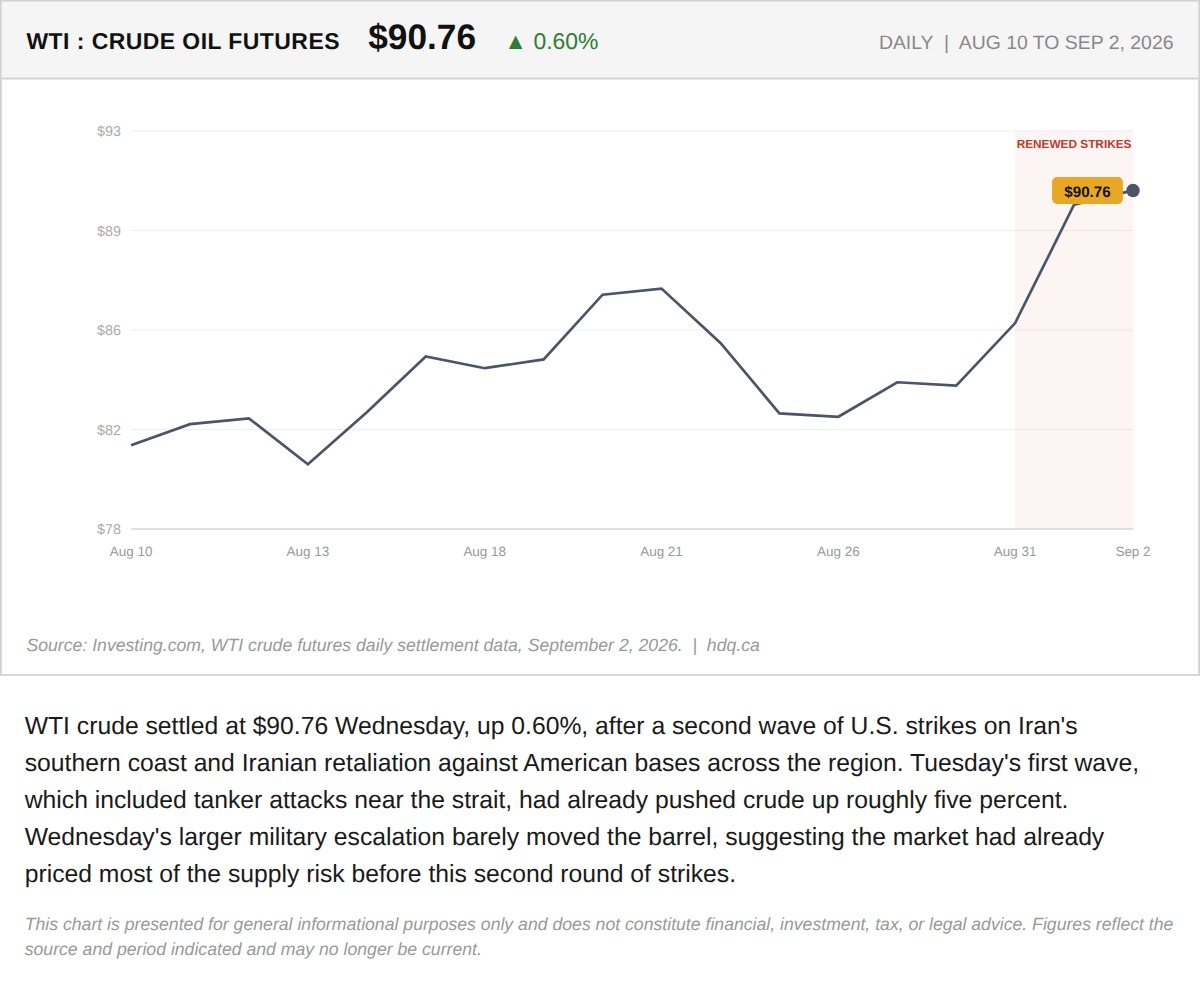
WTI crude settled at $90.76 Wednesday, up 0.60%, after a second wave of U.S.
WTI Crude Adds 0.60% as a Second Wave of Strikes Near Iran Barely Moves the Barrel
September 2, 2026
View chart & download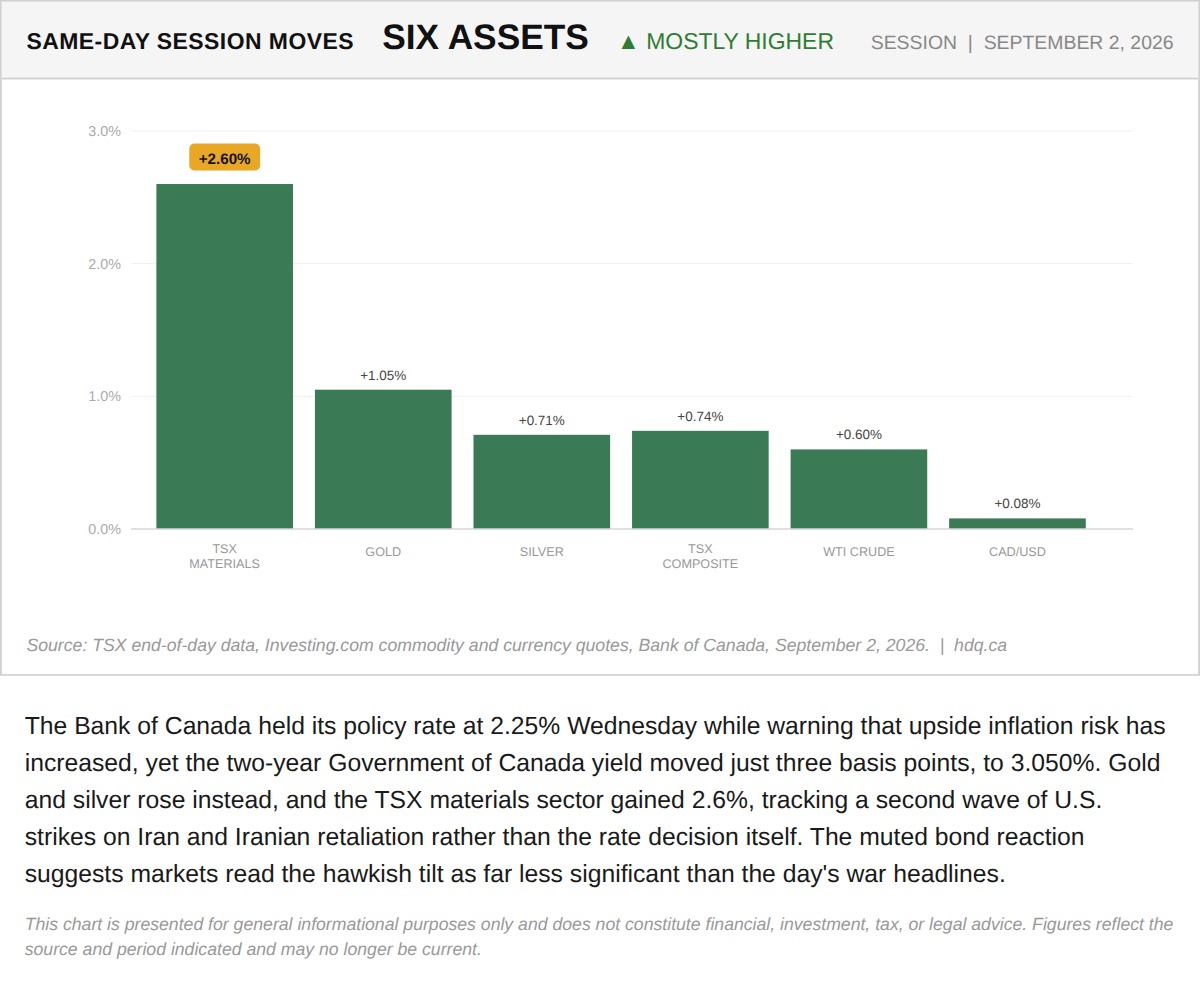
The Bank of Canada held its policy rate at 2.25% Wednesday while warning that upside inflation risk has increased, yet the two-year…
TSX Materials, Gold and Silver Lead a Broad Same-Day Rally Across Six Assets
September 2, 2026
View chart & download