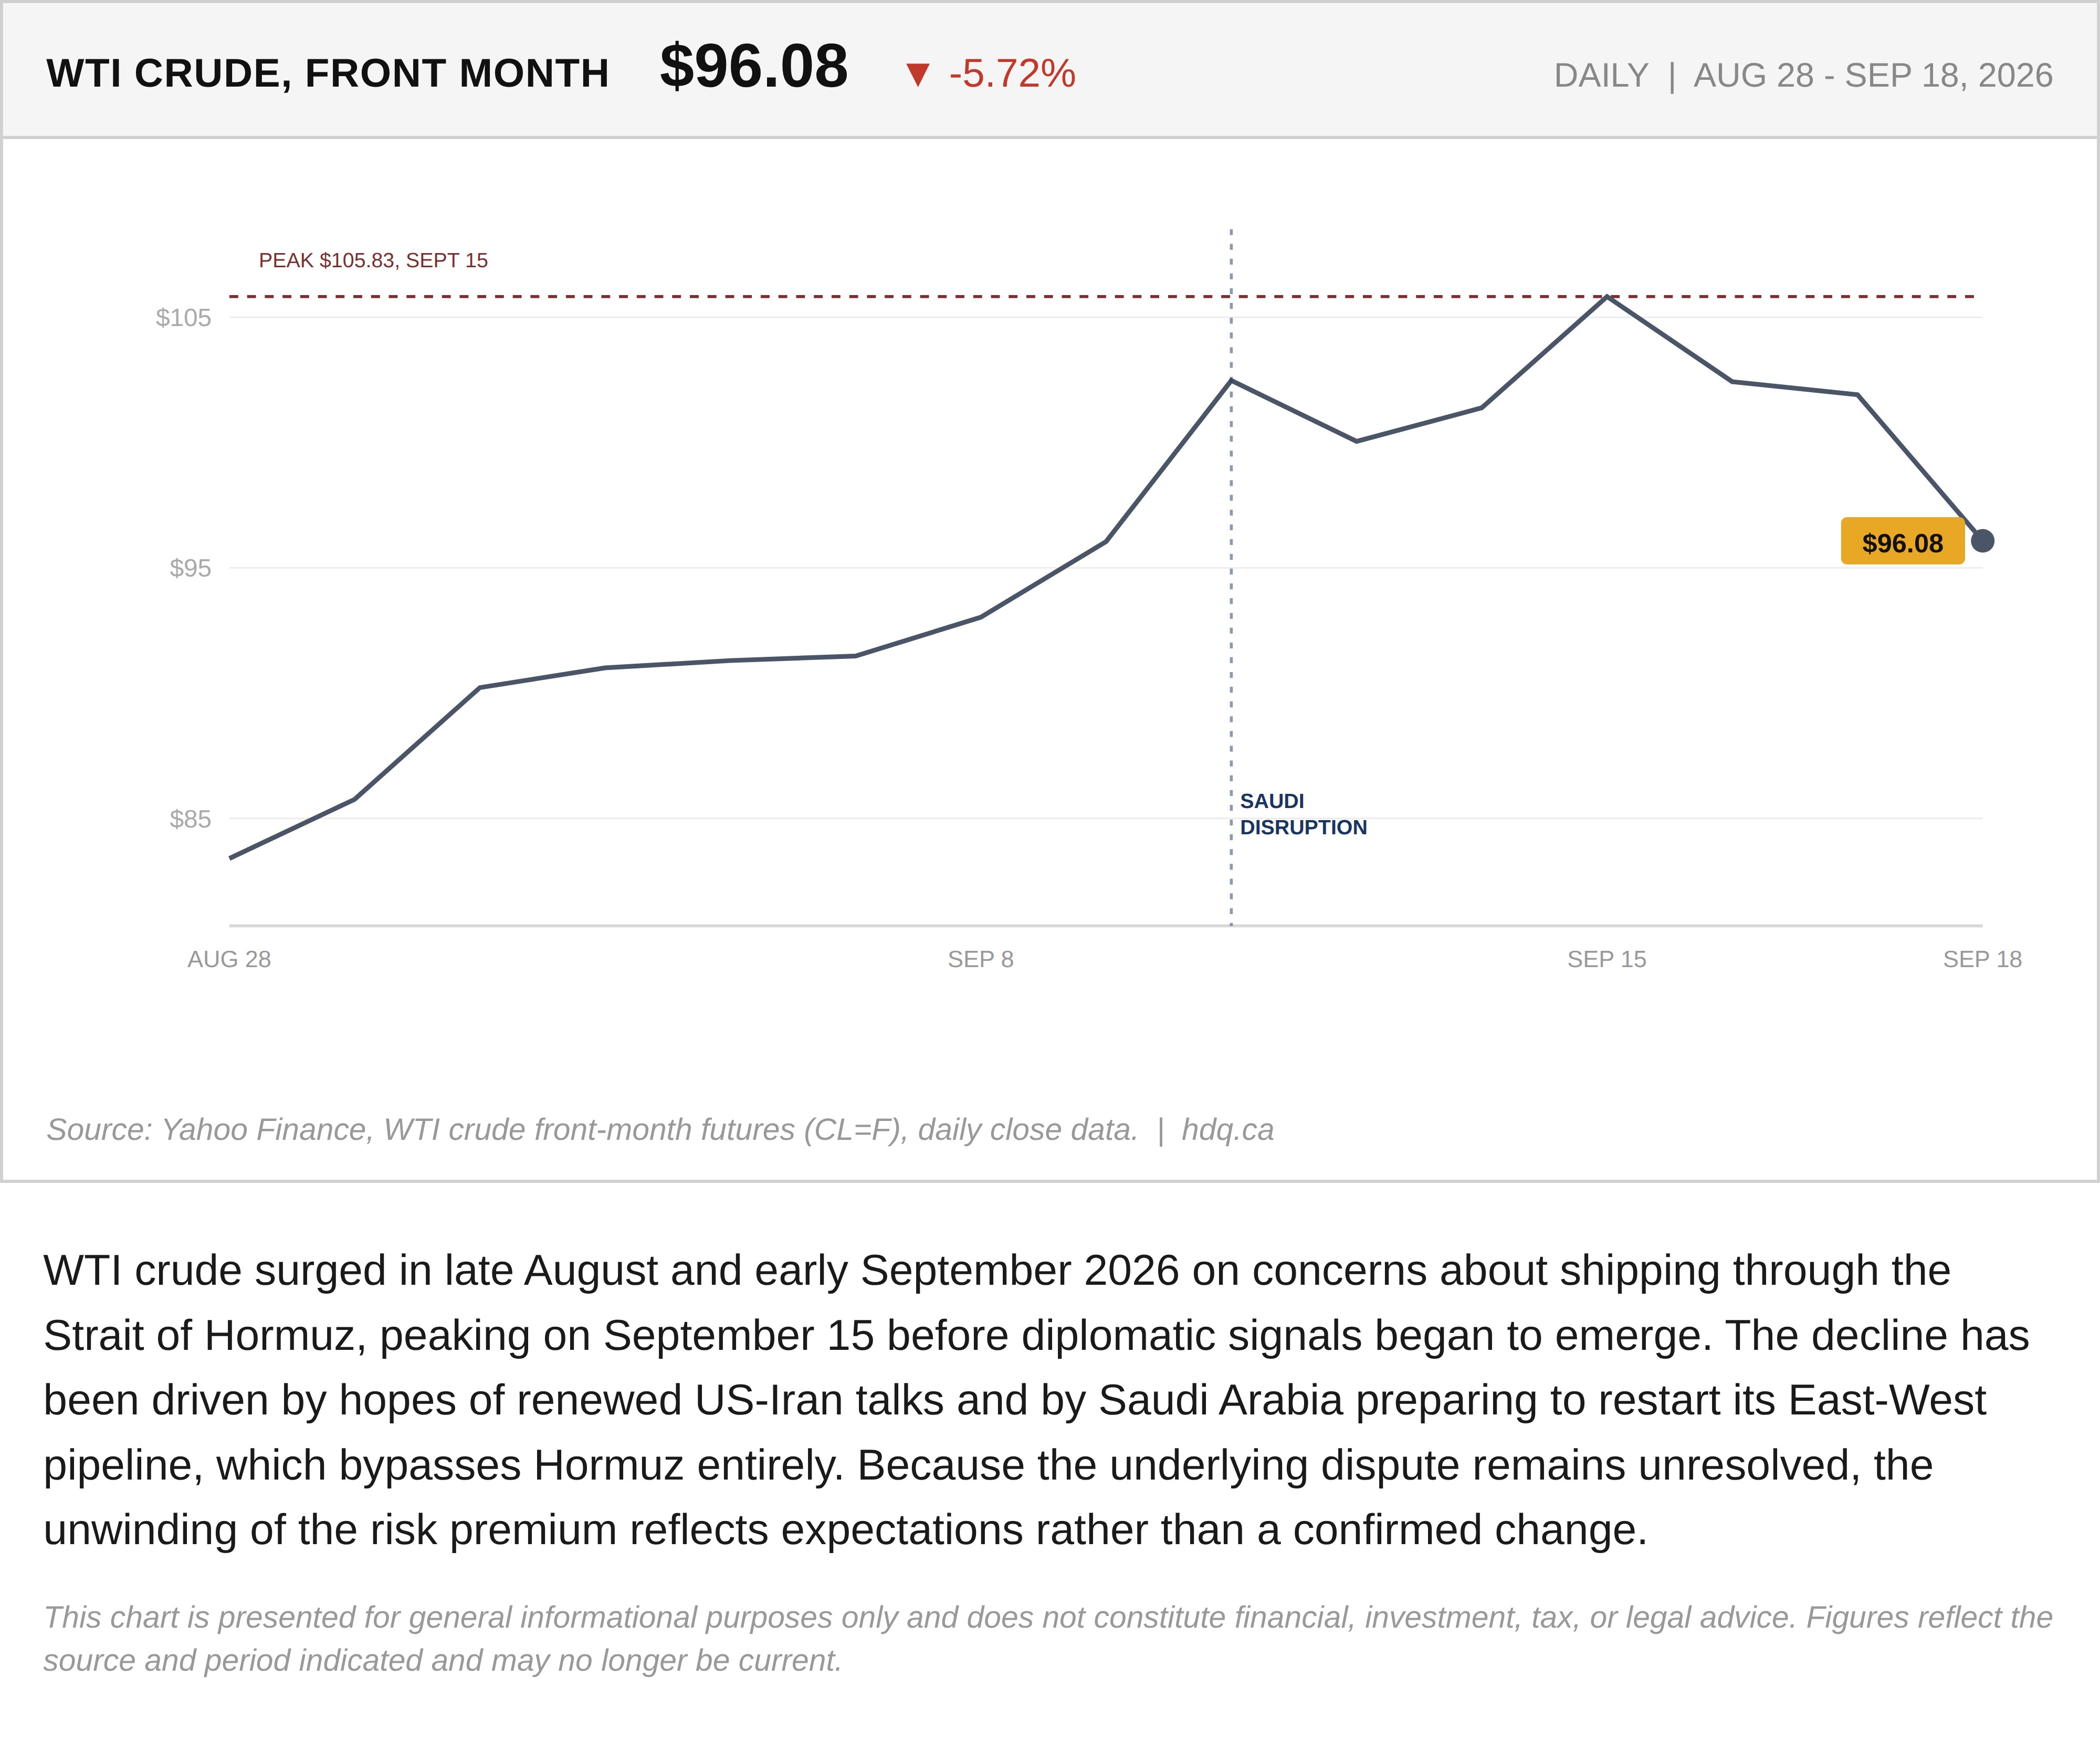
WTI crude surged in late August and early September 2026 on concerns about shipping through the Strait of Hormuz, peaking on September 15 before diplomatic signals began to emerge. The decline has been driven by hopes of renewed US-Iran talks and by Saudi Arabia preparing to restart its East-West pipeline, which bypasses Hormuz entirely. Because the underlying dispute remains unresolved, the unwinding of the risk premium reflects expectations rather than a confirmed change.
This chart is presented for general informational purposes only and does not constitute financial, investment, tax, or legal advice. Figures reflect the source and period indicated and may no longer be current.
Related charts
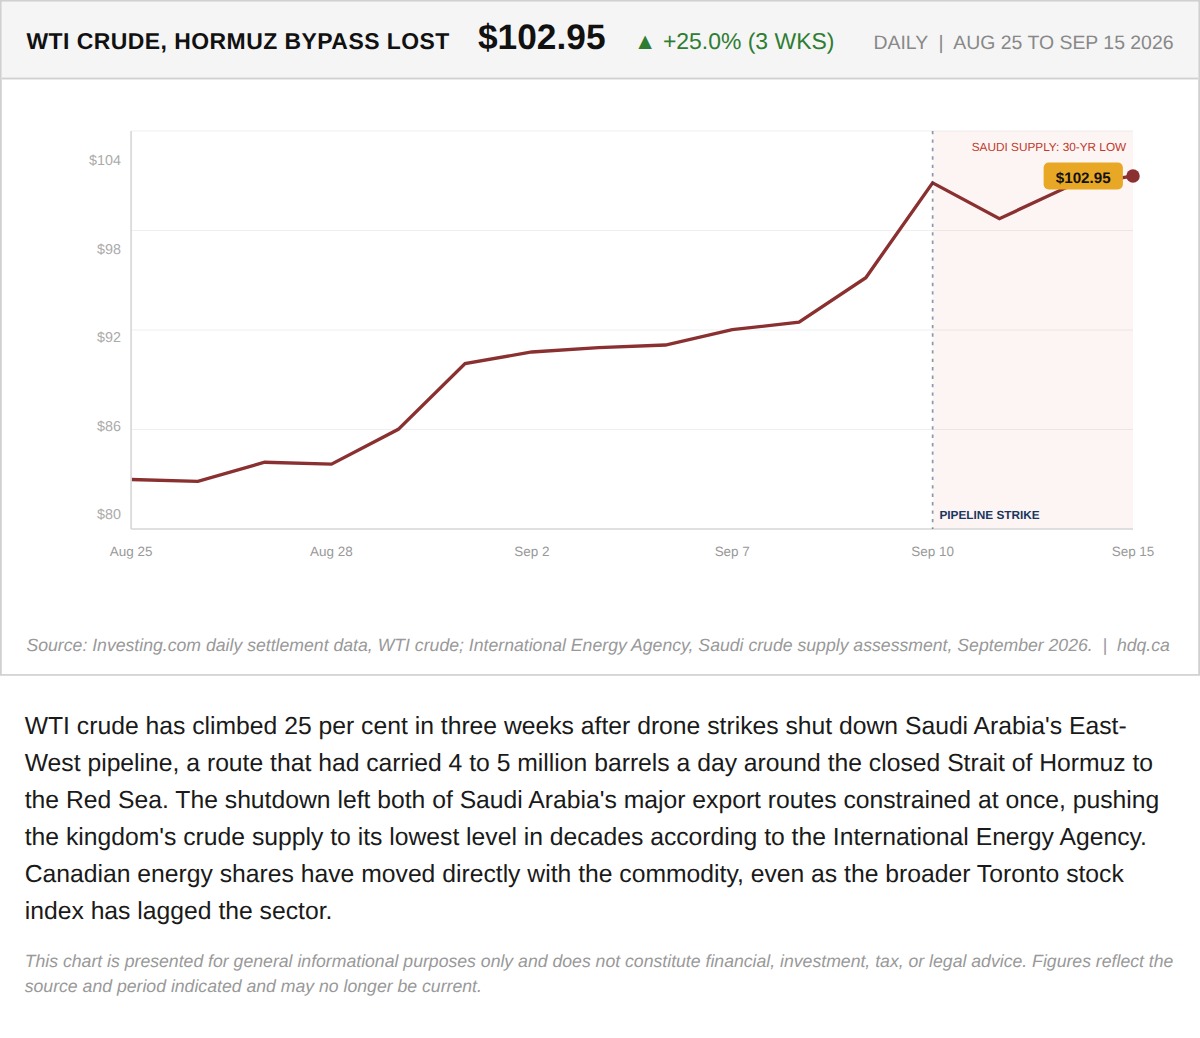
WTI crude has climbed 25 per cent in three weeks after drone strikes shut down Saudi Arabia's East-West pipeline, a route that had carried…
Iran Closed the Strait of Hormuz. This Week, Militias Closed the Detour Around It.
September 15, 2026
View chart & download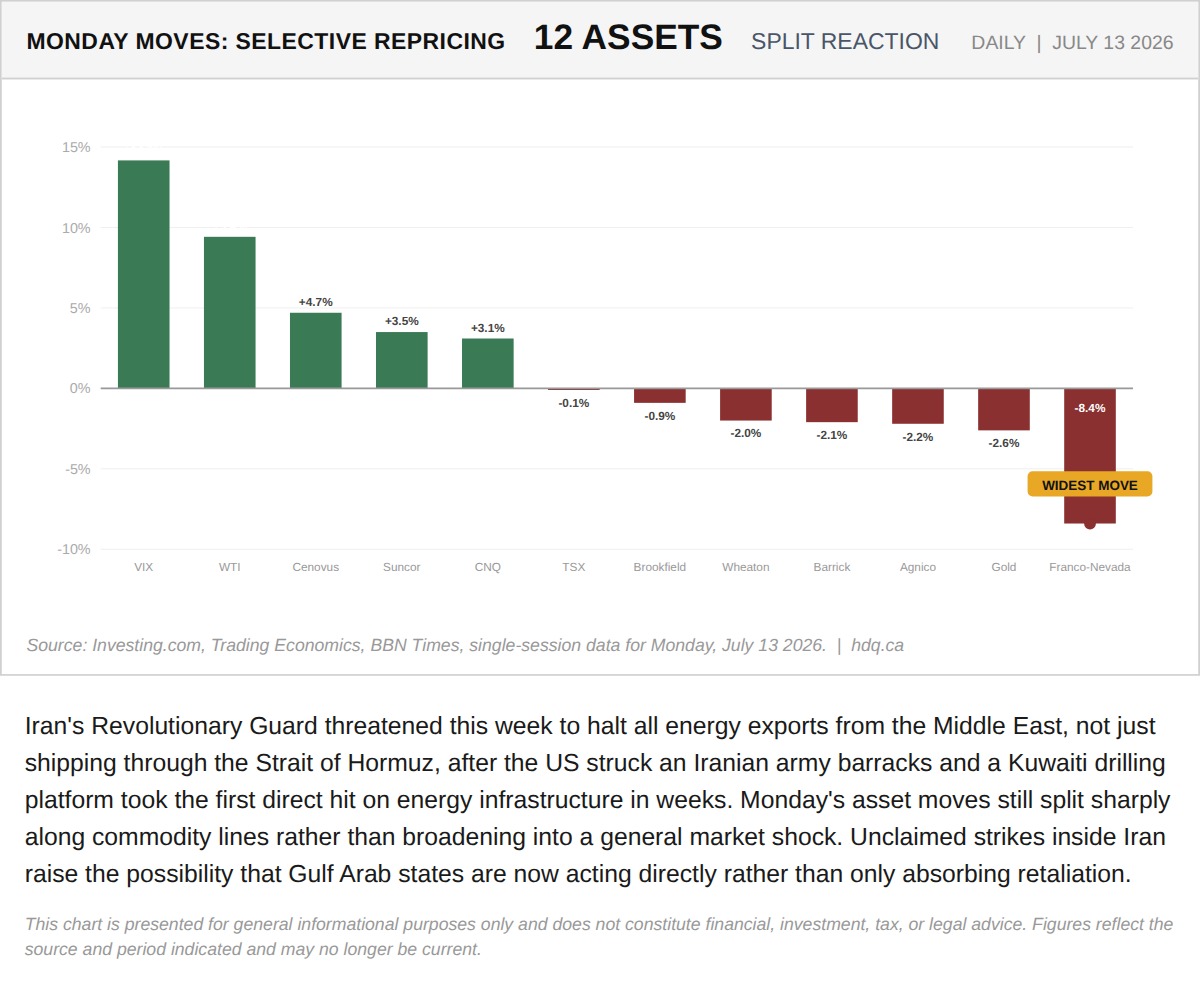
Iran's Revolutionary Guard threatened this week to halt all energy exports from the Middle East, not just shipping through the Strait of…
Iran's Threat Just Moved From Controlling the Strait to Threatening the Whole Gulf's Oil
July 15, 2026
View chart & download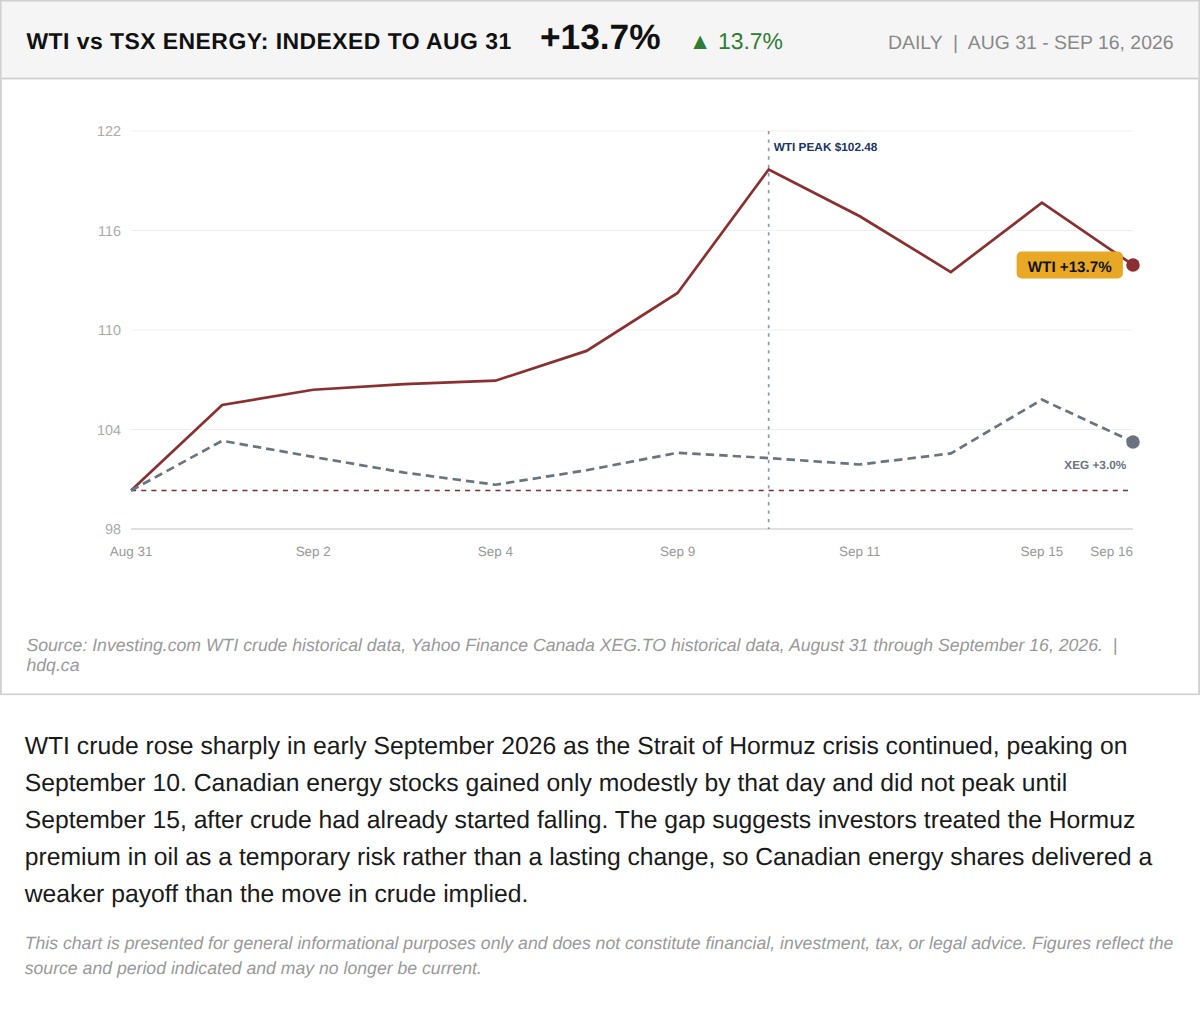
WTI crude rose sharply in early September 2026 as the Strait of Hormuz crisis continued, peaking on September 10.
The Hormuz Premium Did Not Show Up in Canadian Energy Stocks
September 22, 2026
View chart & download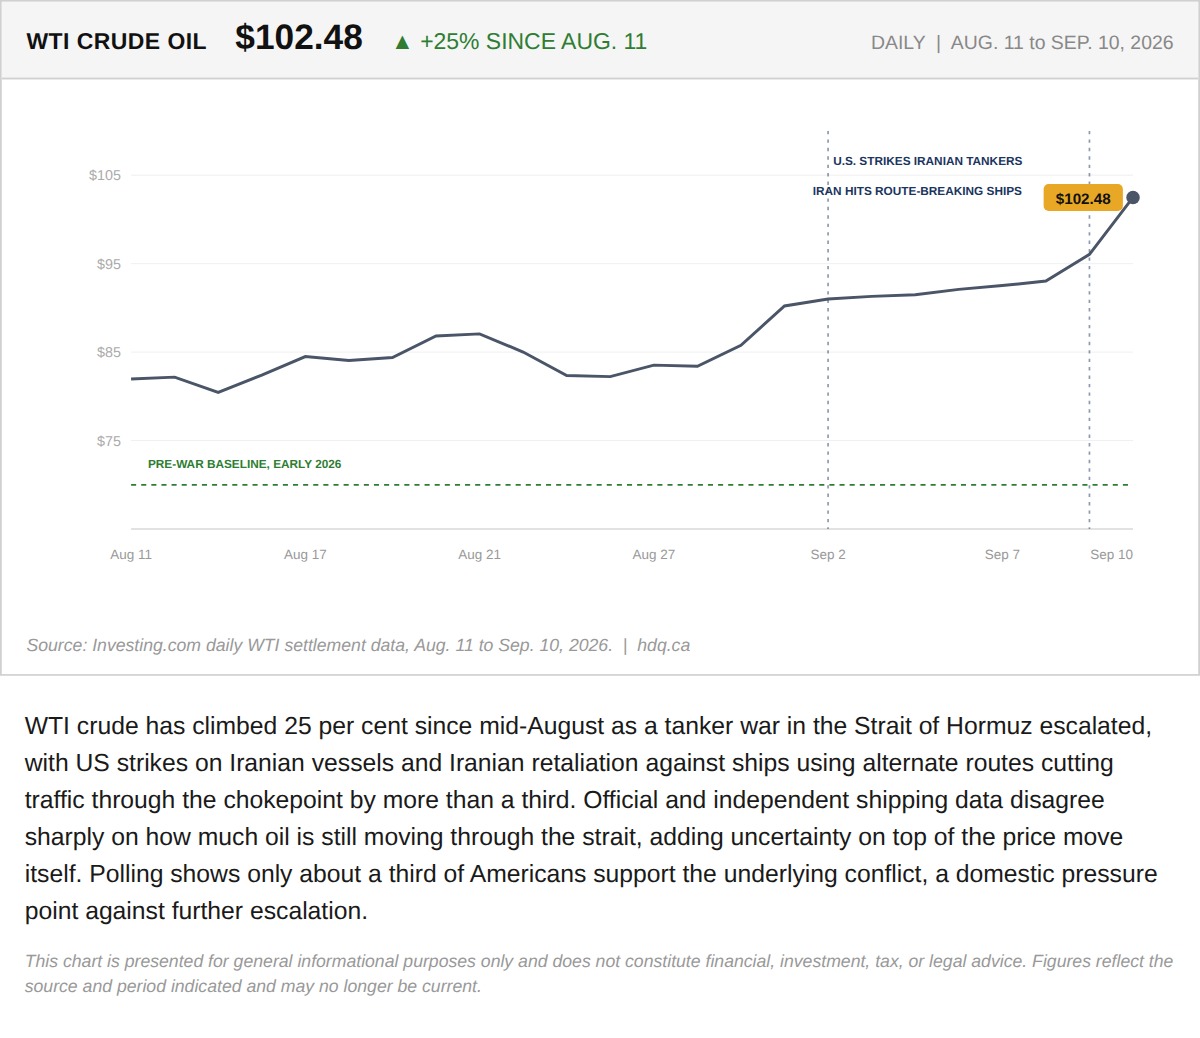
WTI crude has climbed 25 per cent since mid-August as a tanker war in the Strait of Hormuz escalated, with US strikes on Iranian vessels…
The Tanker War in the Strait of Hormuz Just Repriced Every Canadian Energy Position
September 11, 2026
View chart & download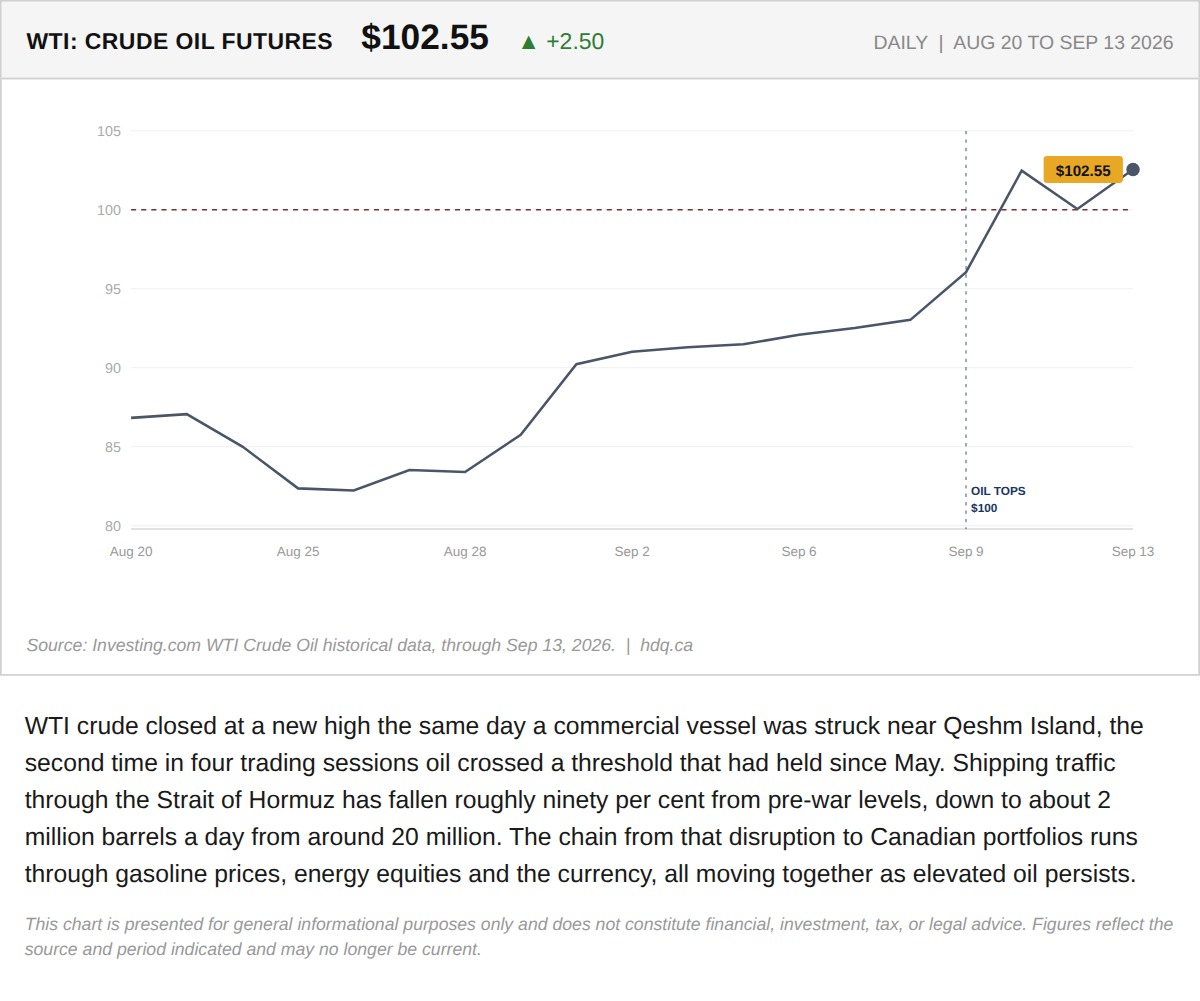
WTI crude closed at a new high the same day a commercial vessel was struck near Qeshm Island, the second time in four trading sessions oil…
A Tanker Strike Near Qeshm Island Confirms Oil Above $100 Is Not a Blip
September 14, 2026
View chart & download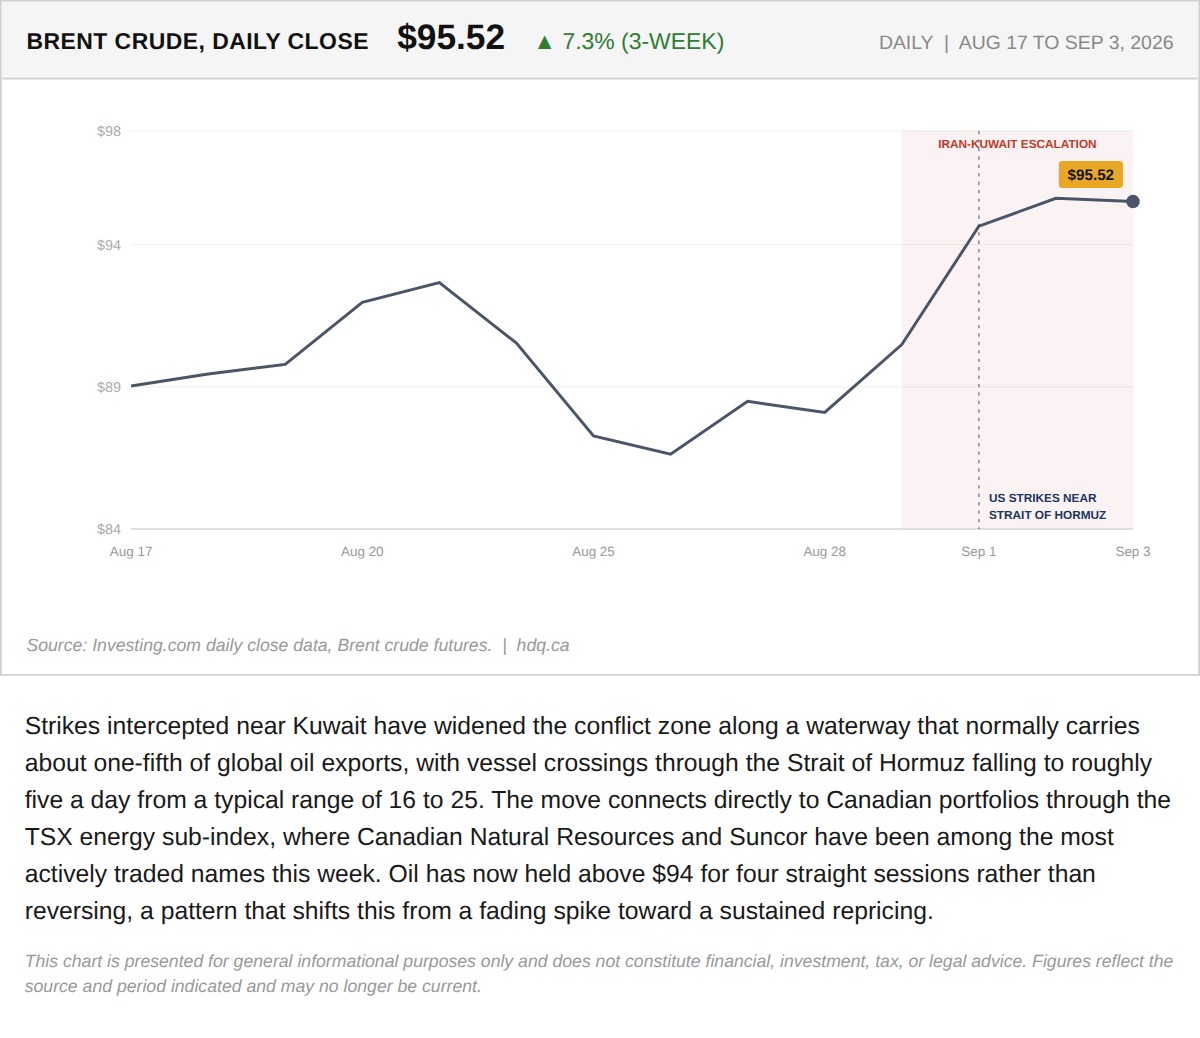
Strikes intercepted near Kuwait have widened the conflict zone along a waterway that normally carries about one-fifth of global oil…
September 4, 2026
View chart & download