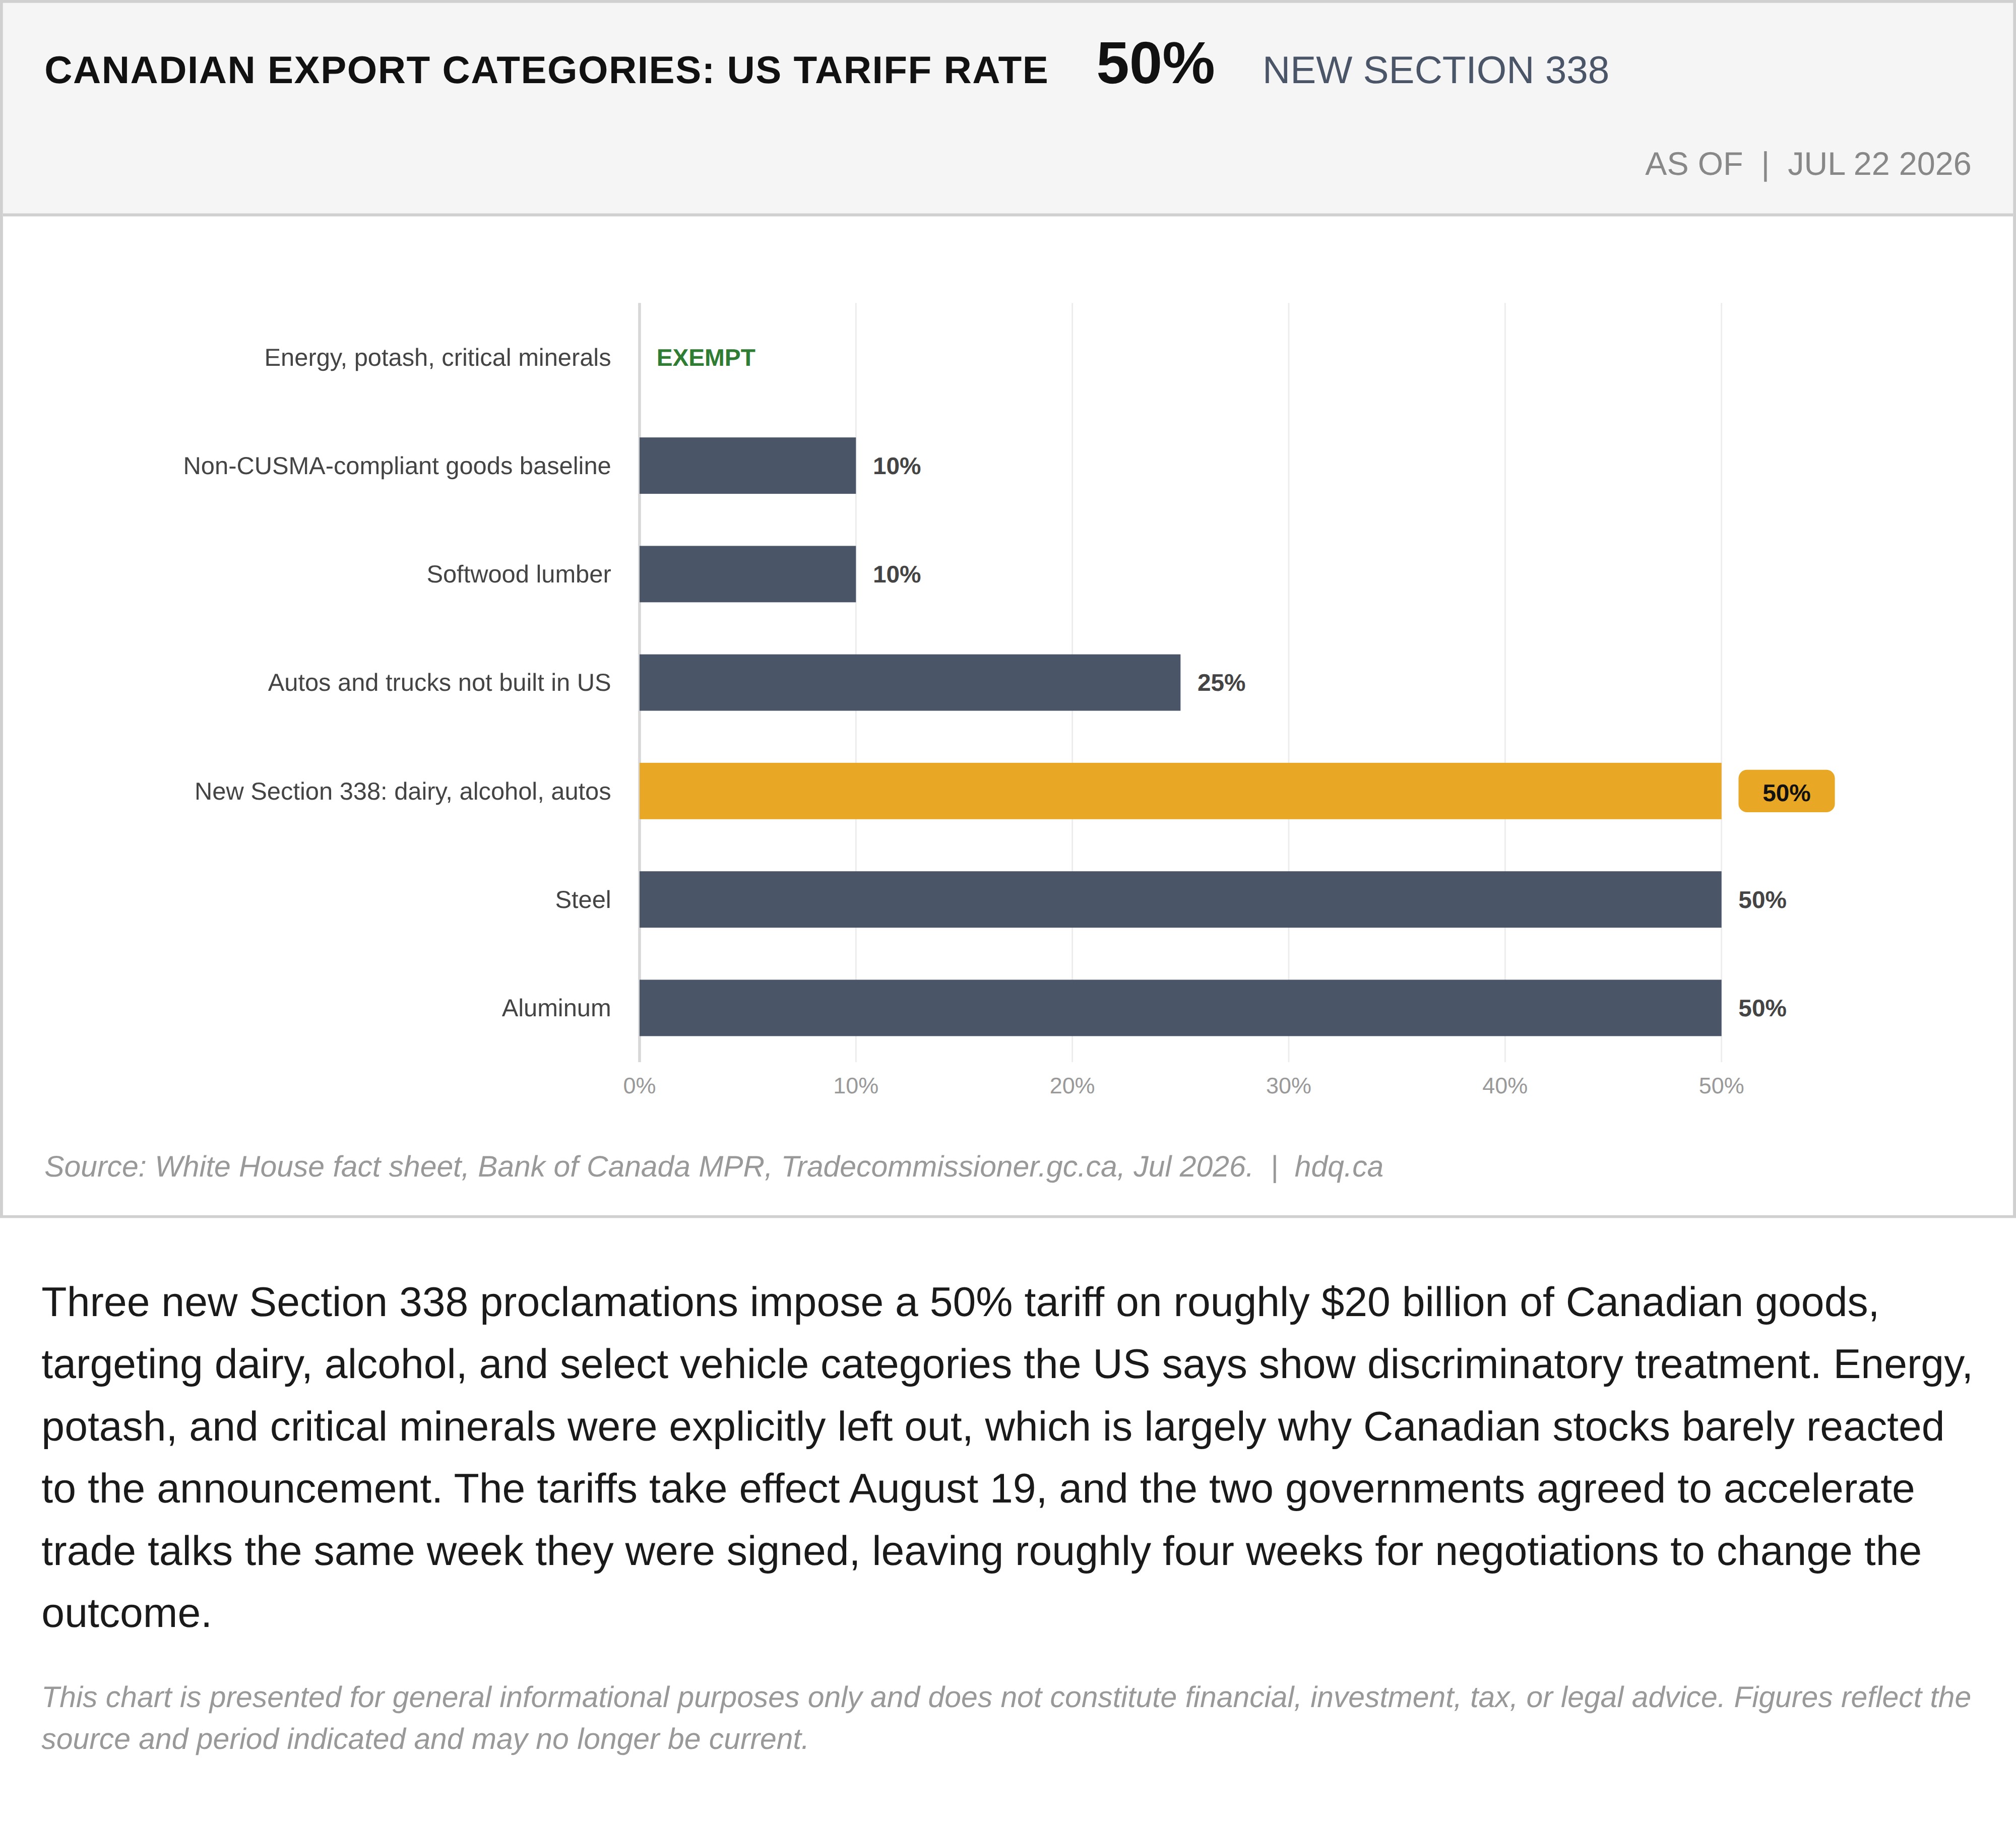
Three new Section 338 proclamations impose a 50% tariff on roughly $20 billion of Canadian goods, targeting dairy, alcohol, and select vehicle categories the US says show discriminatory treatment. Energy, potash, and critical minerals were explicitly left out, which is largely why Canadian stocks barely reacted to the announcement. The tariffs take effect August 19, and the two governments agreed to accelerate trade talks the same week they were signed, leaving roughly four weeks for negotiations to change the outcome.
This chart is presented for general informational purposes only and does not constitute financial, investment, tax, or legal advice. Figures reflect the source and period indicated and may no longer be current.

Related charts
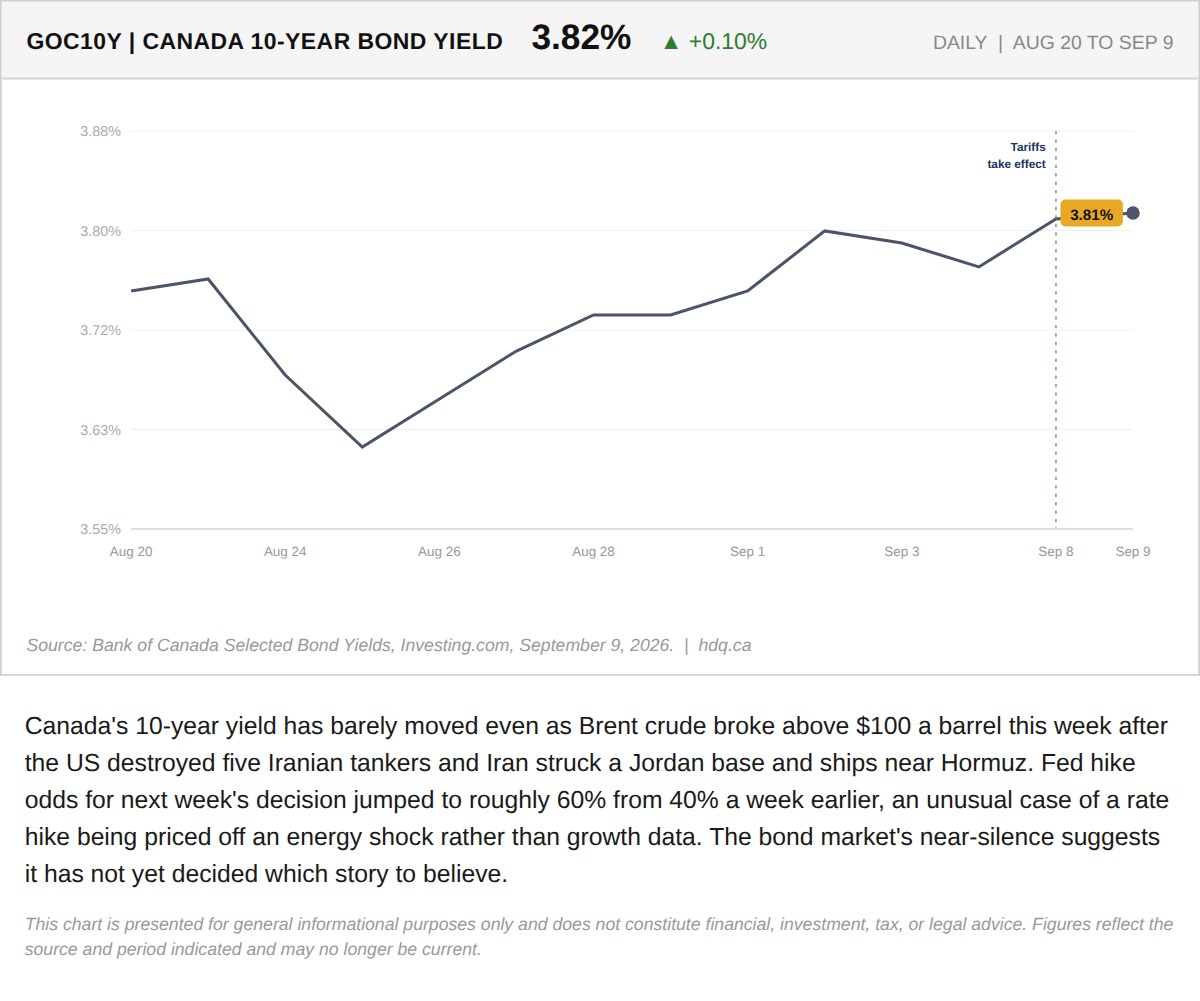
Canada's 10-year yield has barely moved even as Brent crude broke above $100 a barrel this week after the US destroyed five Iranian tankers…
Canada's 10-Year Bond Yield Grinds to a Two-Year High While Oil Tops $100
September 9, 2026
View chart & download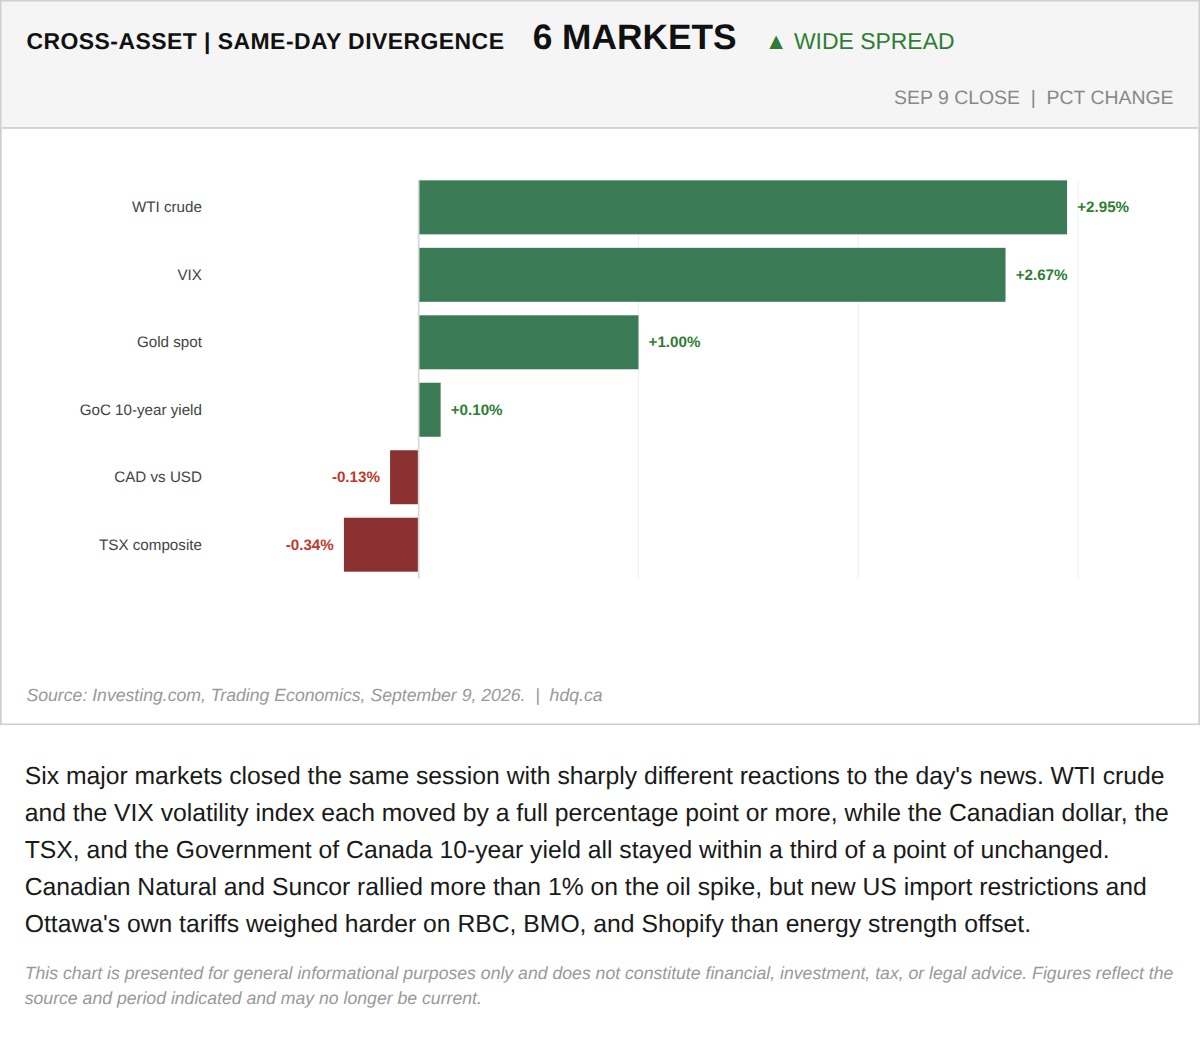
Six major markets closed the same session with sharply different reactions to the day's news.
Six Markets, Six Different Reactions: The Same-Day Divergence Behind September 9's Headlines
September 9, 2026
View chart & download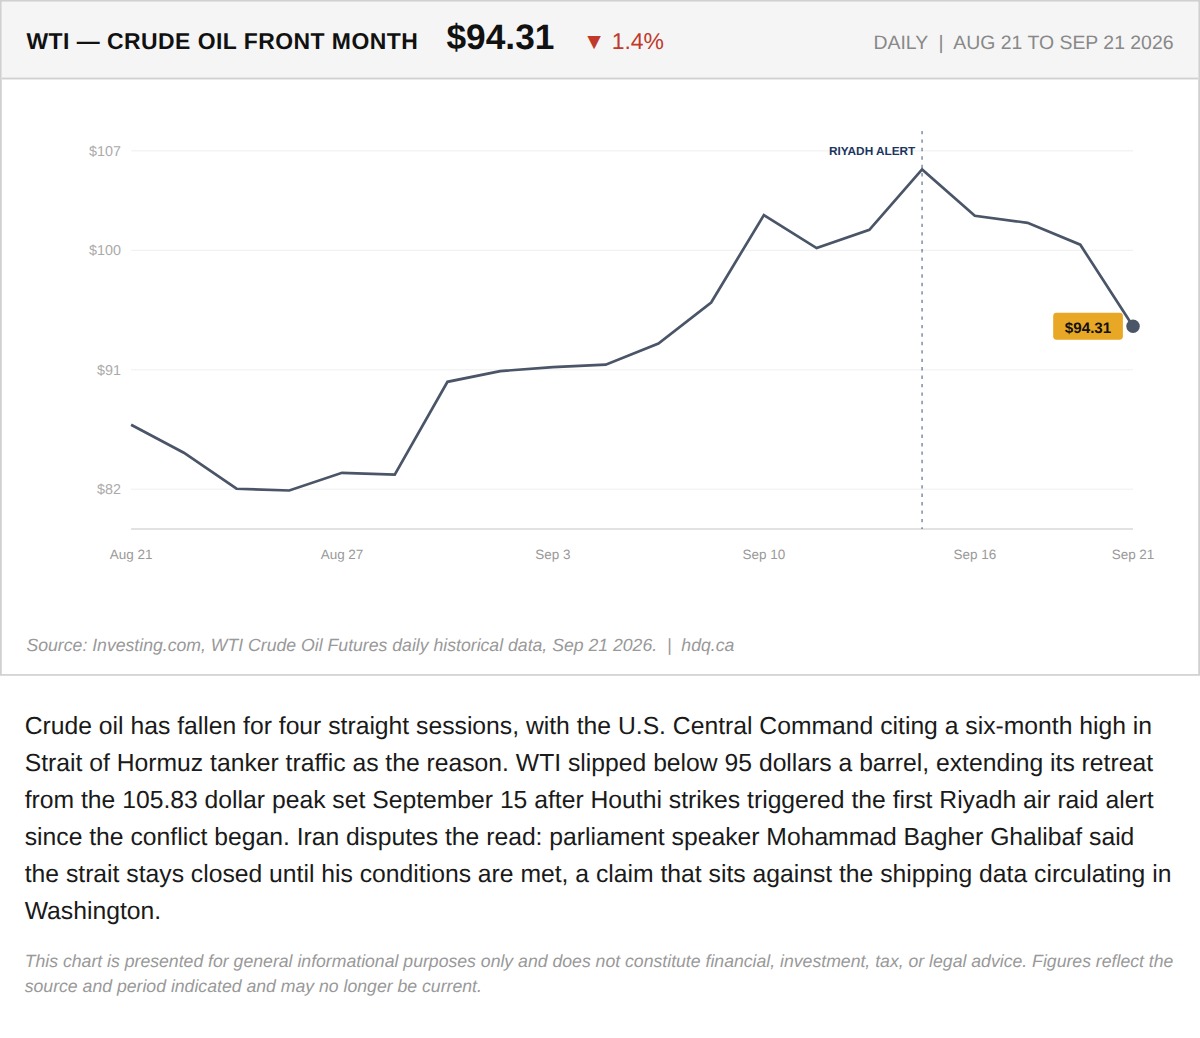
Crude oil has fallen for four straight sessions, with the U.S.
Oil Falls for a Fourth Session as Hormuz Shipping Data Is Disputed
September 21, 2026
View chart & download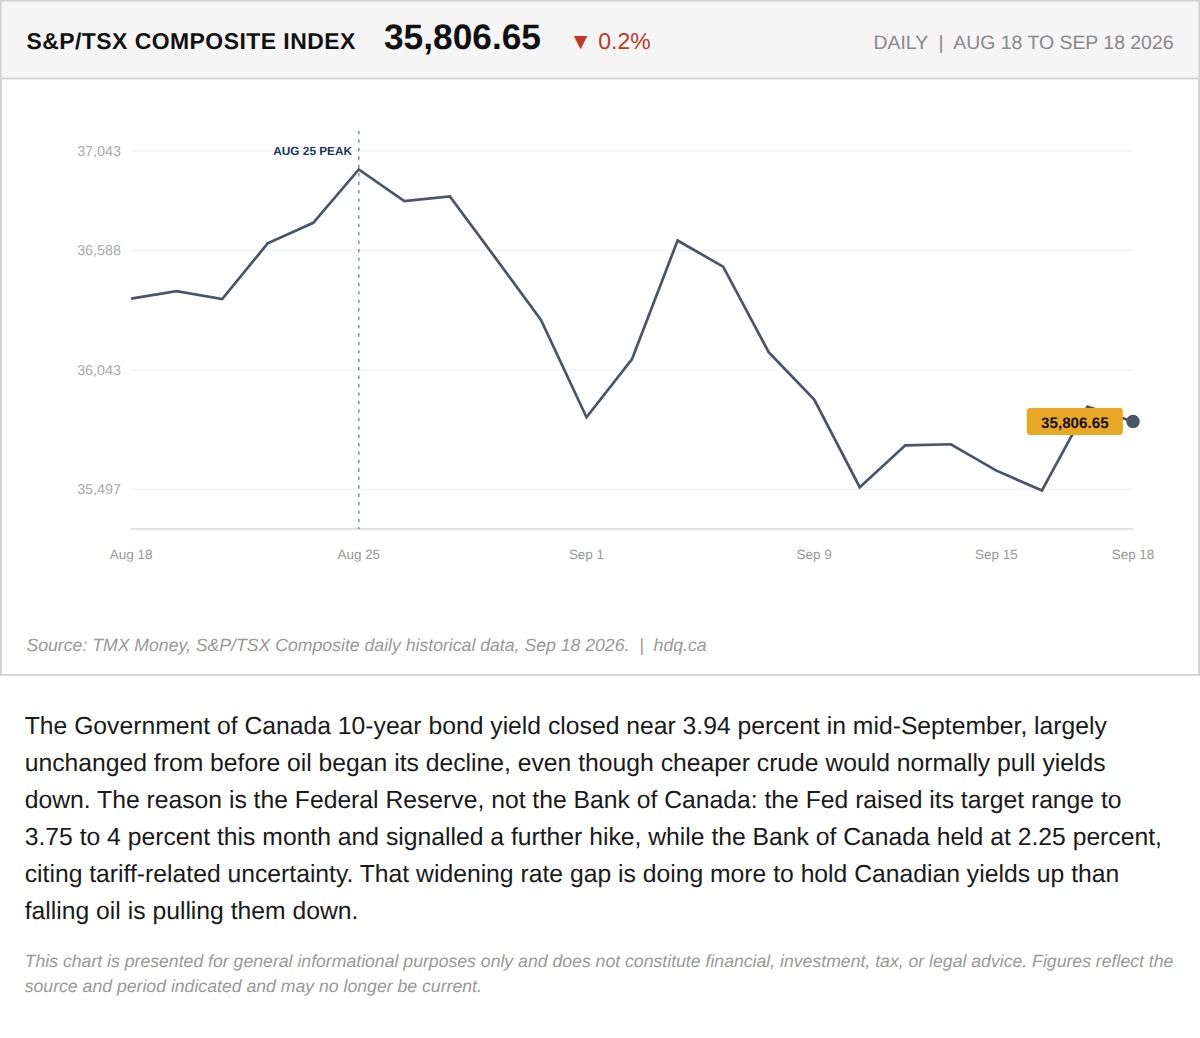
The Government of Canada 10-year bond yield closed near 3.94 percent in mid-September, largely unchanged from before oil began its decline,…
TSX Slides as Canadian Bond Yields Stay Elevated Despite Falling Oil
September 21, 2026
View chart & download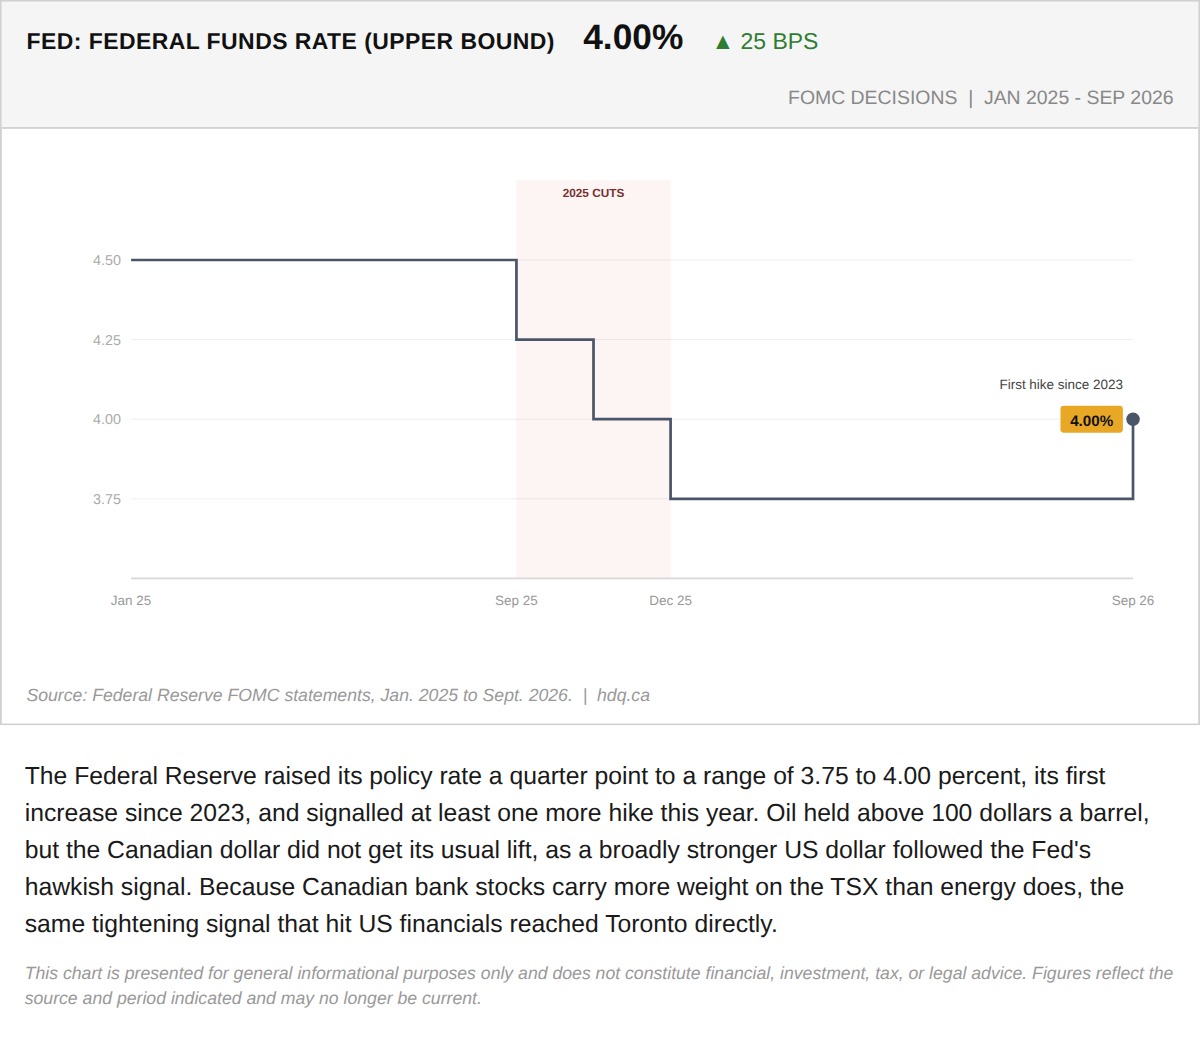
The Federal Reserve raised its policy rate a quarter point to a range of 3.75 to 4.00 percent, its first increase since 2023, and signalled at least one more hike this year.
The Fed's Hawkish Hike Broke the Loonie's Oil Shield the Same Day Ottawa Leaned on Europe
September 16, 2026
View chart & download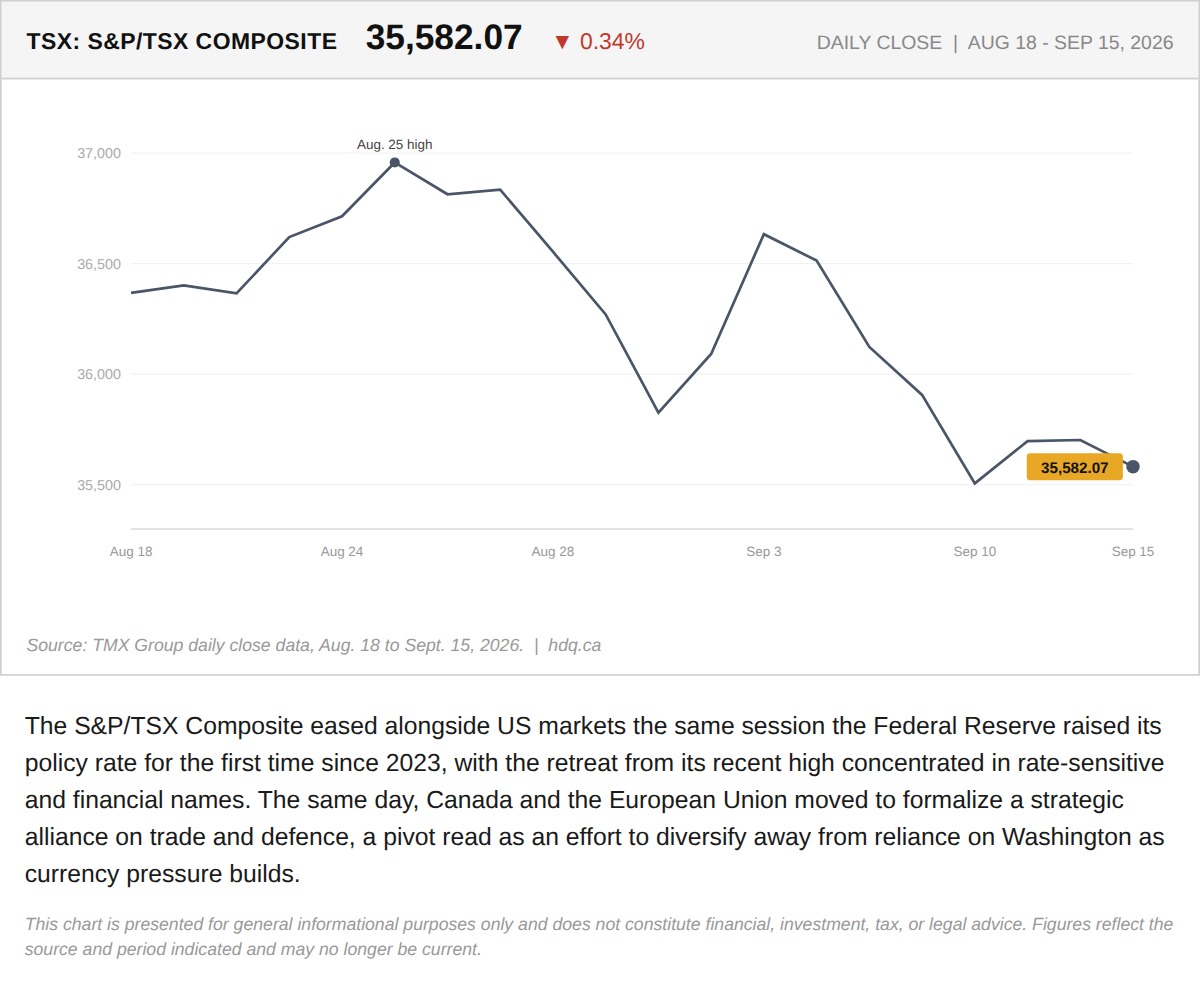
The S&P/TSX Composite eased alongside US markets the same session the Federal Reserve raised its policy rate for the first time since 2023,…
The Fed's Hawkish Hike Broke the Loonie's Oil Shield the Same Day Ottawa Leaned on Europe
September 16, 2026
View chart & download