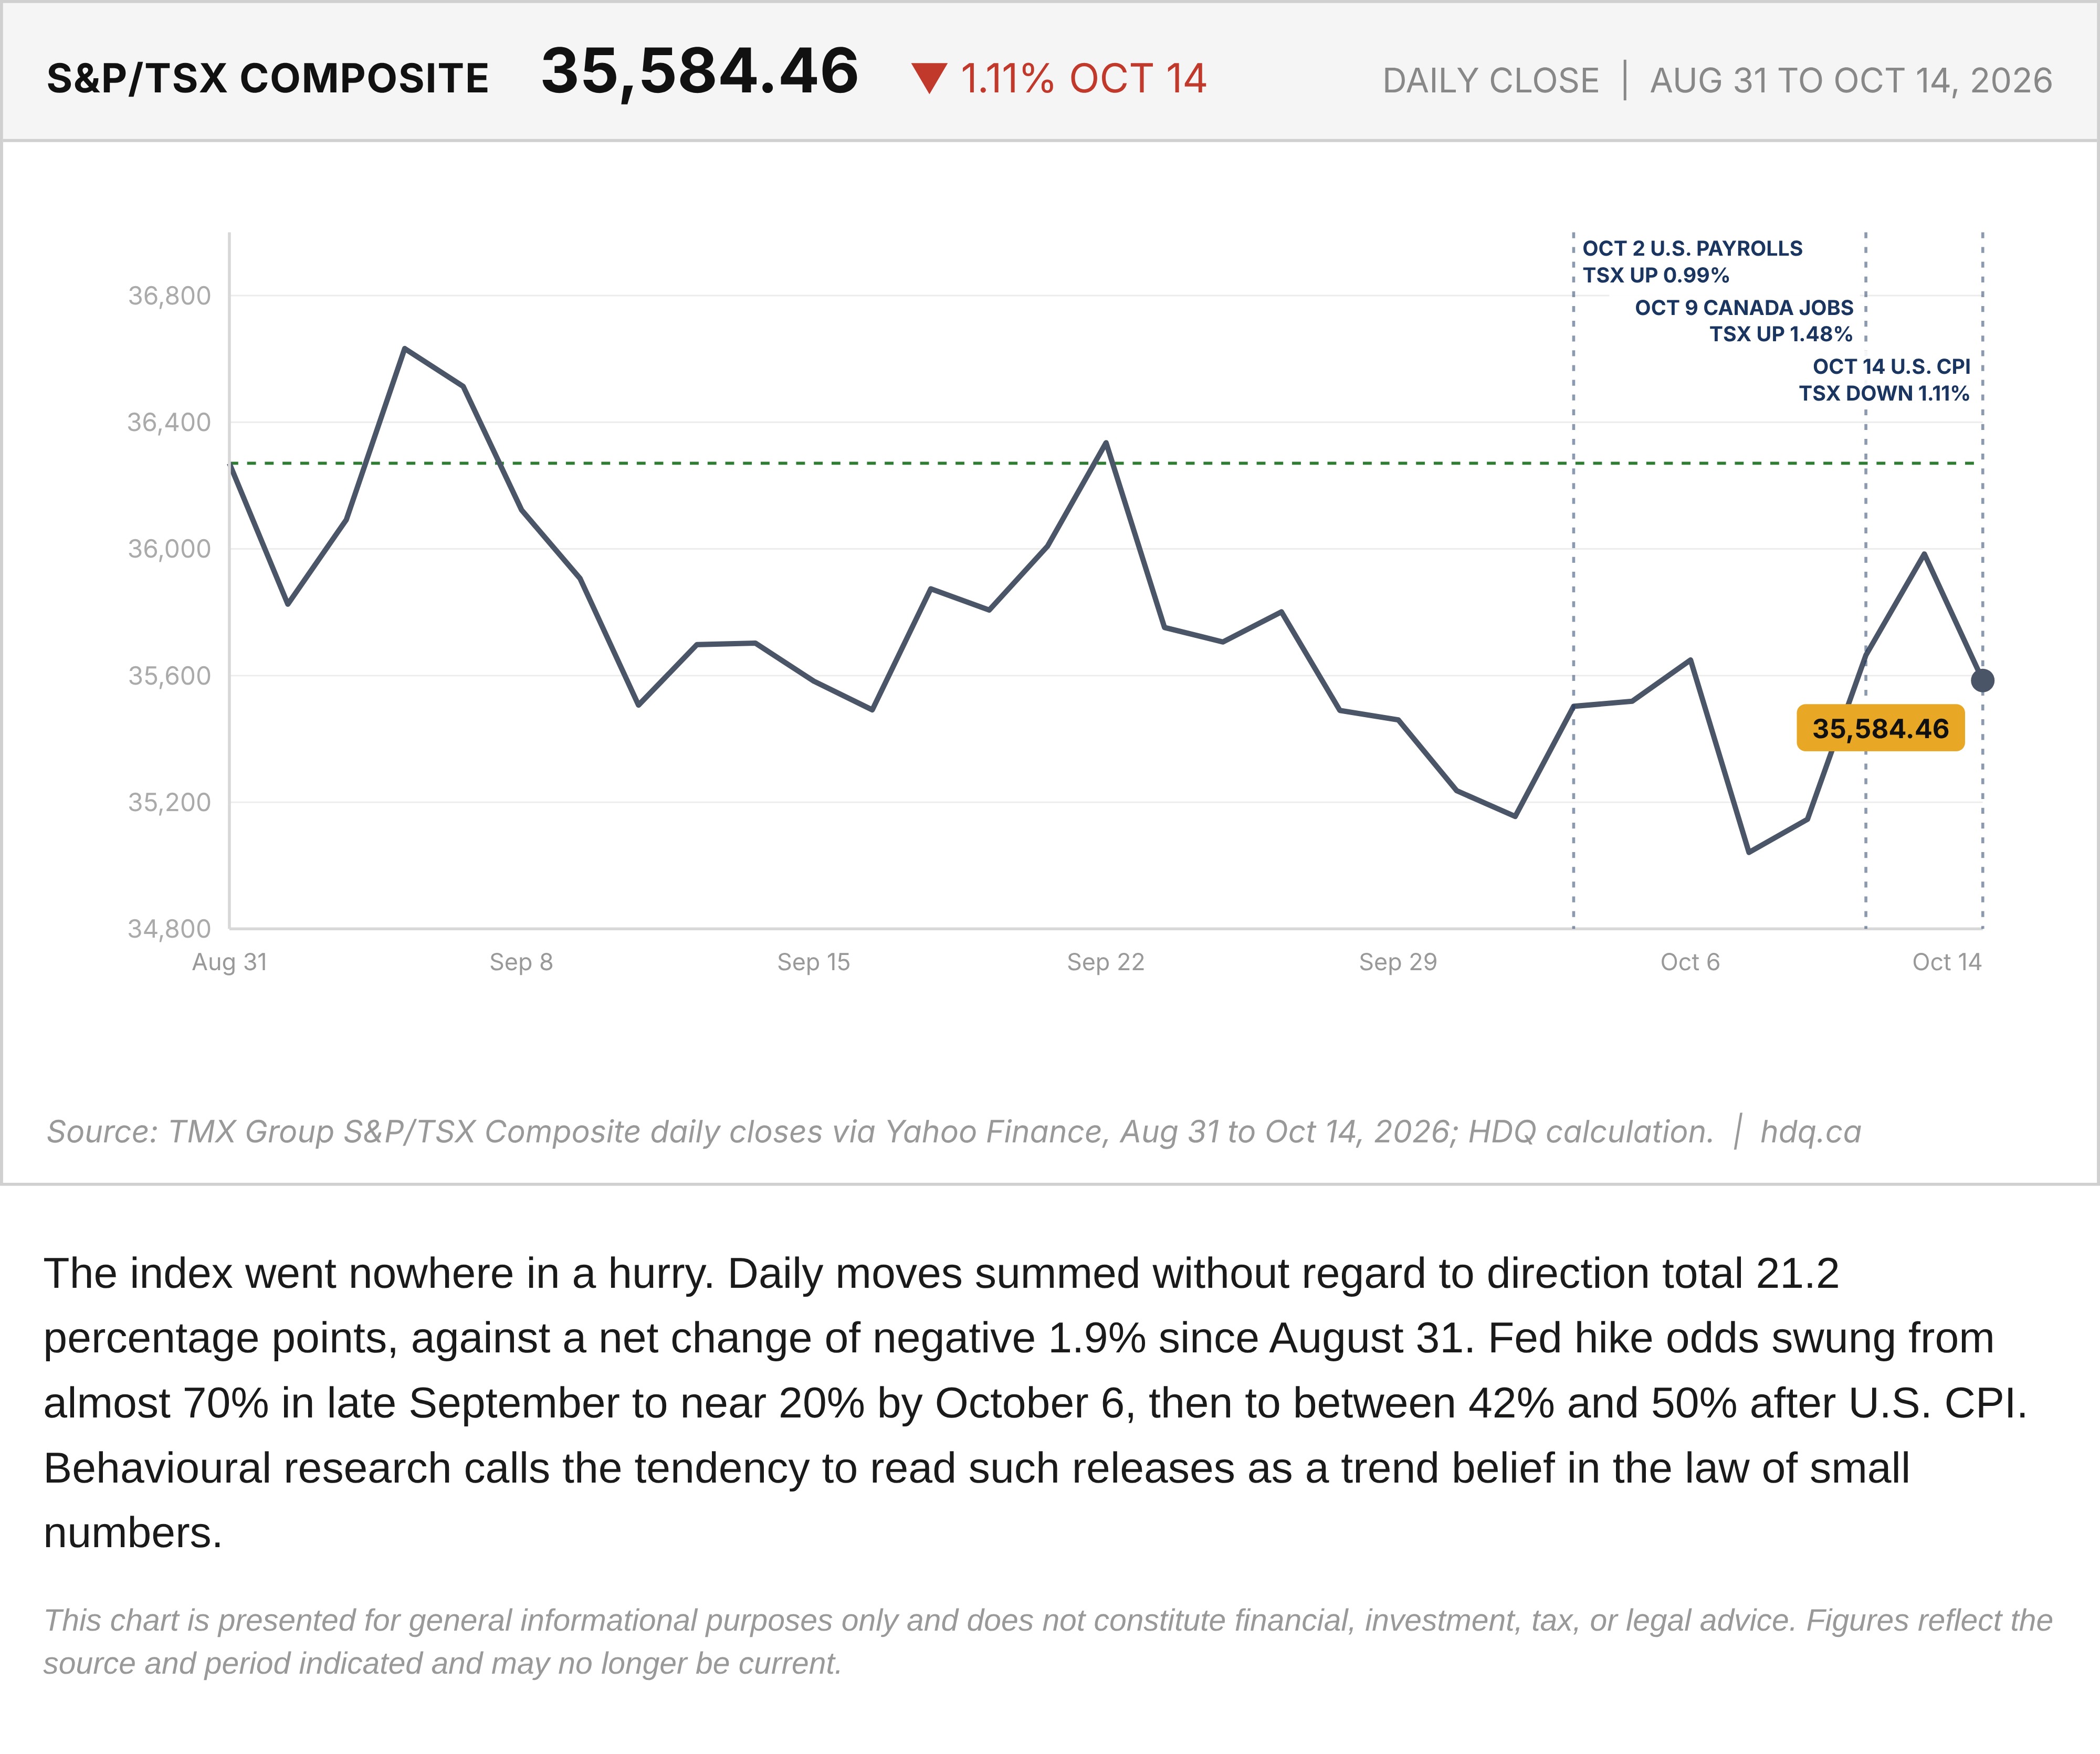
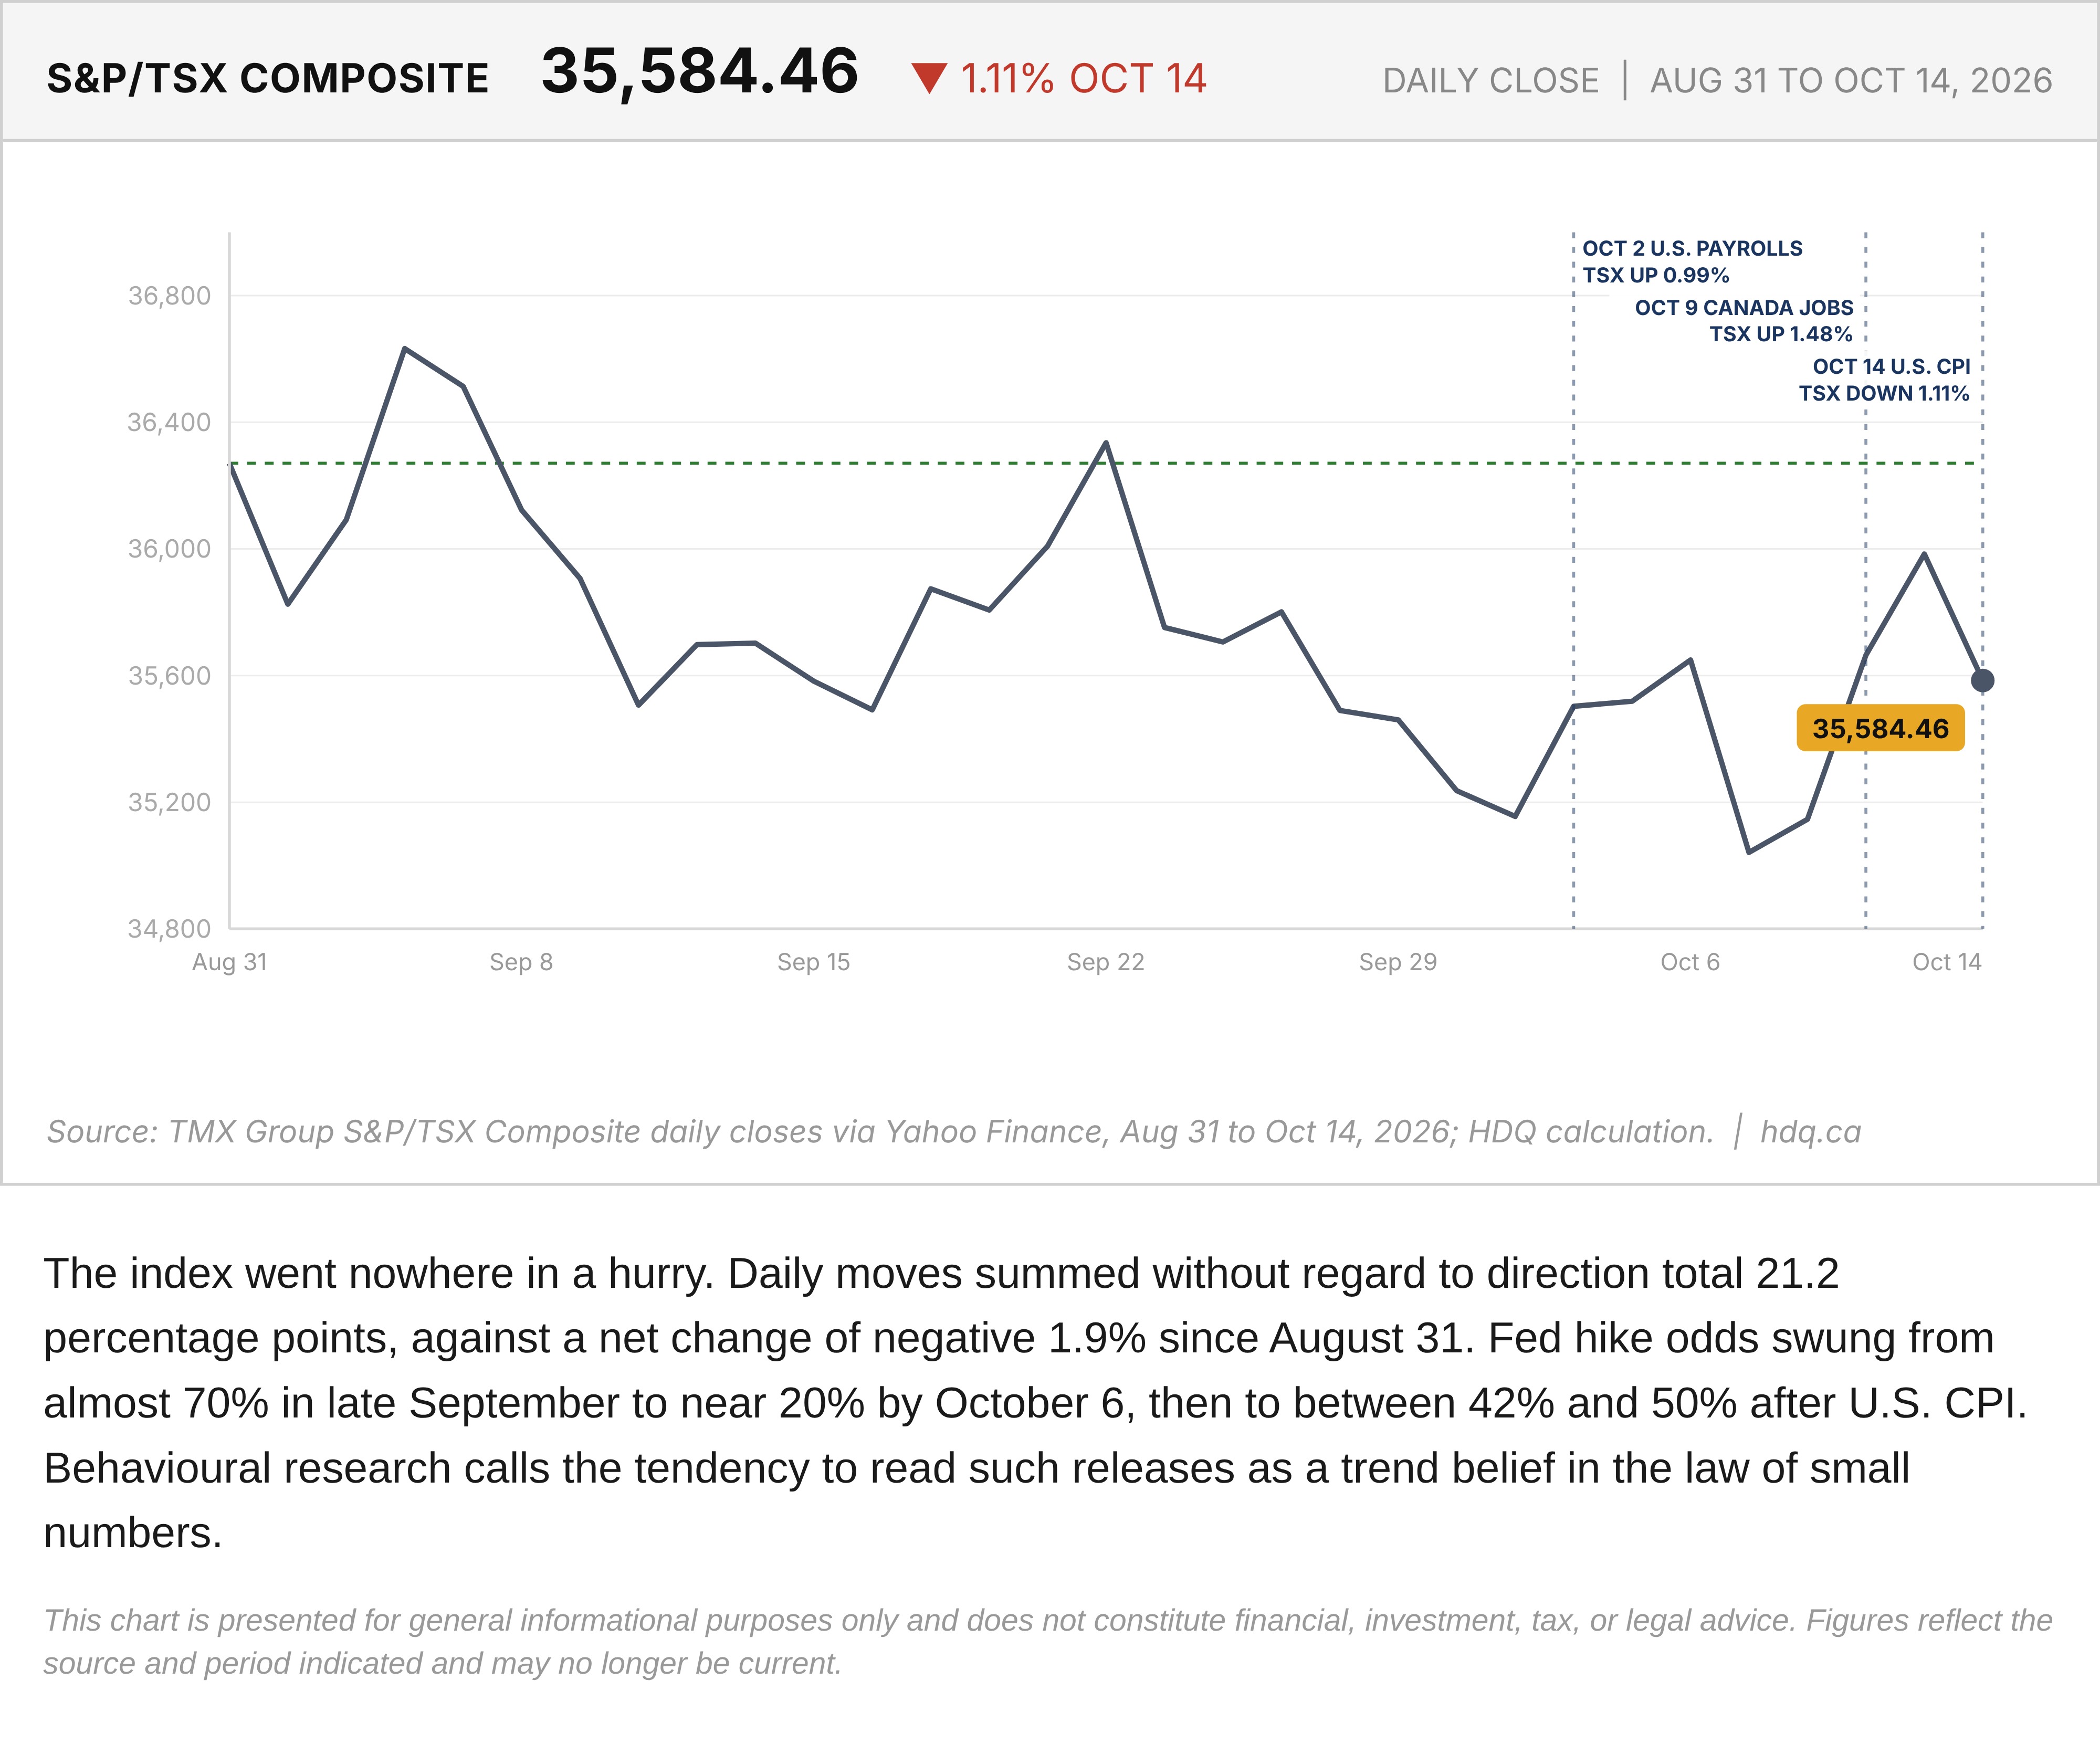
The index went nowhere in a hurry. Daily moves summed without regard to direction total 21.2 percentage points, against a net change of negative 1.9% since August 31. Fed hike odds swung from almost 70% in late September to near 20% by October 6, then to between 42% and 50% after U.S. CPI. Behavioural research calls the tendency to read such releases as a trend belief in the law of small numbers.
This chart is presented for general informational purposes only and does not constitute financial, investment, tax, or legal advice. Figures reflect the source and period indicated and may no longer be current.
Related charts
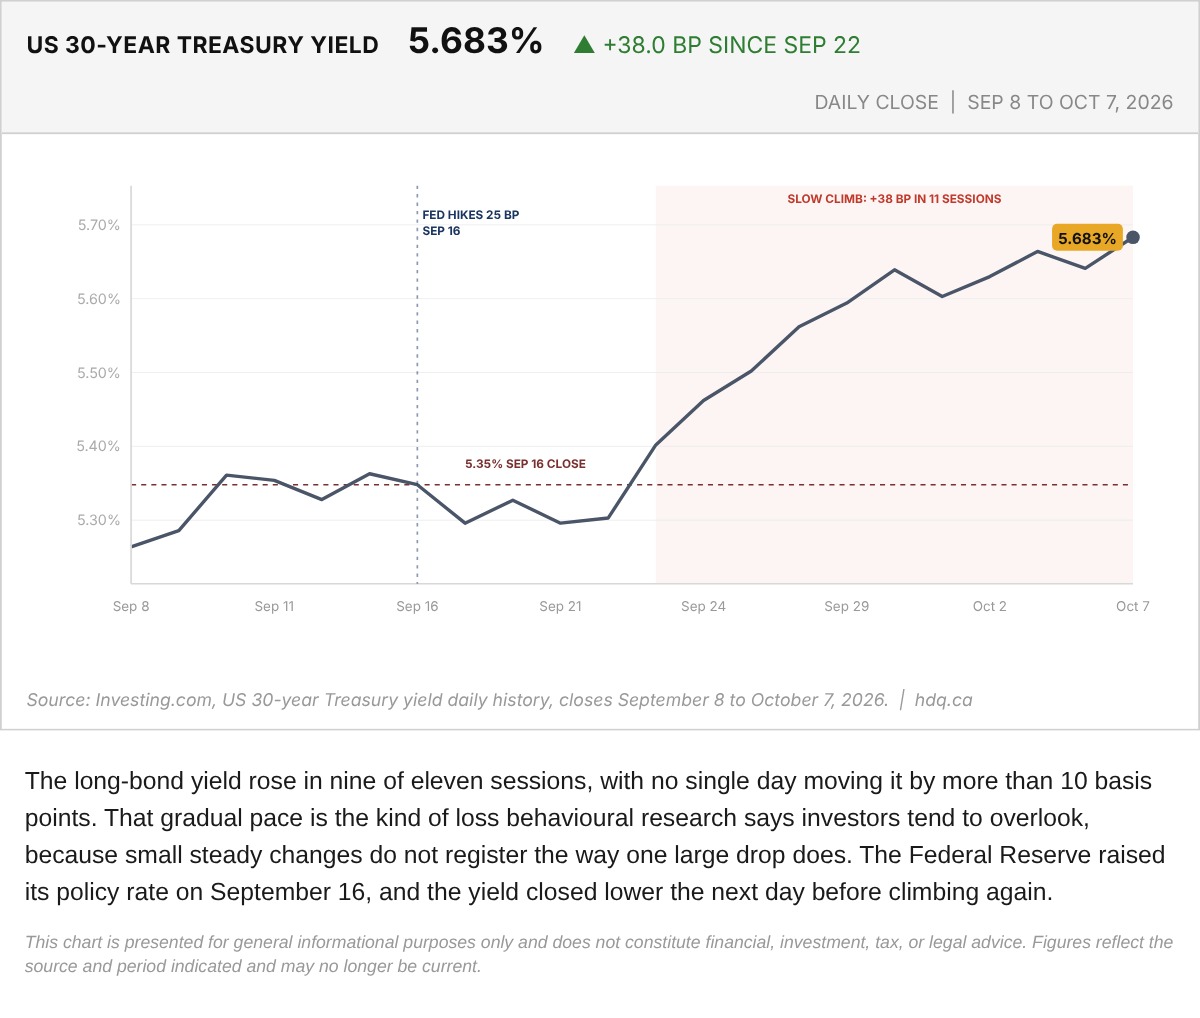
The long-bond yield rose in nine of eleven sessions, with no single day moving it by more than 10 basis points.
US 30-Year Treasury Yield Daily Close, September 8 to October 7
October 8, 2026
View chart & download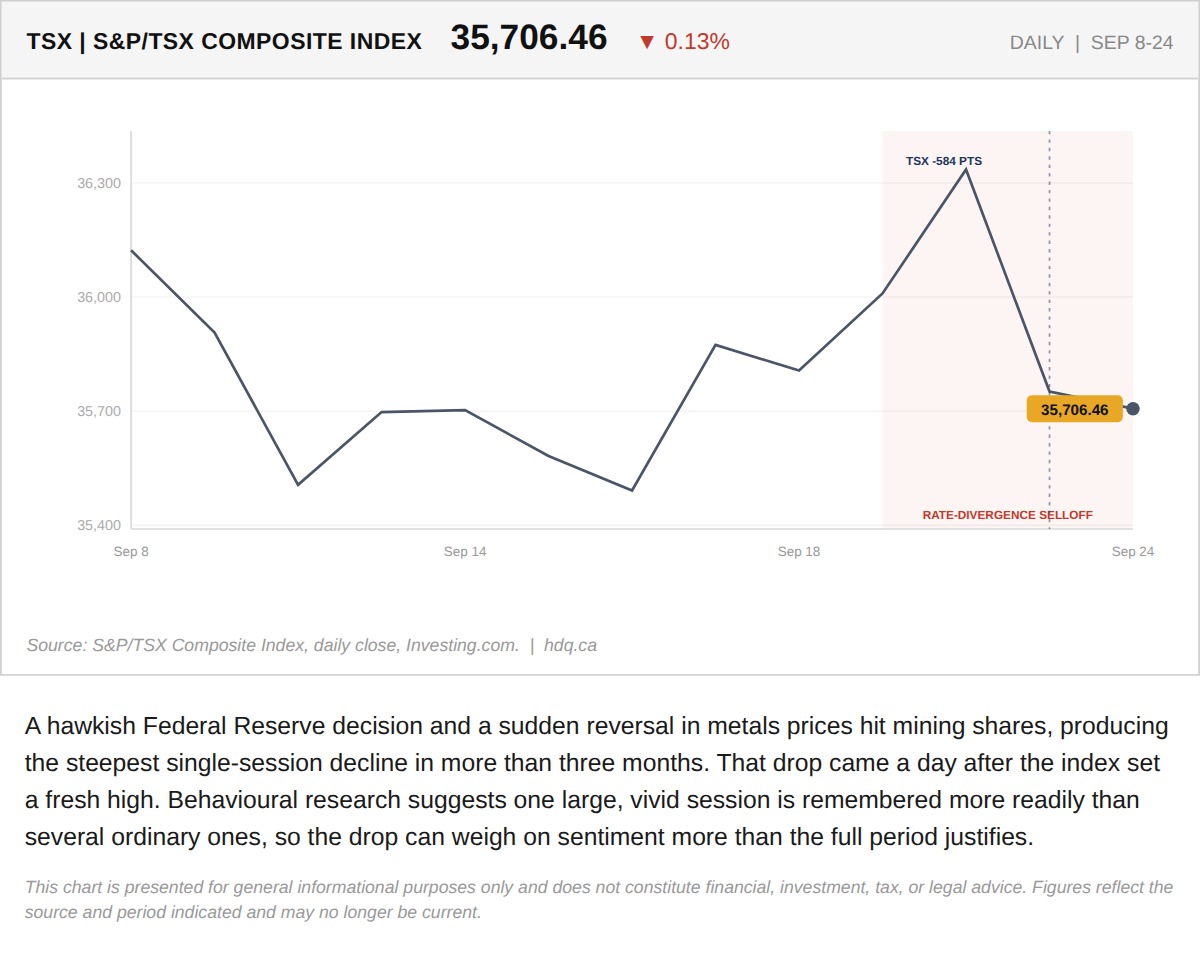
A hawkish Federal Reserve decision and a sudden reversal in metals prices hit mining shares, producing the steepest single-session decline in more than three months.
TSX Drops Sharply Midweek Amid Rate Divergence
September 25, 2026
View chart & download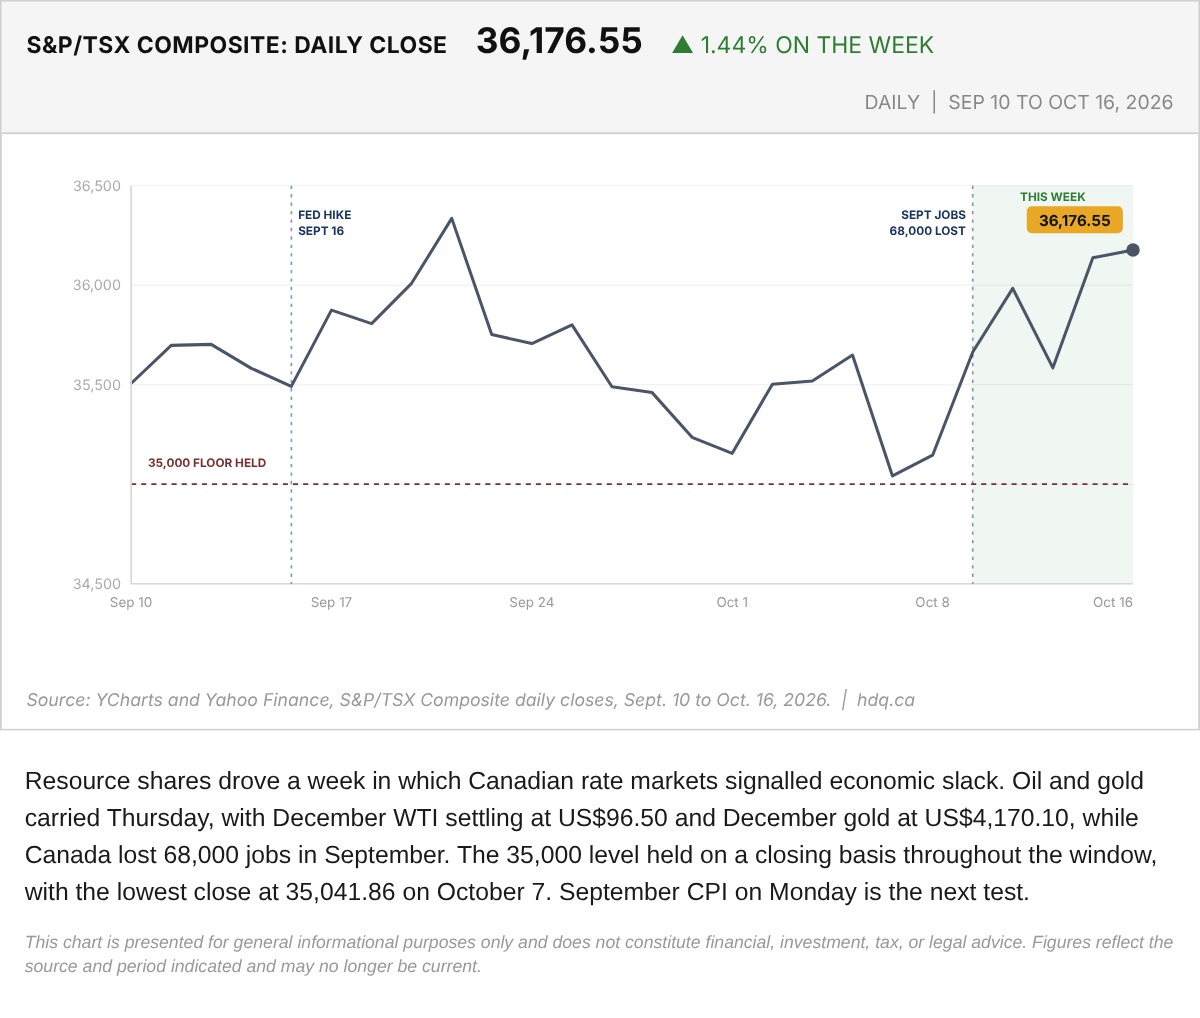
Resource shares drove a week in which Canadian rate markets signalled economic slack.
S&P/TSX Composite Daily Close, September 10 to October 16, 2026
October 16, 2026
View chart & download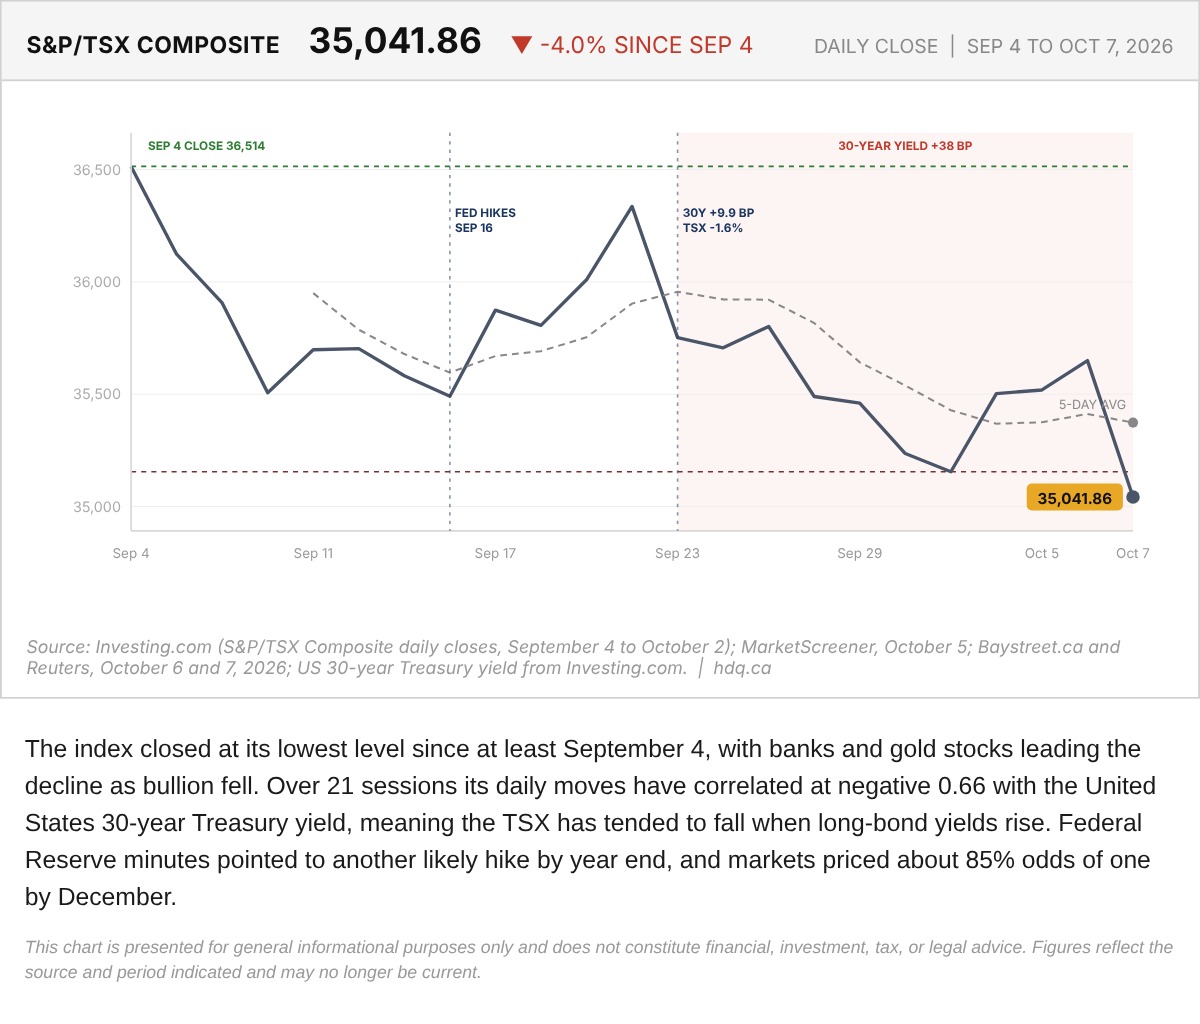
The index closed at its lowest level since at least September 4, with banks and gold stocks leading the decline as bullion fell.
S&P/TSX Composite With Five-Session Average, September 4 to October 7
October 8, 2026
View chart & download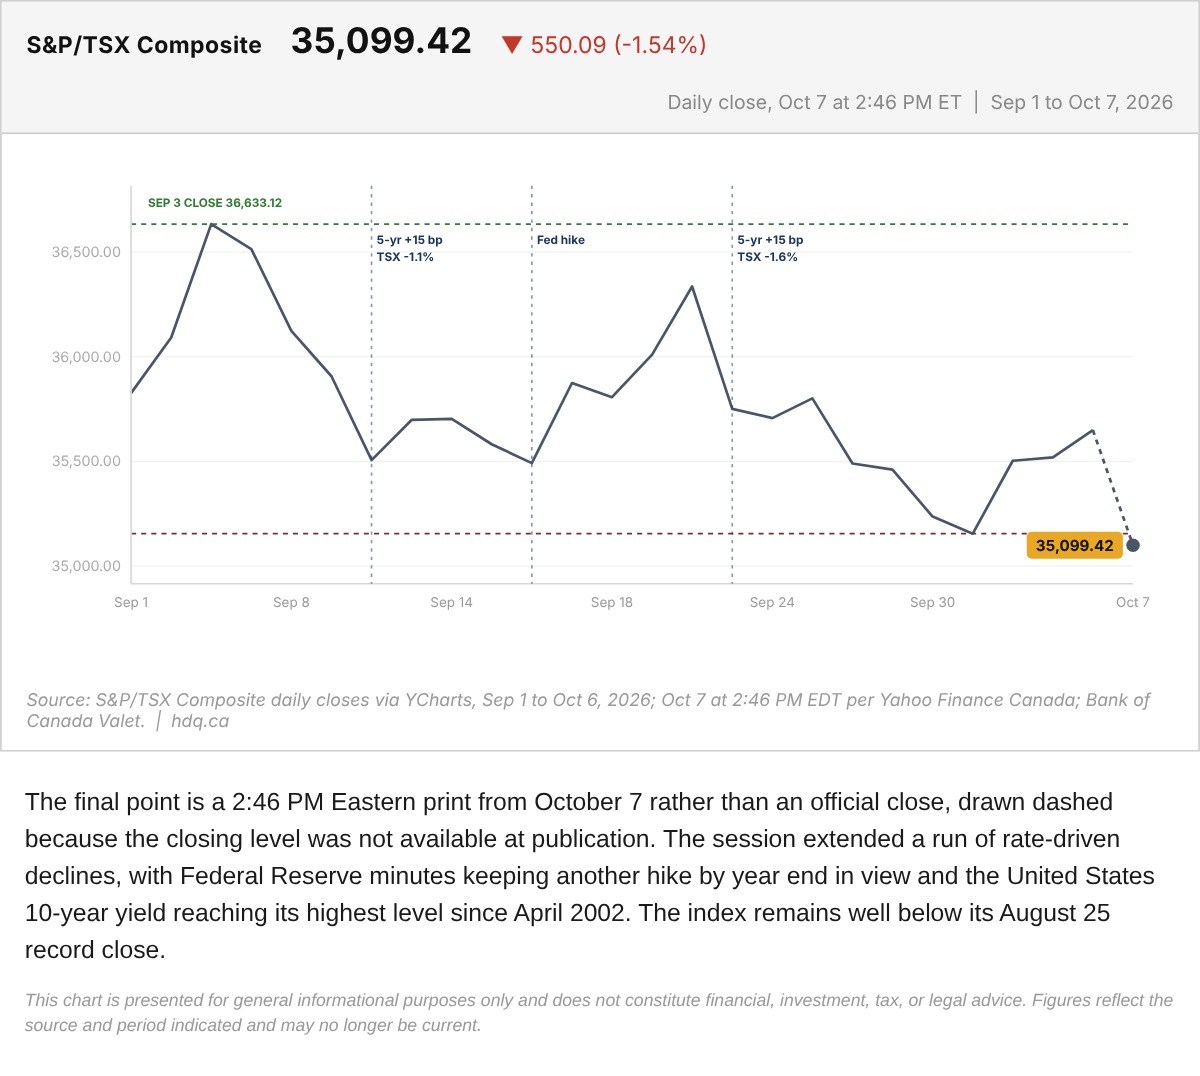
The final point is a 2:46 PM Eastern print from October 7 rather than an official close, drawn dashed because the closing level was not available at publication.
S&P/TSX Composite With the October 7 Midday Print
October 7, 2026
View chart & download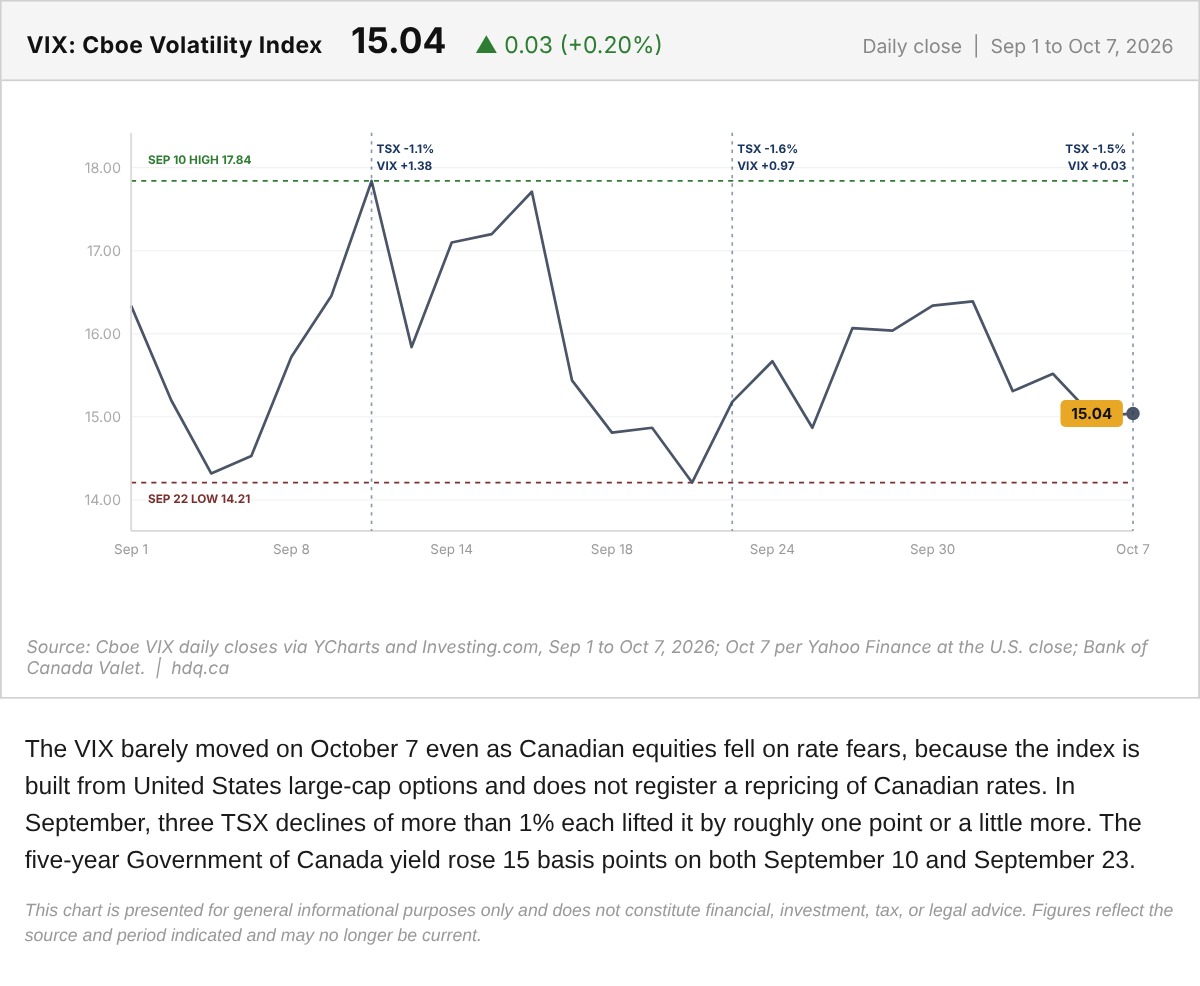
The VIX barely moved on October 7 even as Canadian equities fell on rate fears, because the index is built from United States large-cap…
VIX Daily Close on the Day Rate Fear Hit the TSX
October 7, 2026
View chart & download