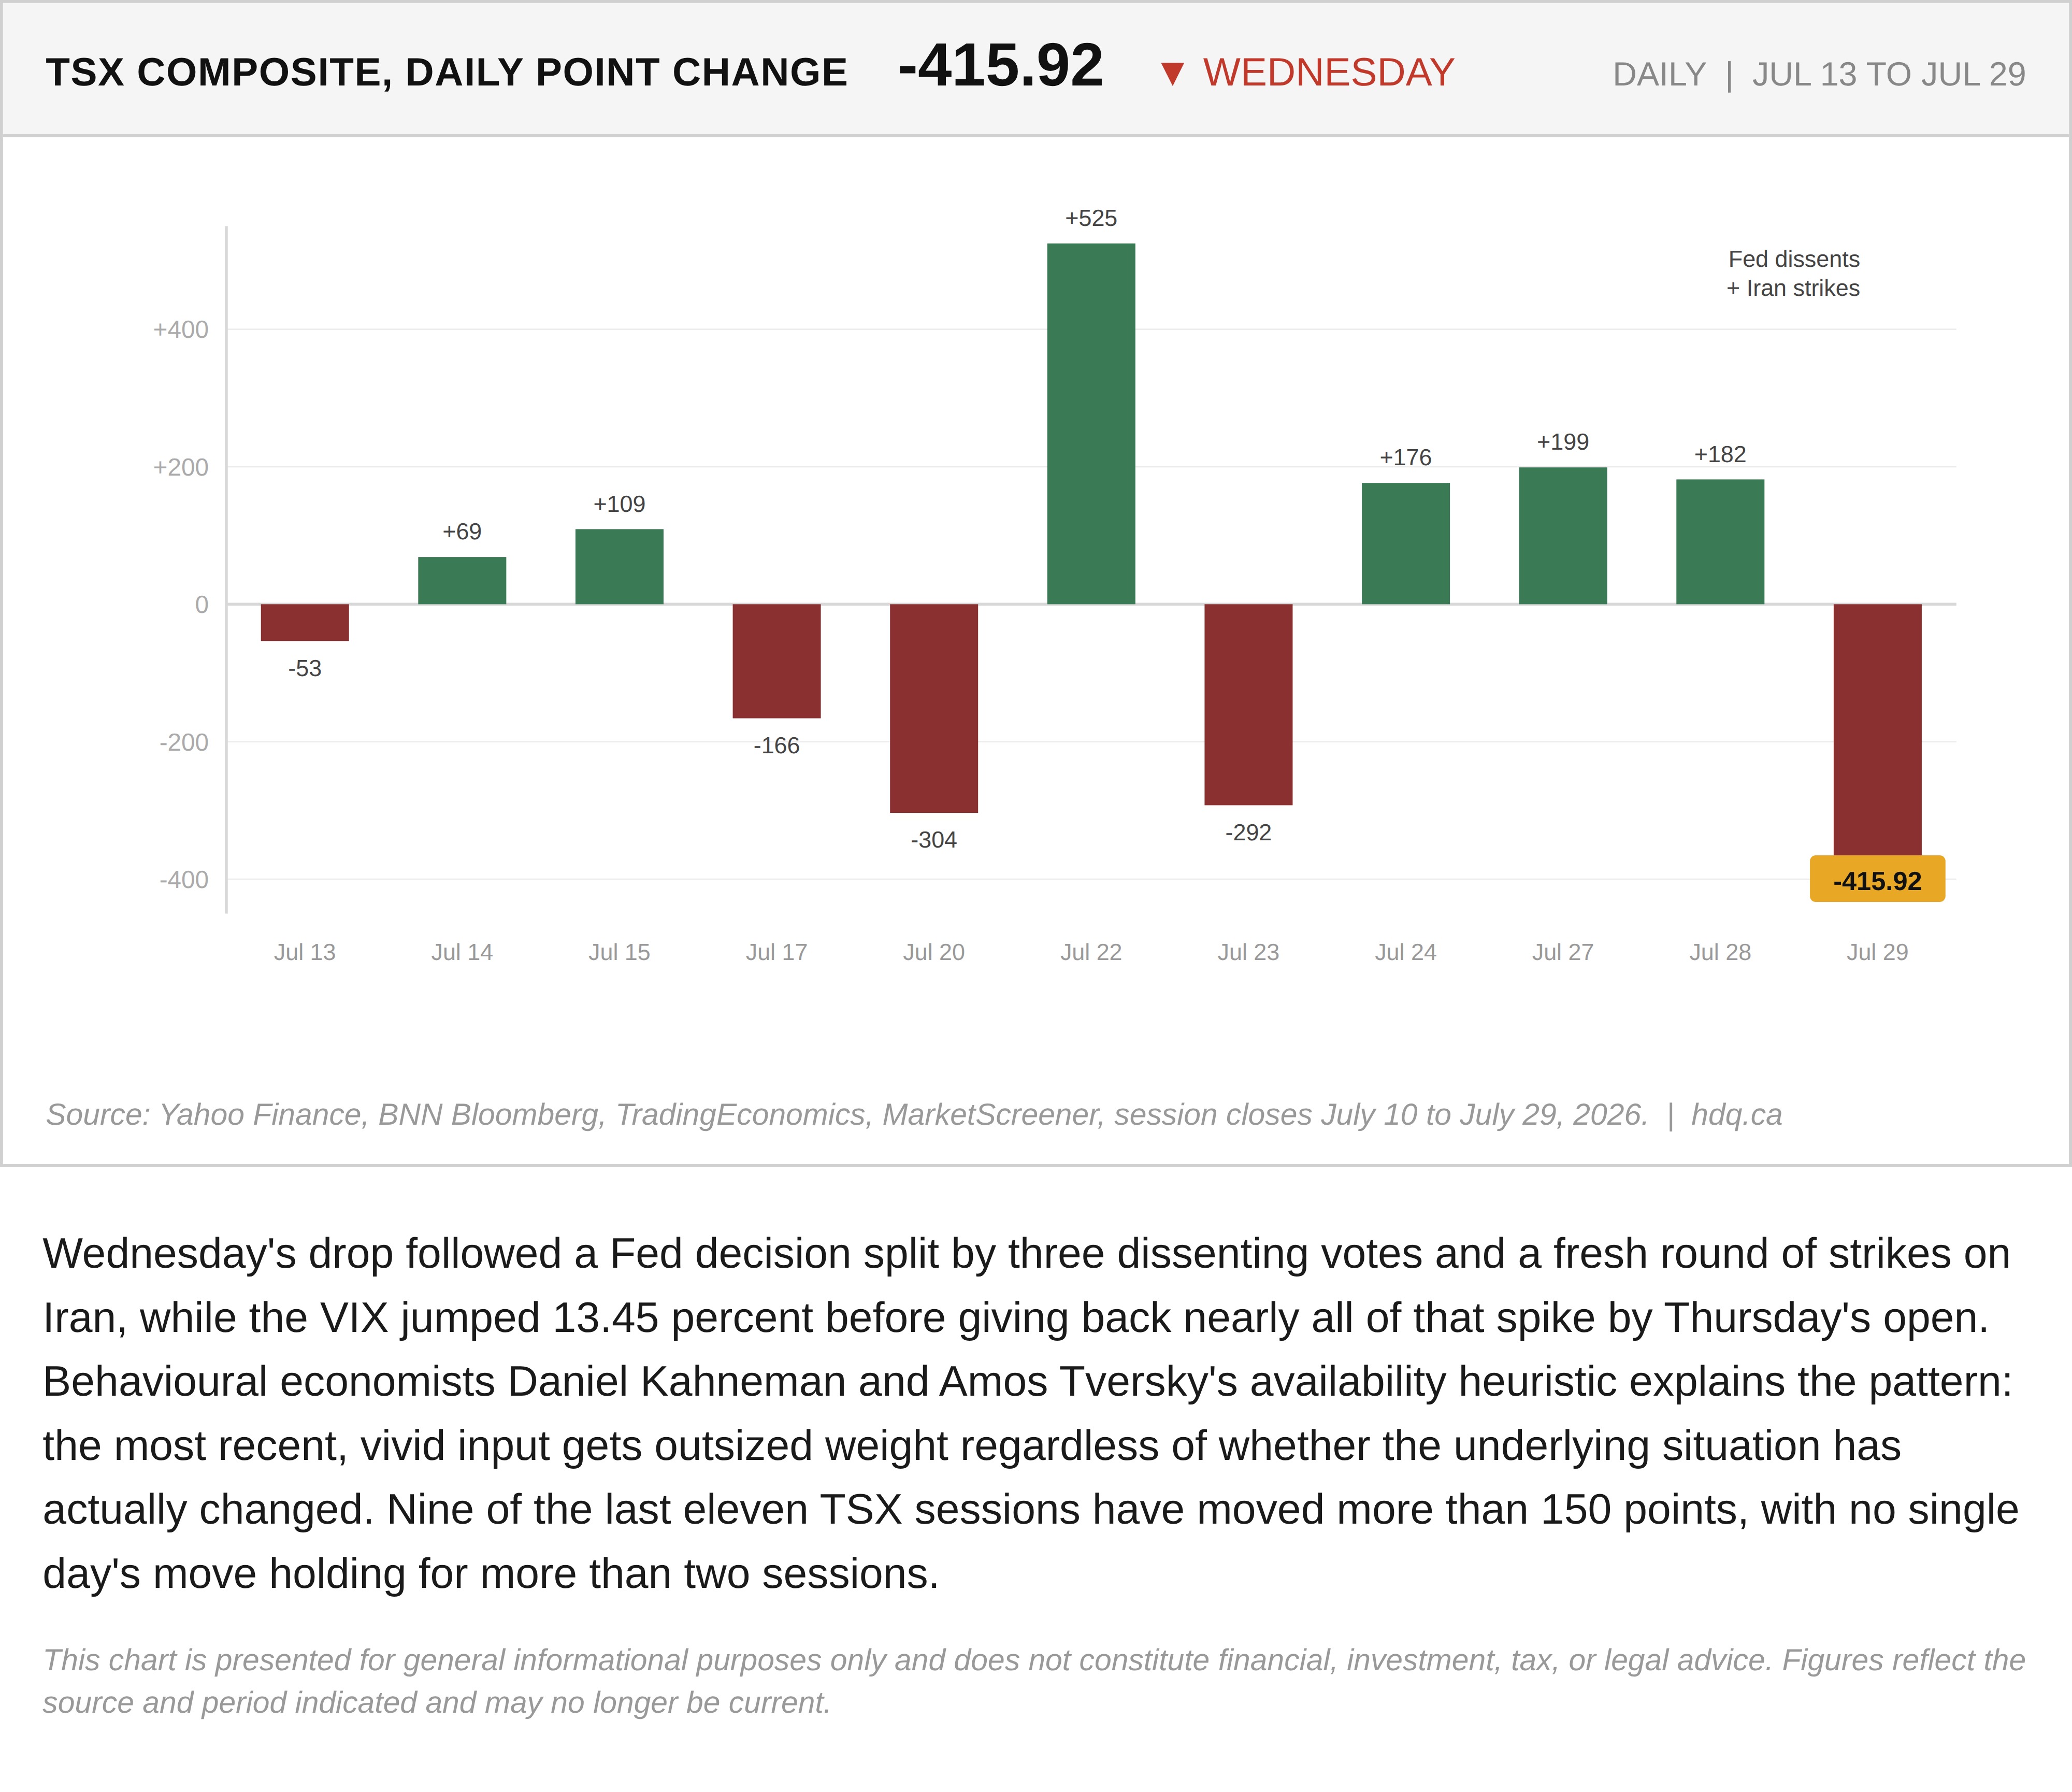
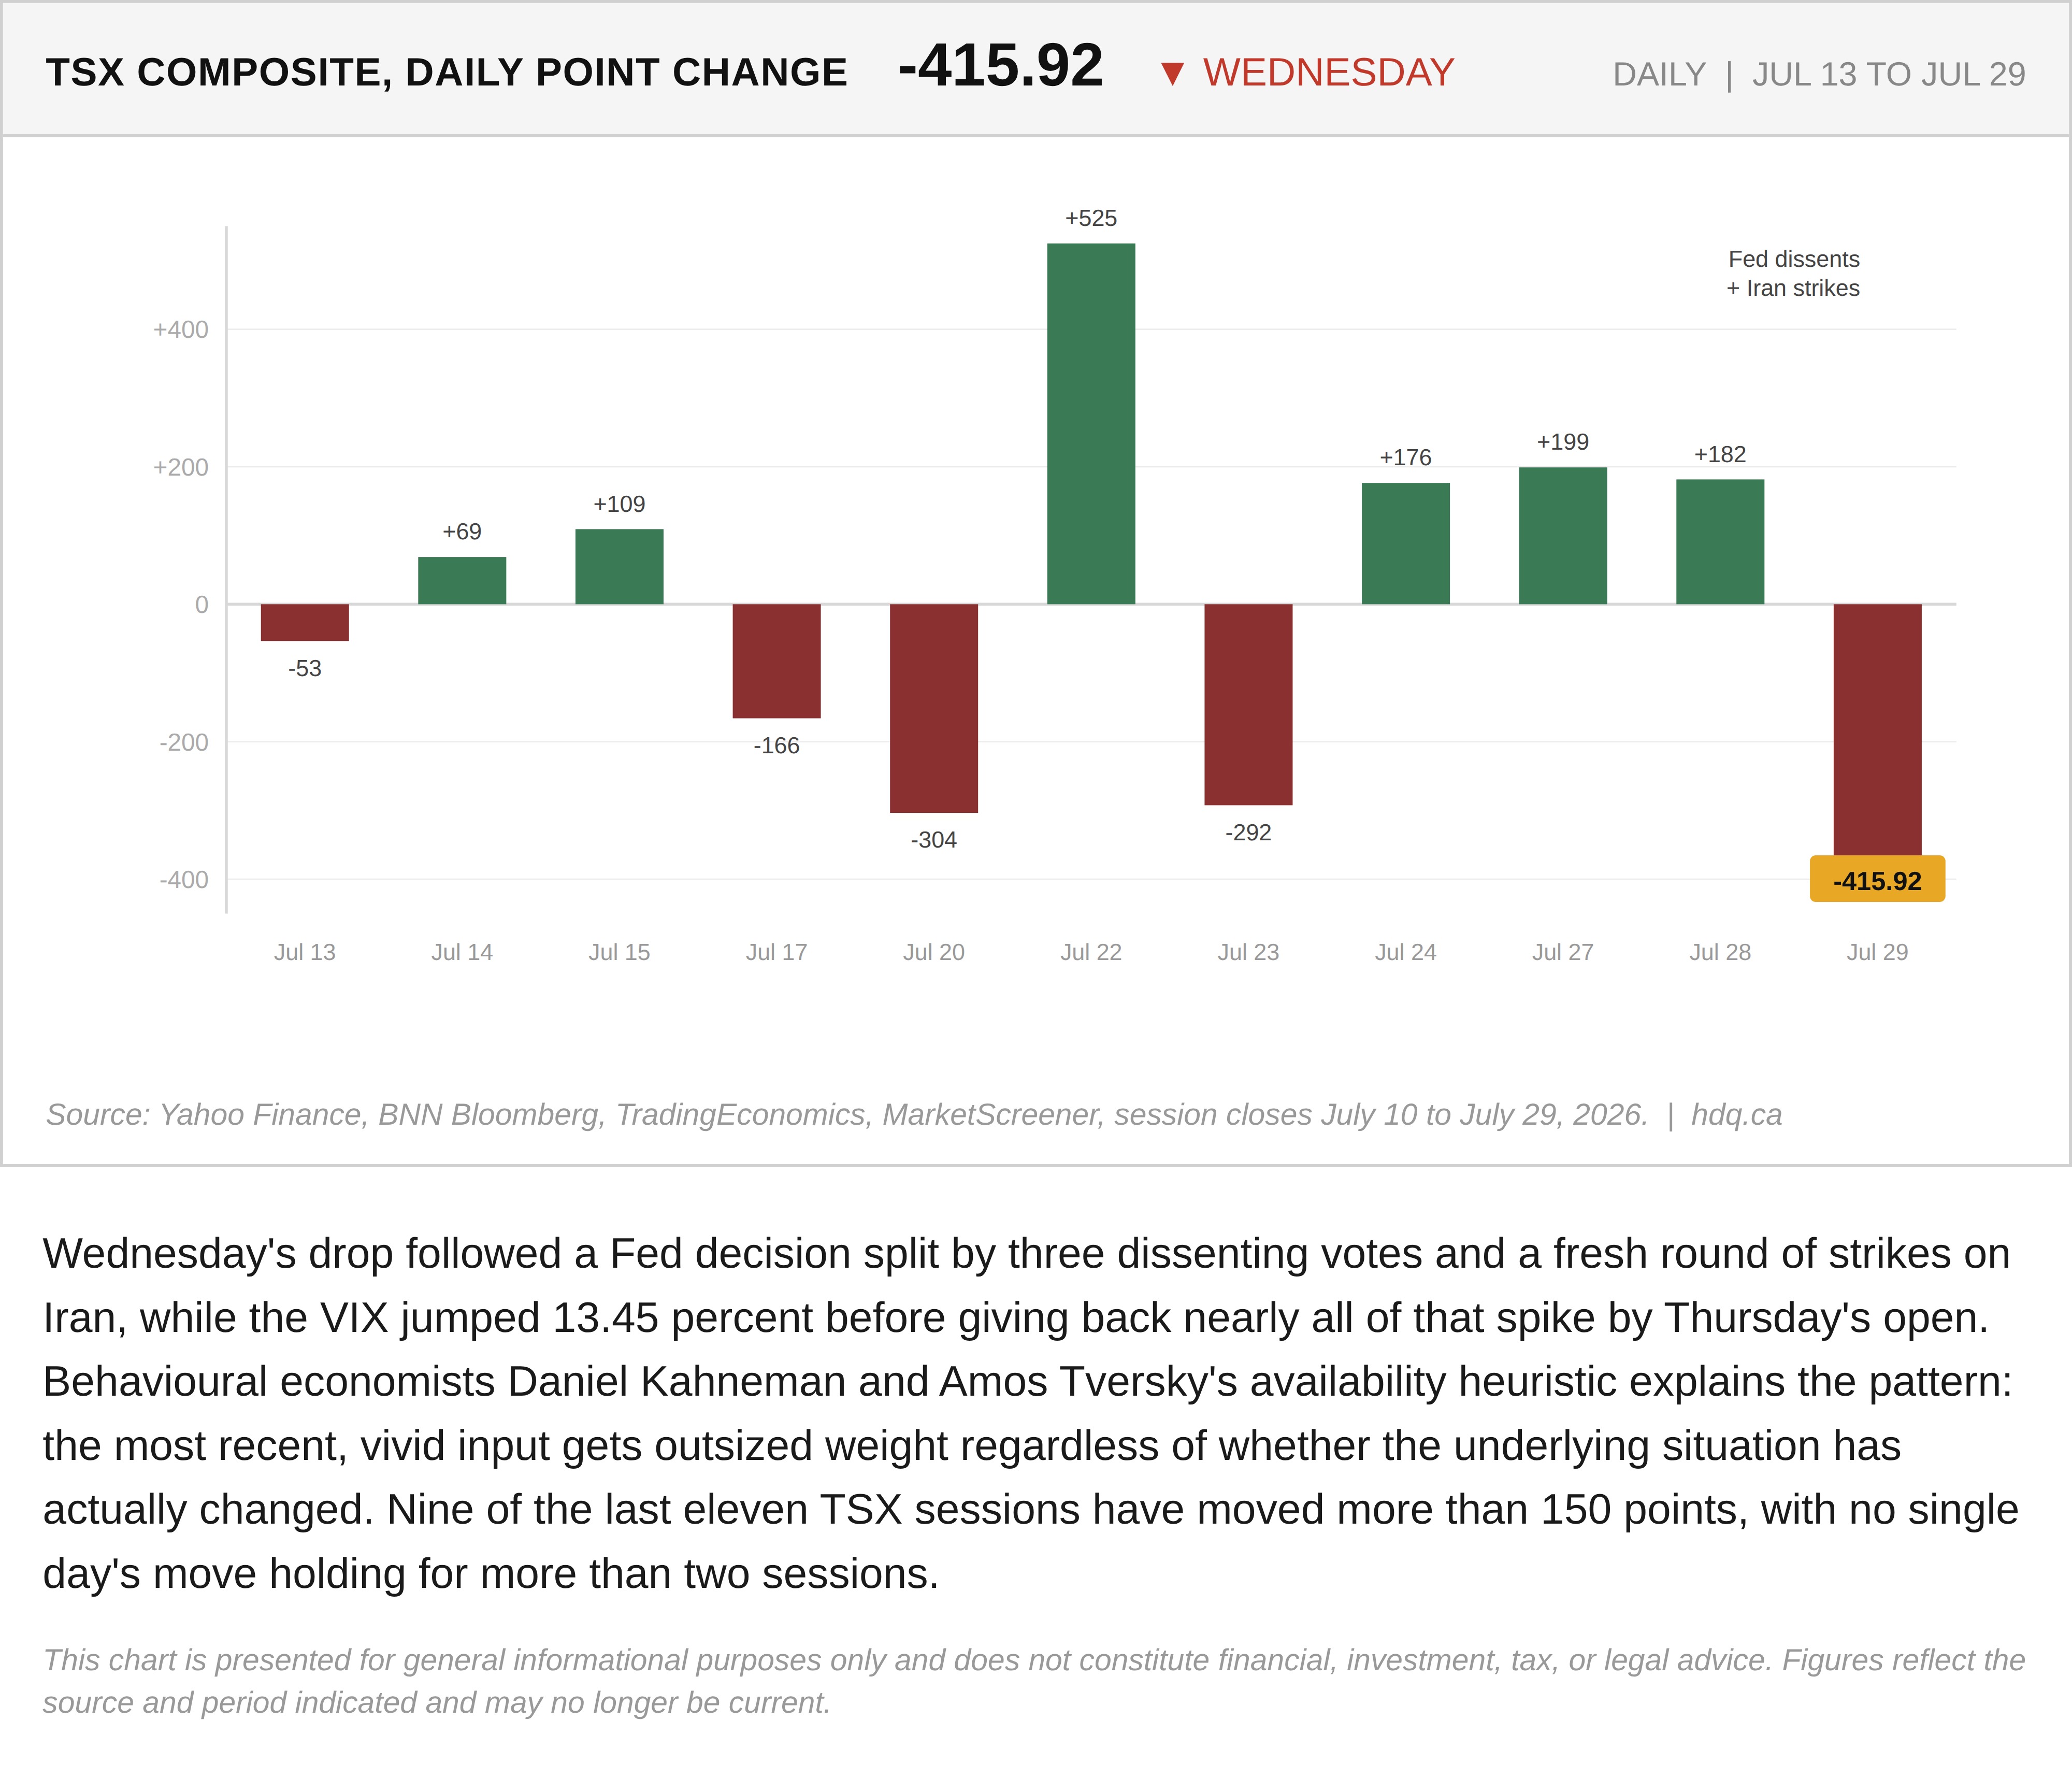
Wednesday's drop followed a Fed decision split by three dissenting votes and a fresh round of strikes on Iran, while the VIX jumped 13.45 percent before giving back nearly all of that spike by Thursday's open. Behavioural economists Daniel Kahneman and Amos Tversky's availability heuristic explains the pattern: the most recent, vivid input gets outsized weight regardless of whether the underlying situation has actually changed. Nine of the last eleven TSX sessions have moved more than 150 points, with no single day's move holding for more than two sessions.
This chart is presented for general informational purposes only and does not constitute financial, investment, tax, or legal advice. Figures reflect the source and period indicated and may no longer be current.
Related charts
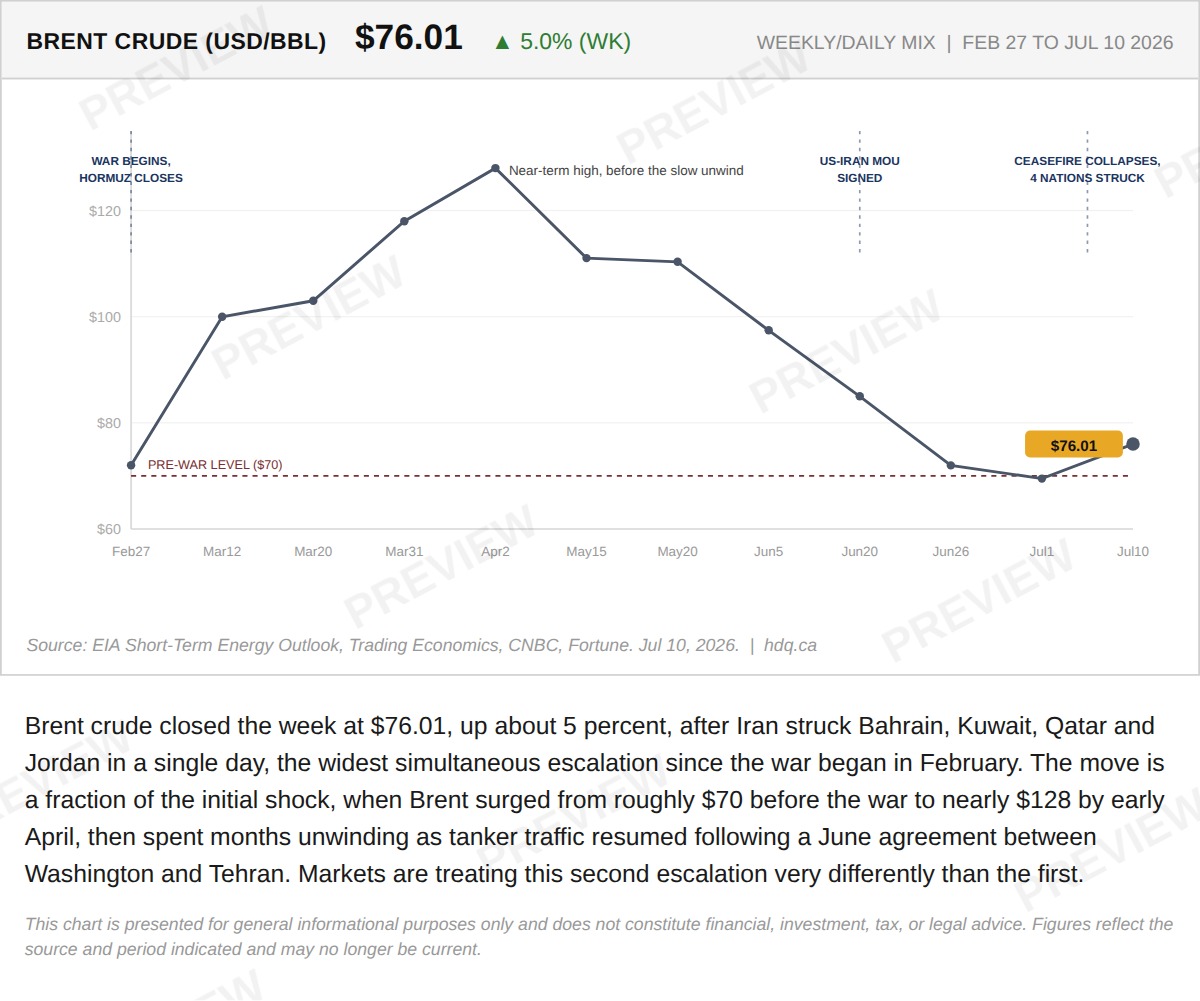
Brent crude closed the week at $76.01, up about 5 percent, after Iran struck Bahrain, Kuwait, Qatar and Jordan in a single day, the widest…
Brent crude gains 5% as Iran strikes widen war to four countries
July 11, 2026
View chart & download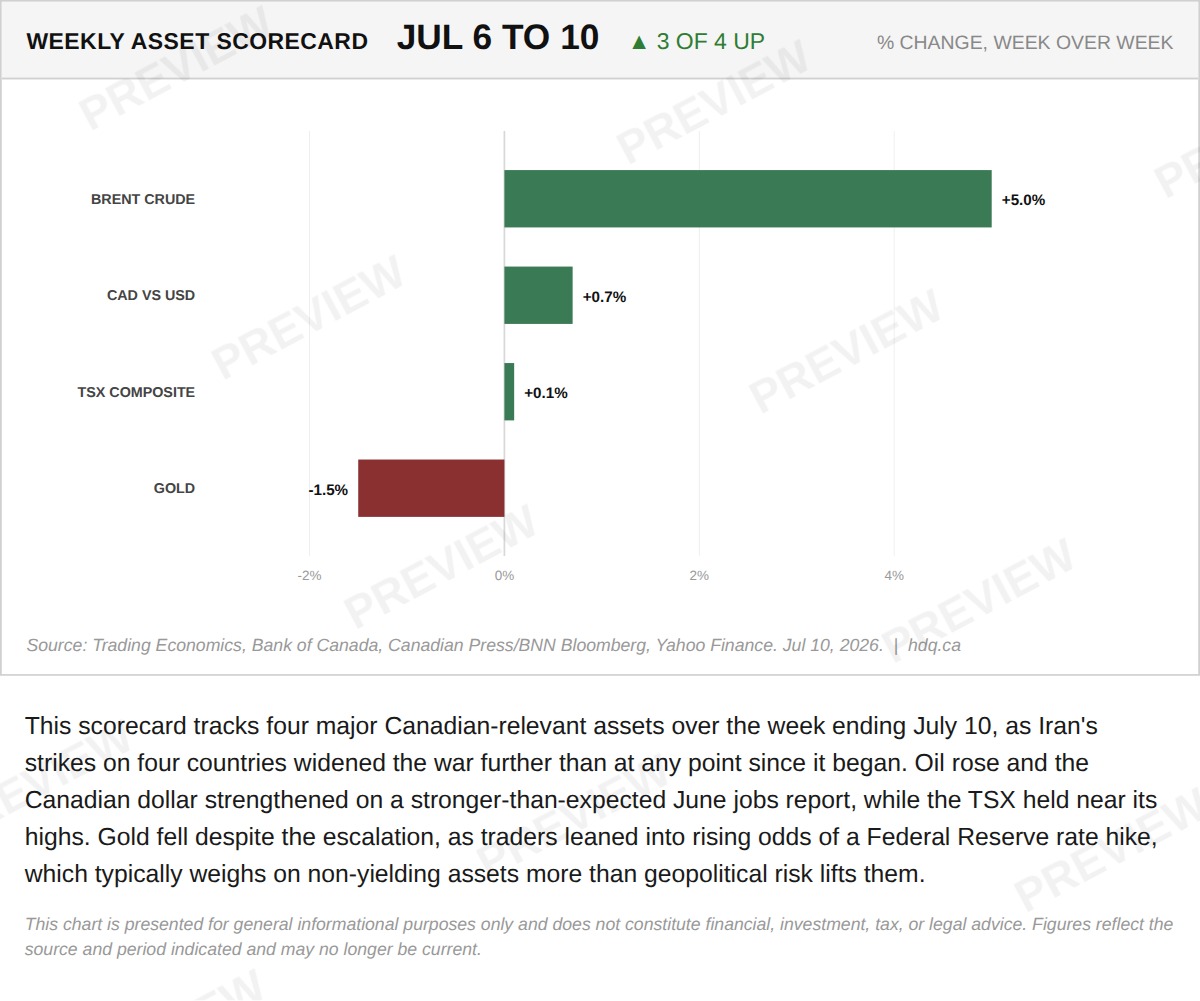
This scorecard tracks four major Canadian-relevant assets over the week ending July 10, as Iran's strikes on four countries widened the war further than at any point since it began.
Weekly scorecard: Brent, CAD and TSX rise as gold falls despite widening war
July 11, 2026
View chart & download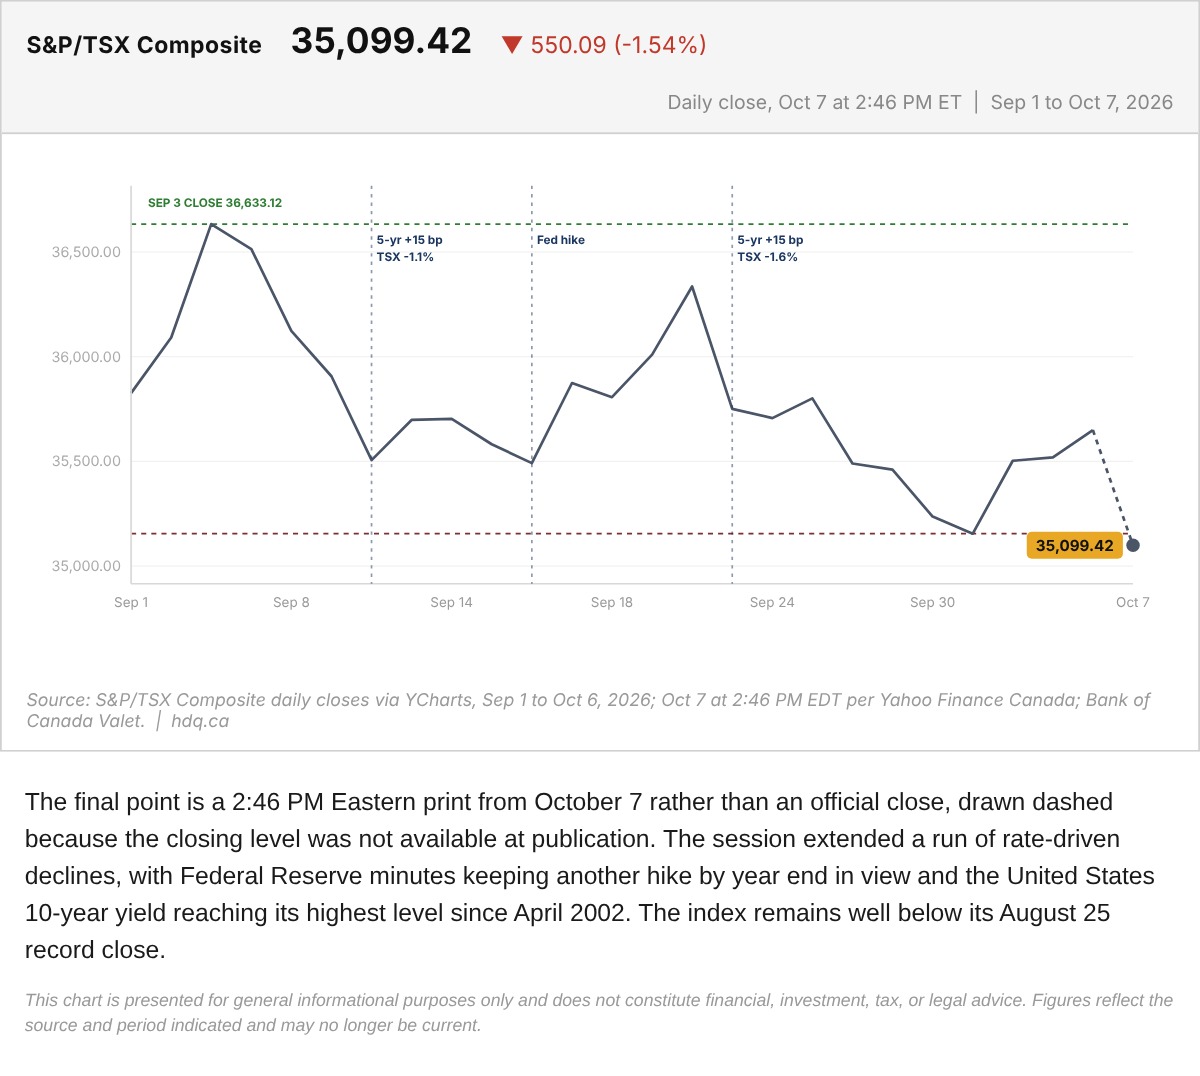
The final point is a 2:46 PM Eastern print from October 7 rather than an official close, drawn dashed because the closing level was not available at publication.
S&P/TSX Composite With the October 7 Midday Print
October 7, 2026
View chart & download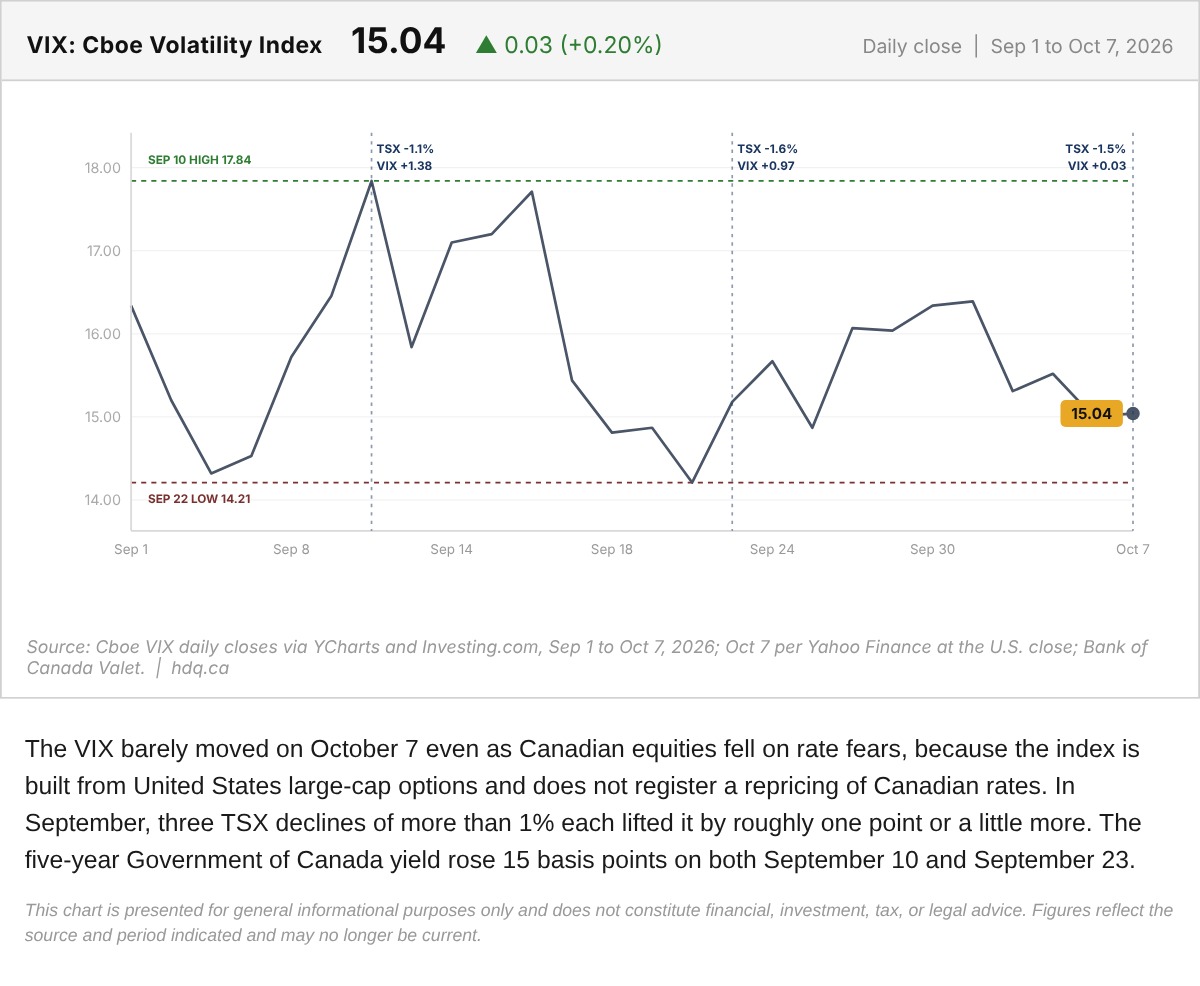
The VIX barely moved on October 7 even as Canadian equities fell on rate fears, because the index is built from United States large-cap…
VIX Daily Close on the Day Rate Fear Hit the TSX
October 7, 2026
View chart & download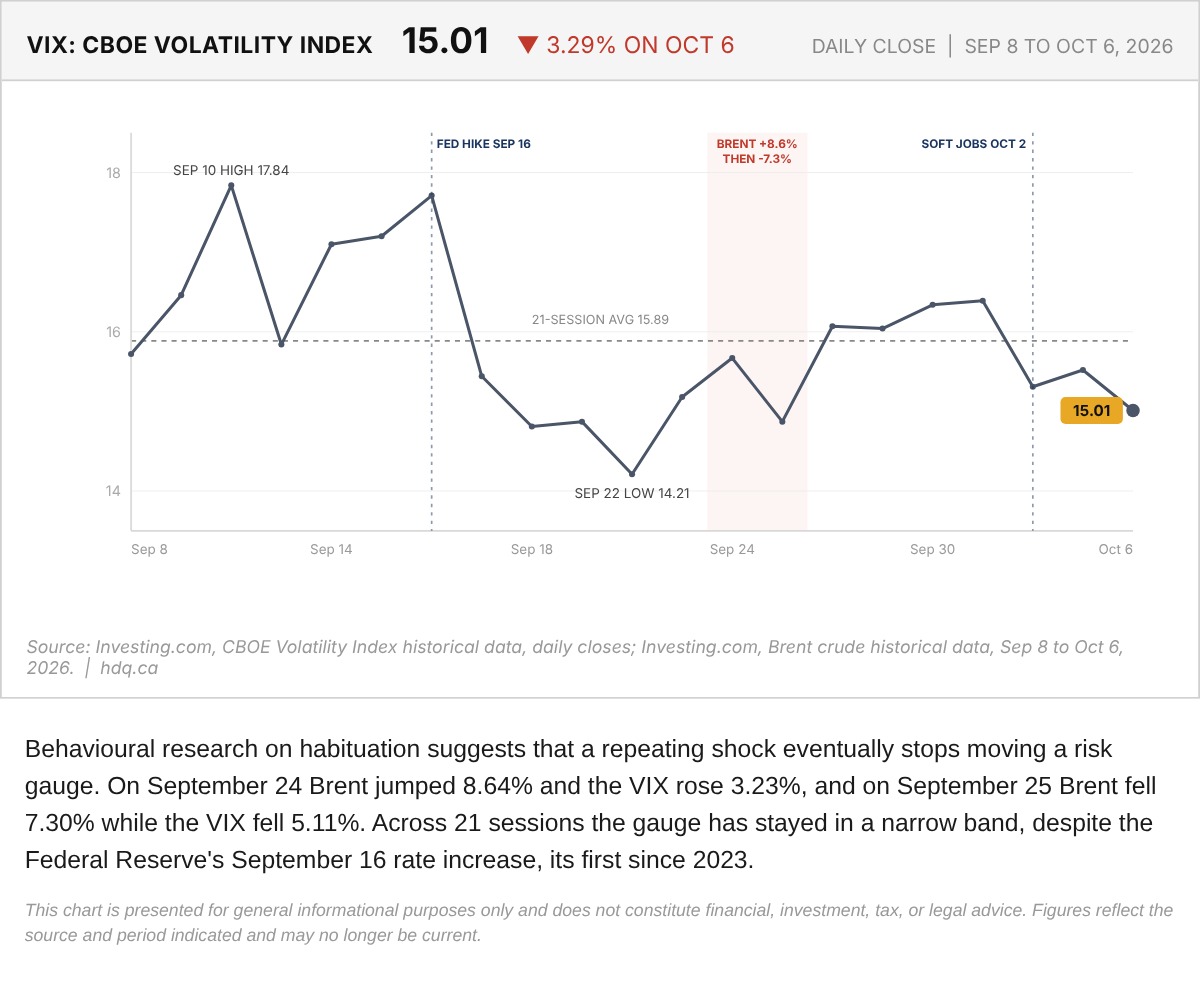
Behavioural research on habituation suggests that a repeating shock eventually stops moving a risk gauge.
VIX Daily Close and Habituation to Oil Shocks, September 8 to October 6
October 7, 2026
View chart & download
Brent was the only one of the three to finish above its starting level, while the index and gold both fell.
Brent, TSX and Gold Rebased to the August 31 Close
September 30, 2026
View chart & download