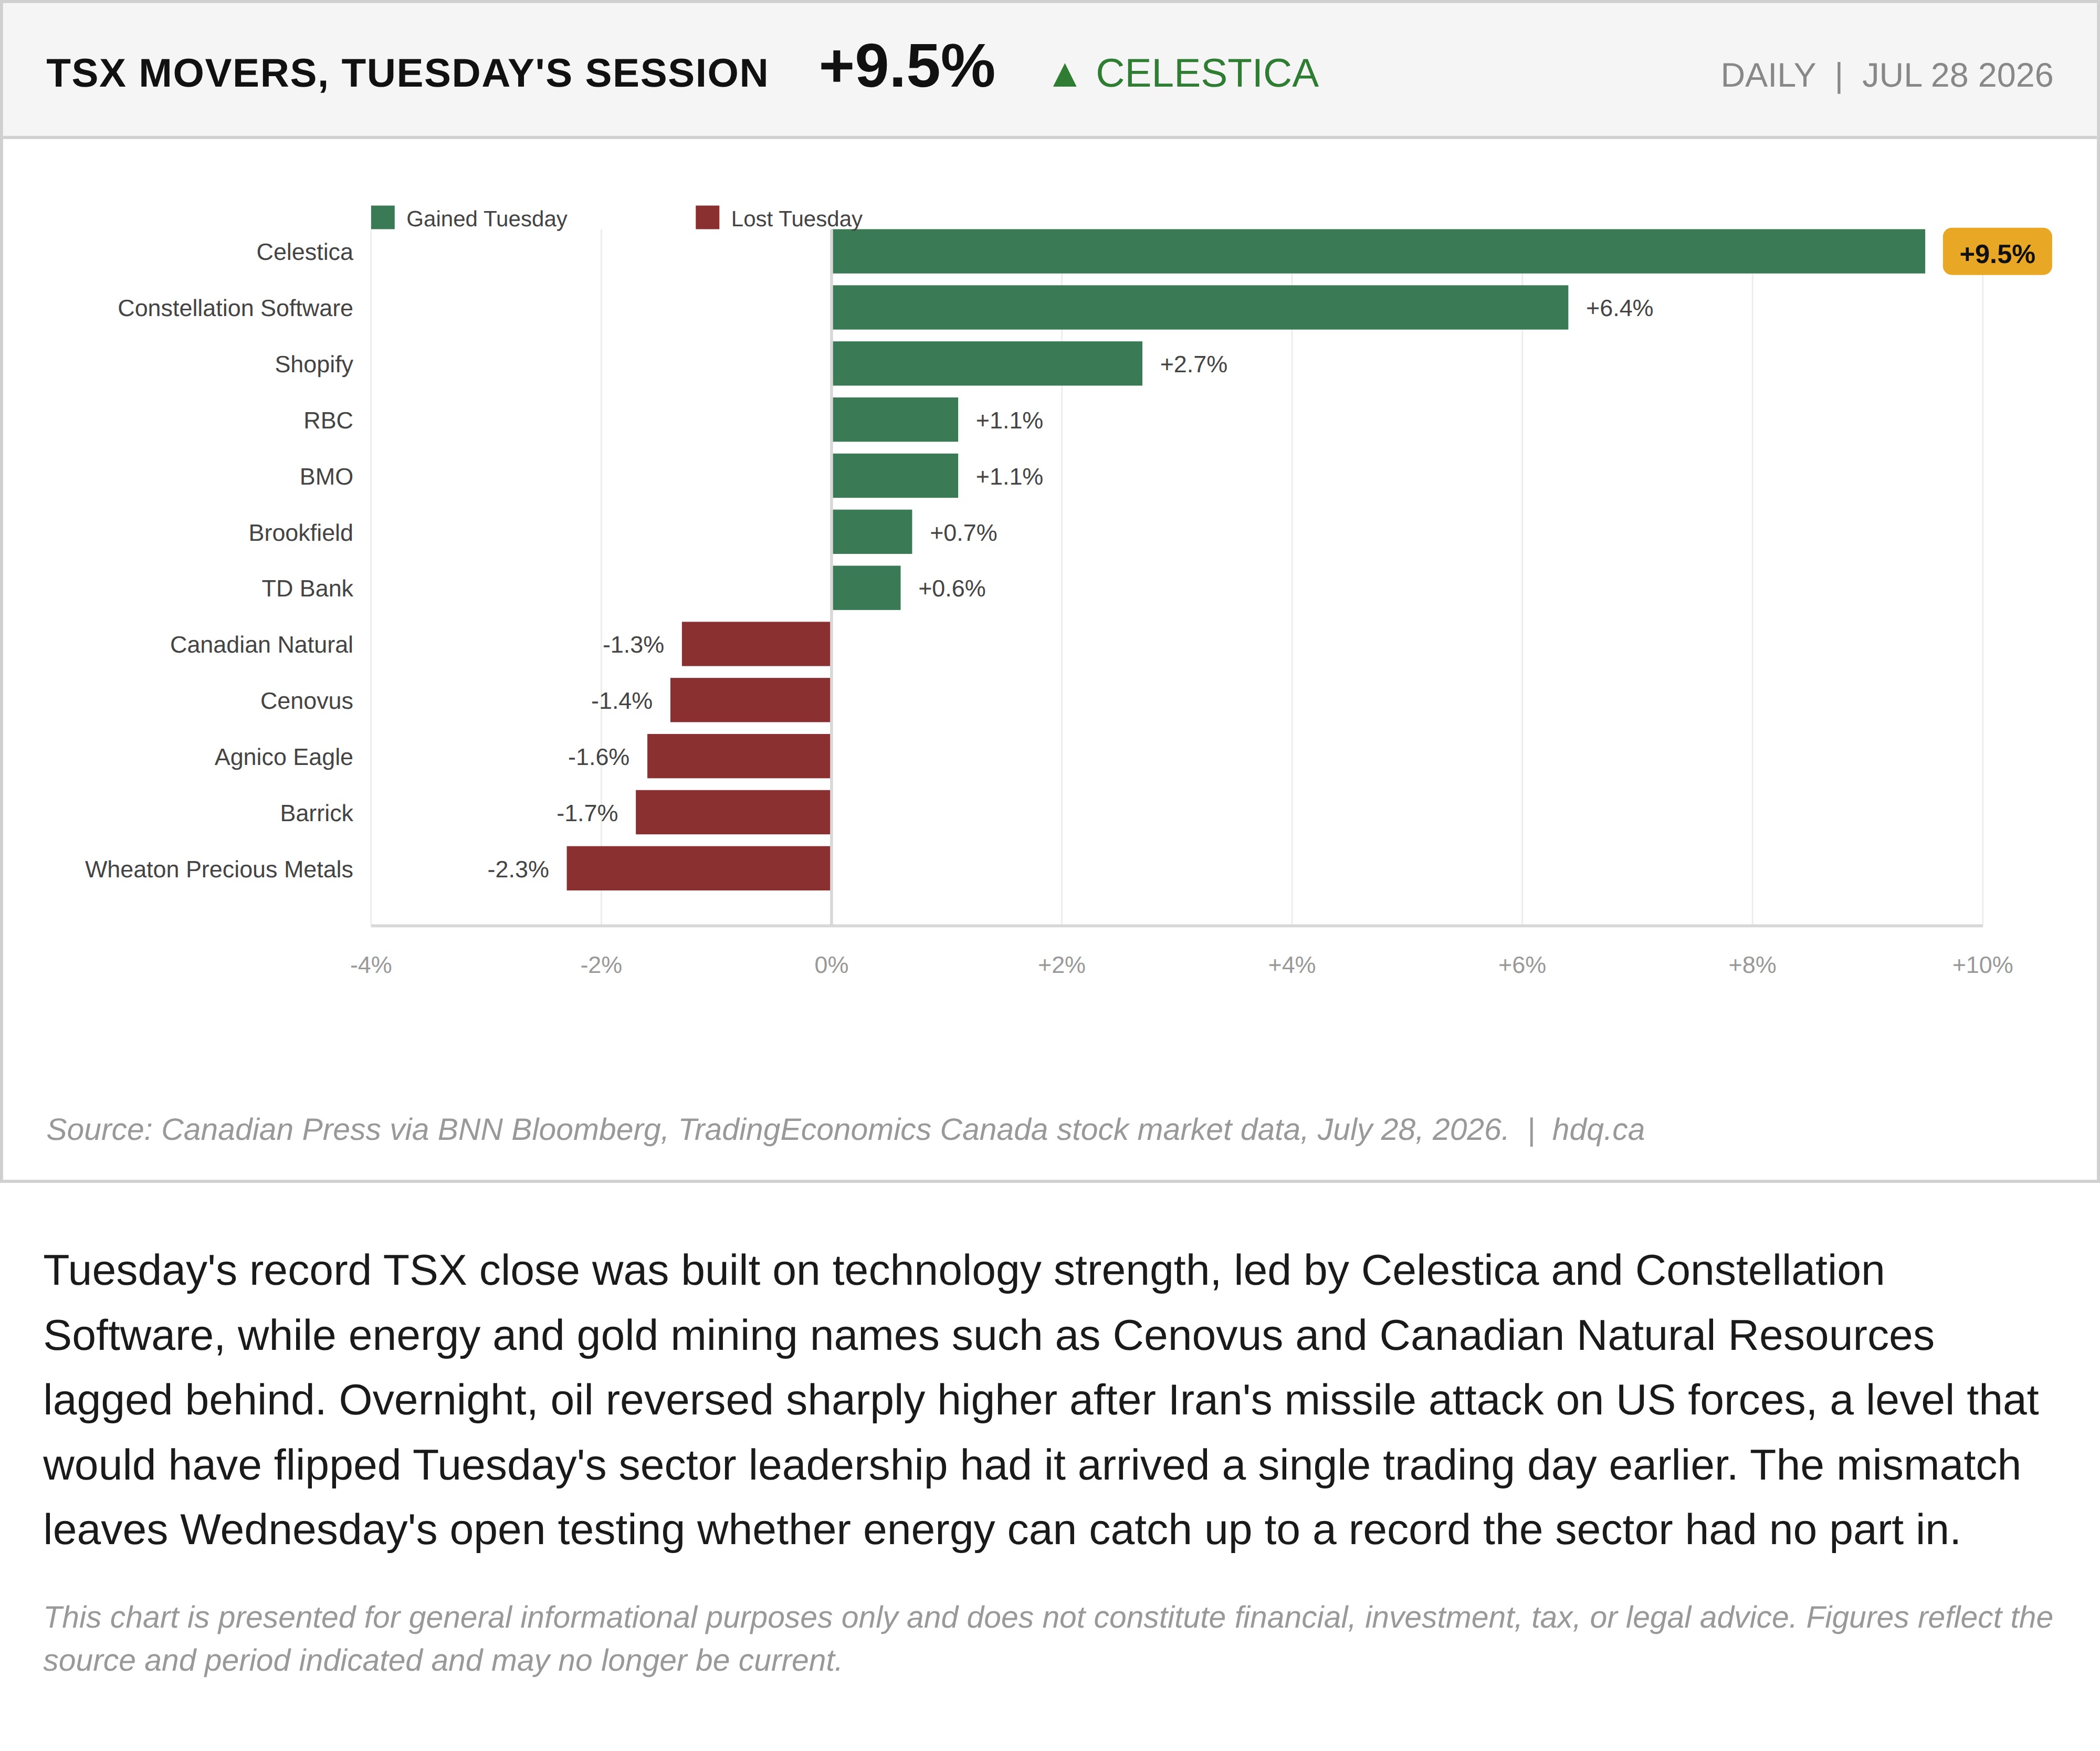
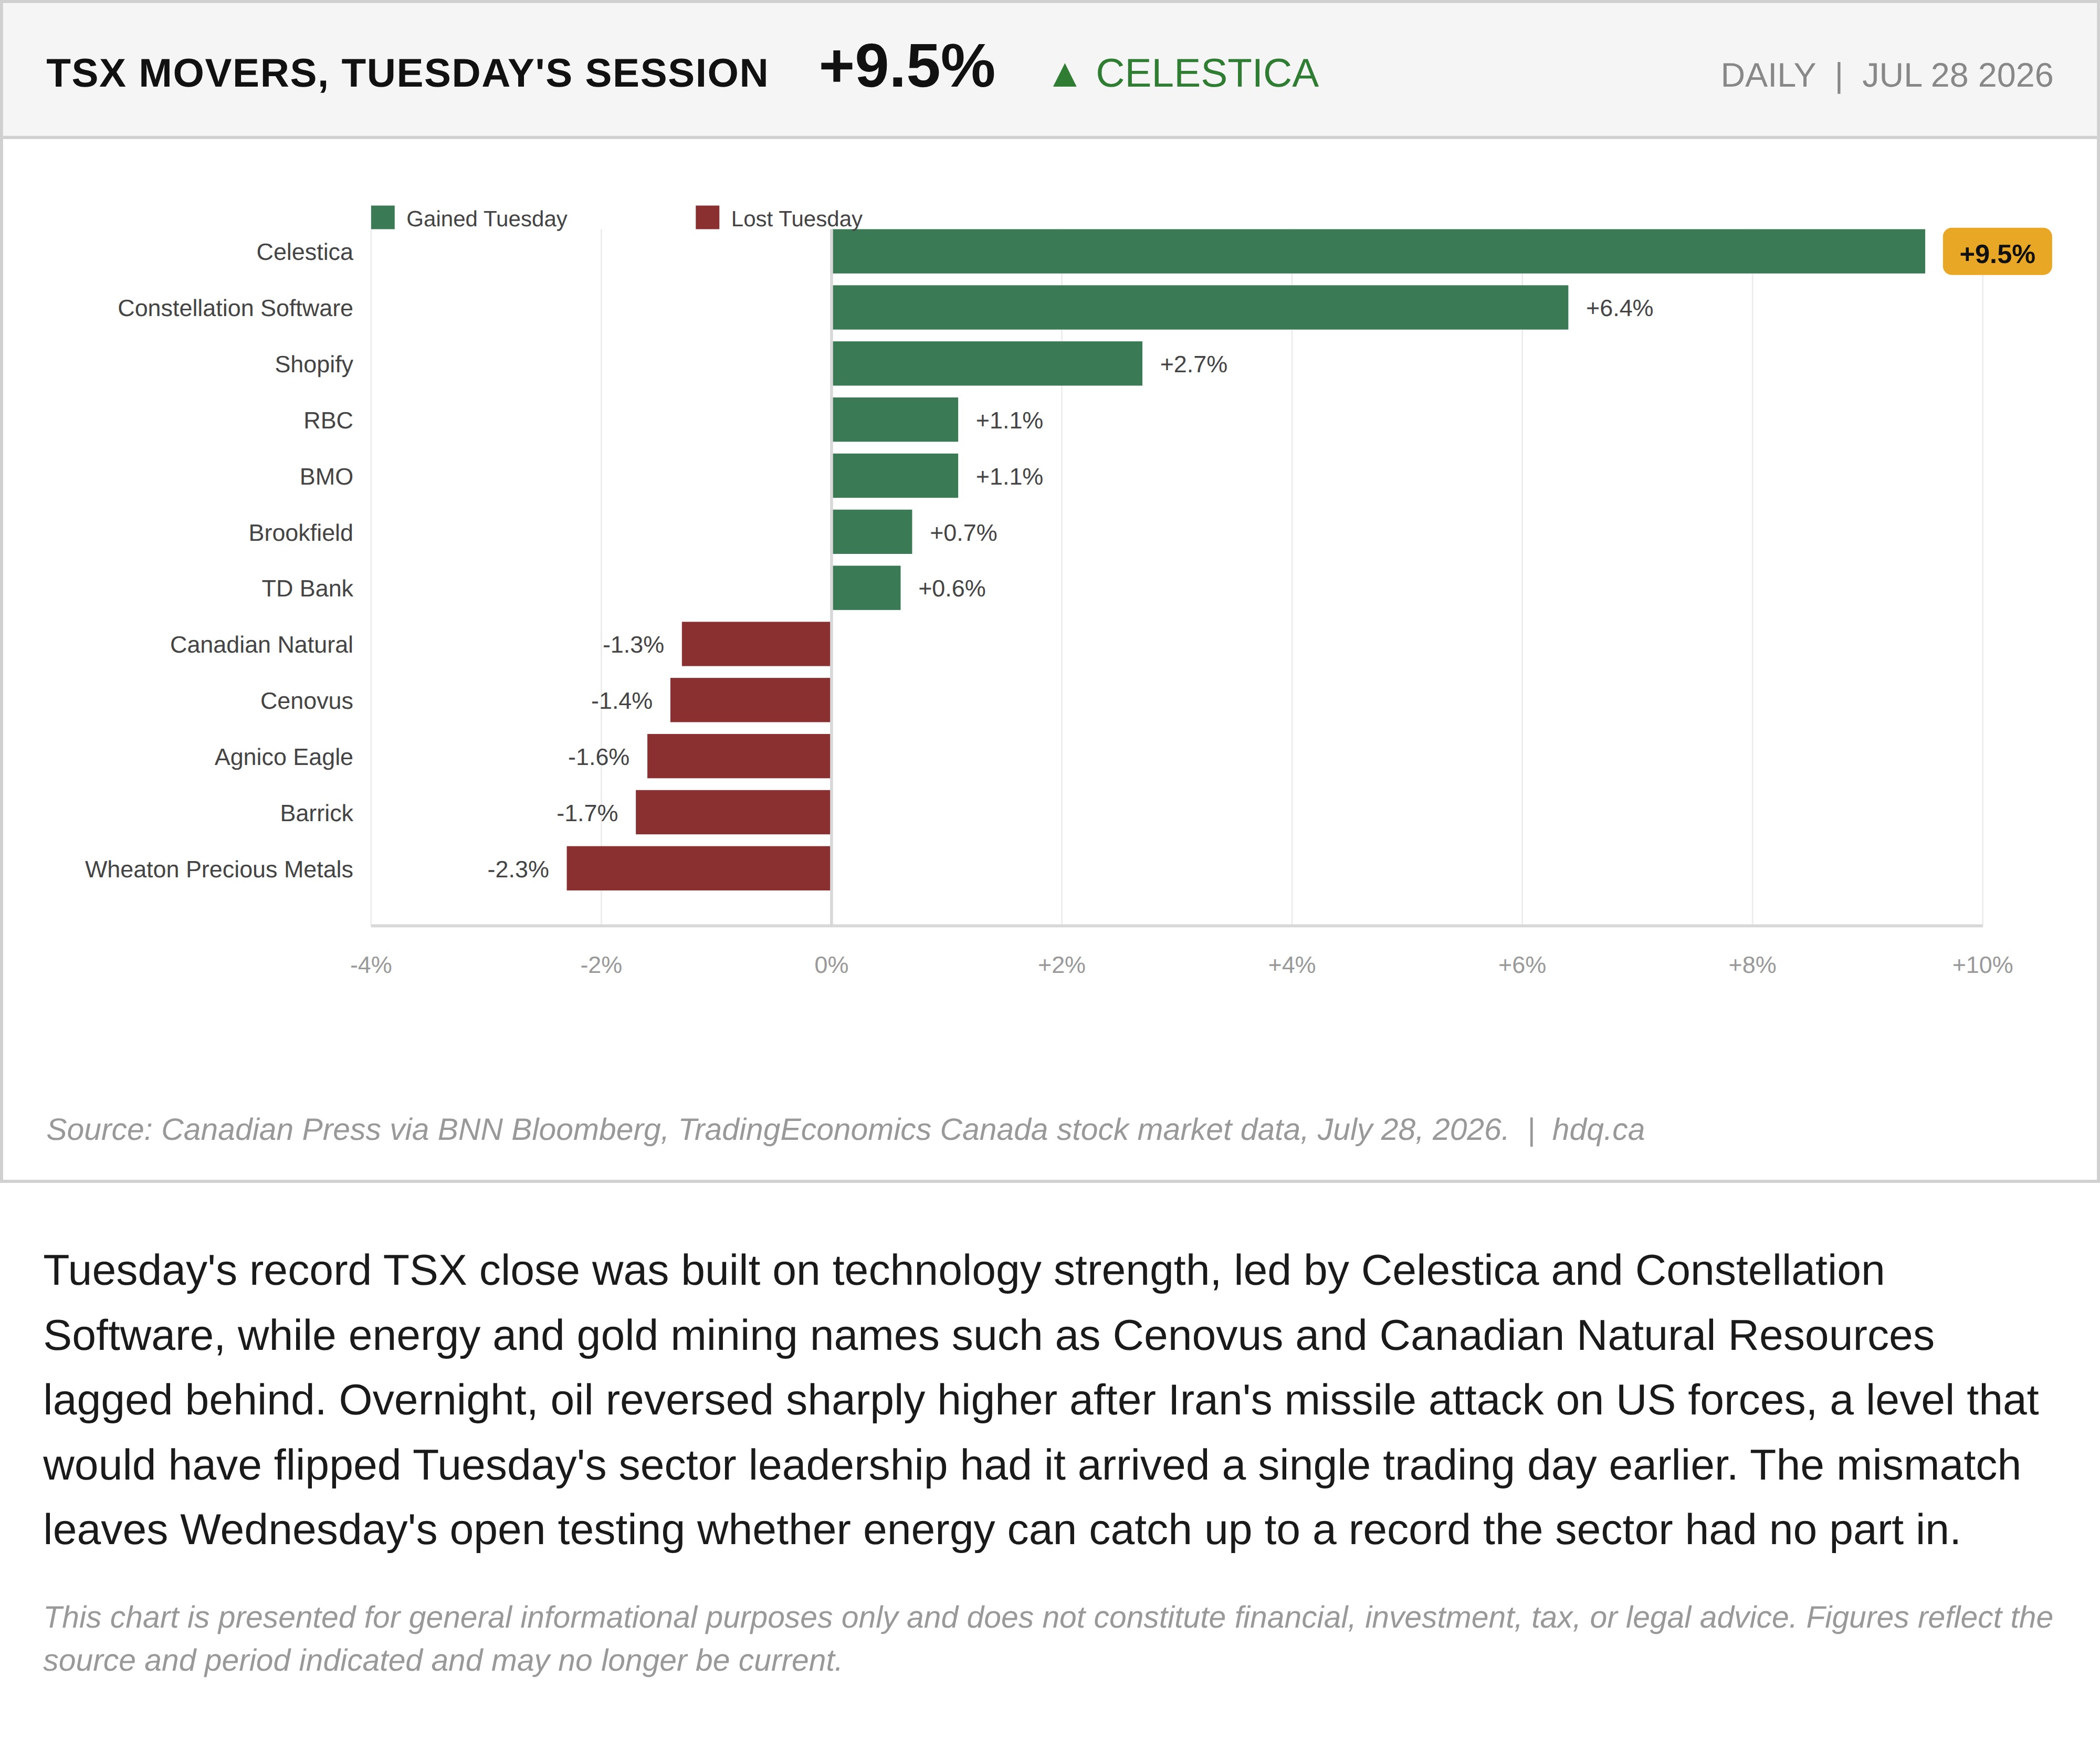
Tuesday's record TSX close was built on technology strength, led by Celestica and Constellation Software, while energy and gold mining names such as Cenovus and Canadian Natural Resources lagged behind. Overnight, oil reversed sharply higher after Iran's missile attack on US forces, a level that would have flipped Tuesday's sector leadership had it arrived a single trading day earlier. The mismatch leaves Wednesday's open testing whether energy can catch up to a record the sector had no part in.
This chart is presented for general informational purposes only and does not constitute financial, investment, tax, or legal advice. Figures reflect the source and period indicated and may no longer be current.
Related charts
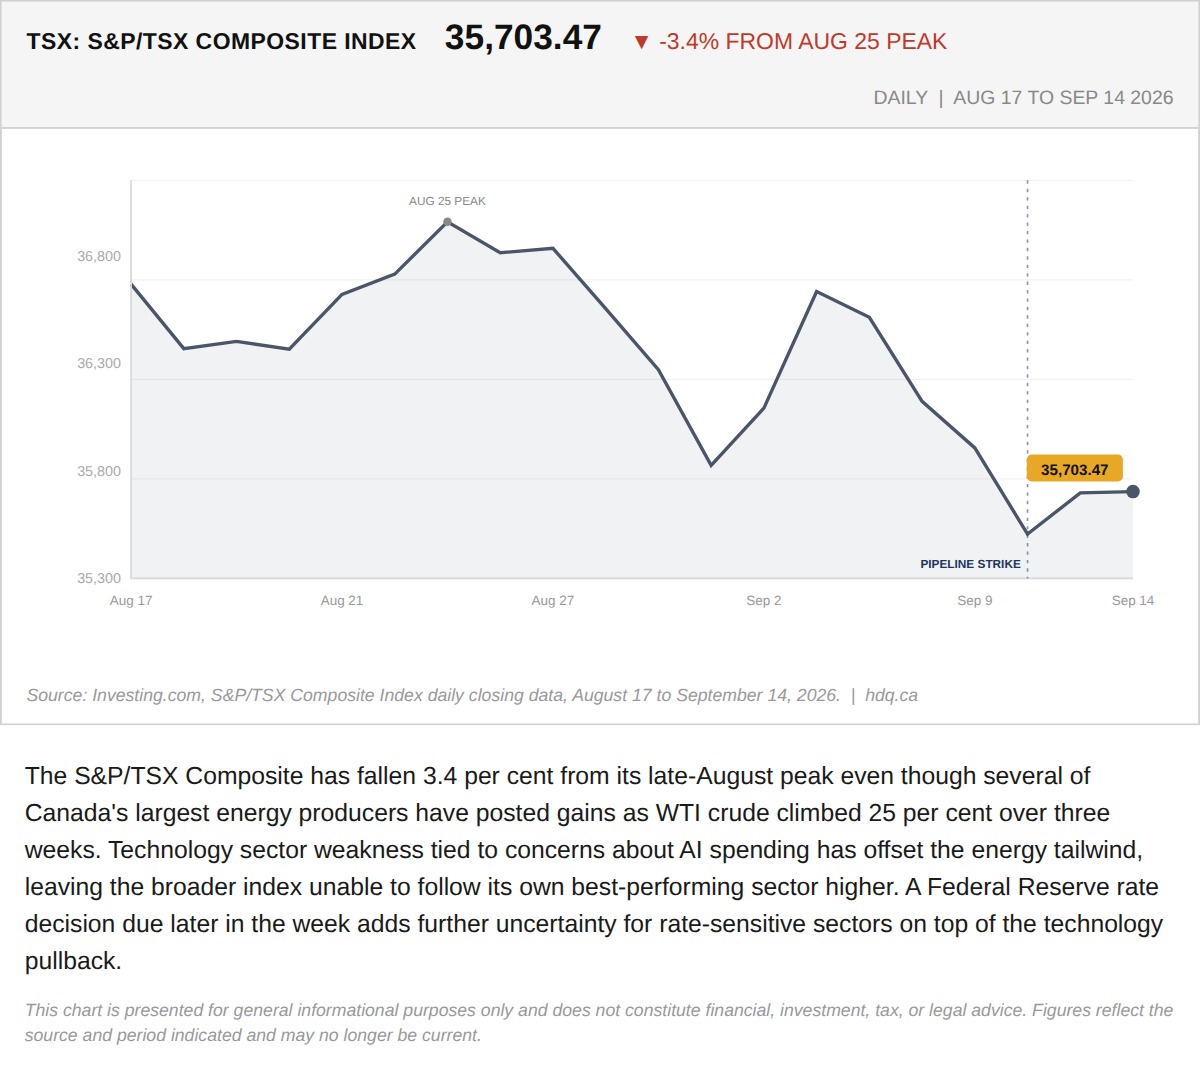
The S&P/TSX Composite has fallen 3.4 per cent from its late-August peak even though several of Canada's largest energy producers have…
TSX Composite Down 3.4% From Its August Peak, Even With Energy Stocks Leading the Market Higher
September 15, 2026
View chart & download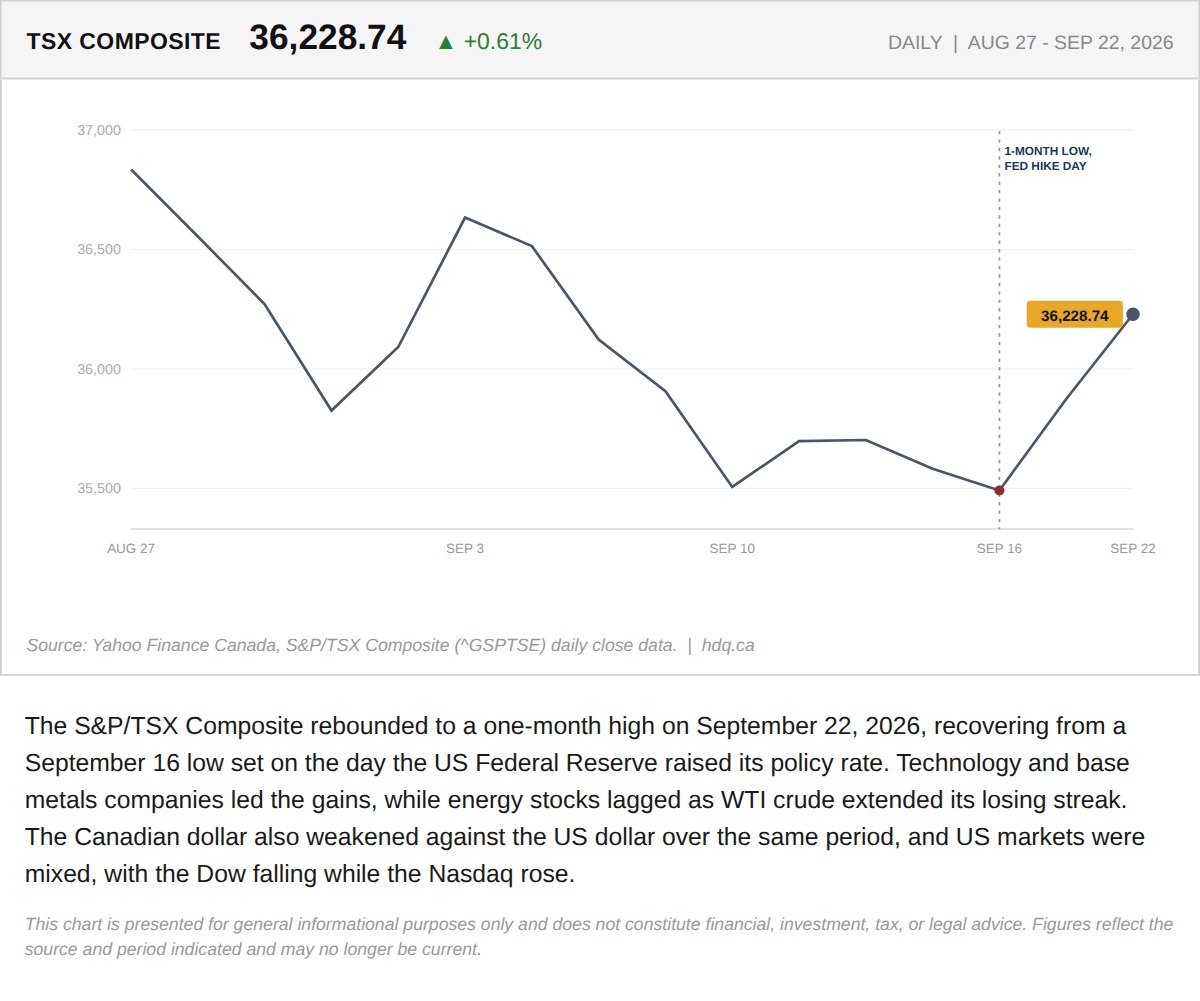
The S&P/TSX Composite rebounded to a one-month high on September 22, 2026, recovering from a September 16 low set on the day the US Federal Reserve raised its policy rate.
The TSX Hit a One-Month High on Tech and Base Metals While Energy Keeps Falling
September 23, 2026
View chart & download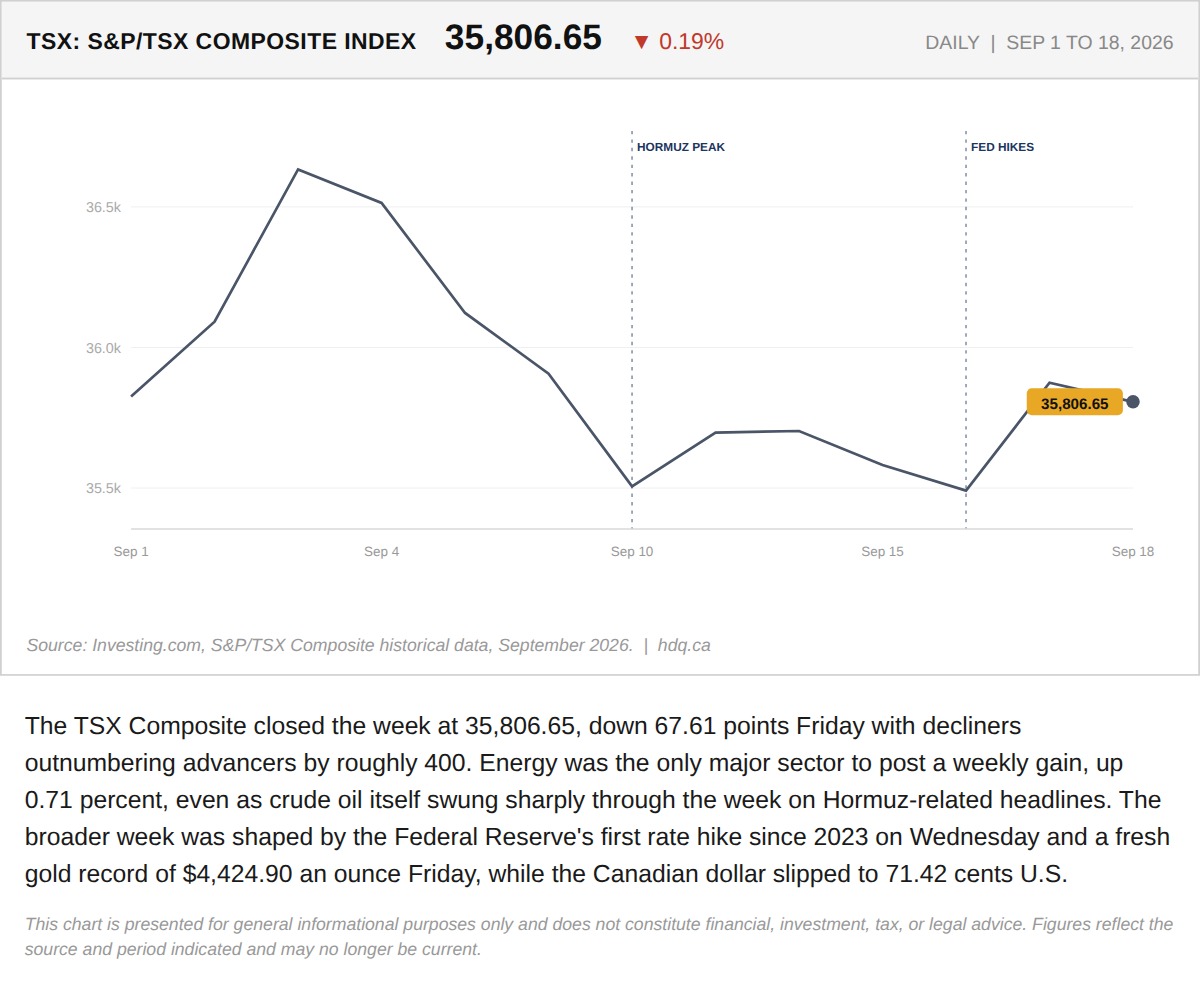
The TSX Composite closed the week at 35,806.65, down 67.61 points Friday with decliners outnumbering advancers by roughly 400.
The TSX Closed a Volatile Week at 35,806.65. Energy Was the Only Sector That Actually Held.
September 21, 2026
View chart & download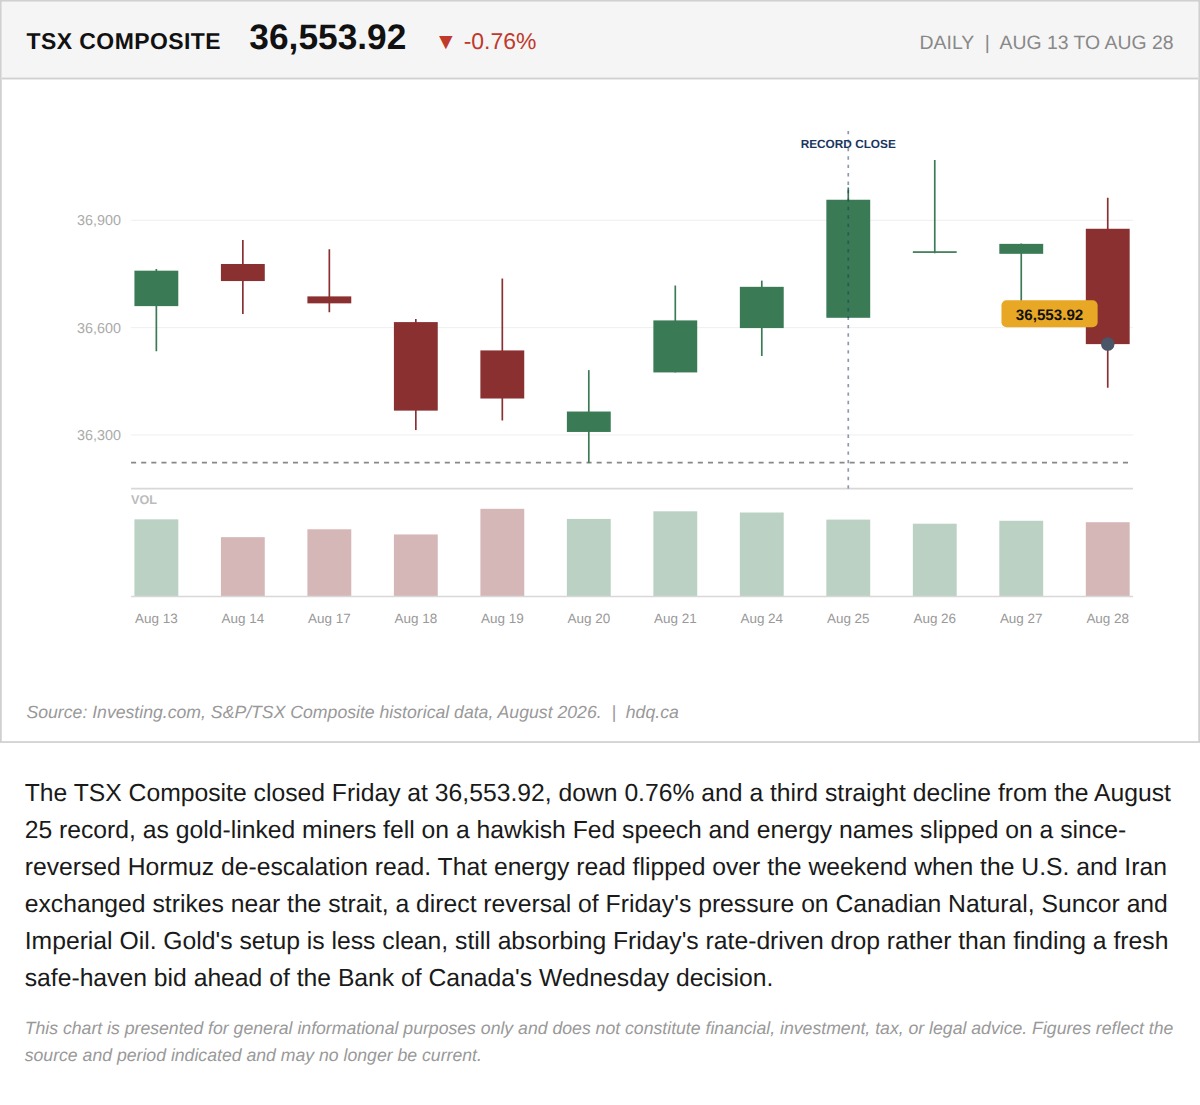
The TSX Composite closed Friday at 36,553.92, down 0.76% and a third straight decline from the August 25 record, as gold-linked miners fell…
The TSX Set a Record Close Six Sessions Ago. It Has Given Back 400 Points Since
August 31, 2026
View chart & download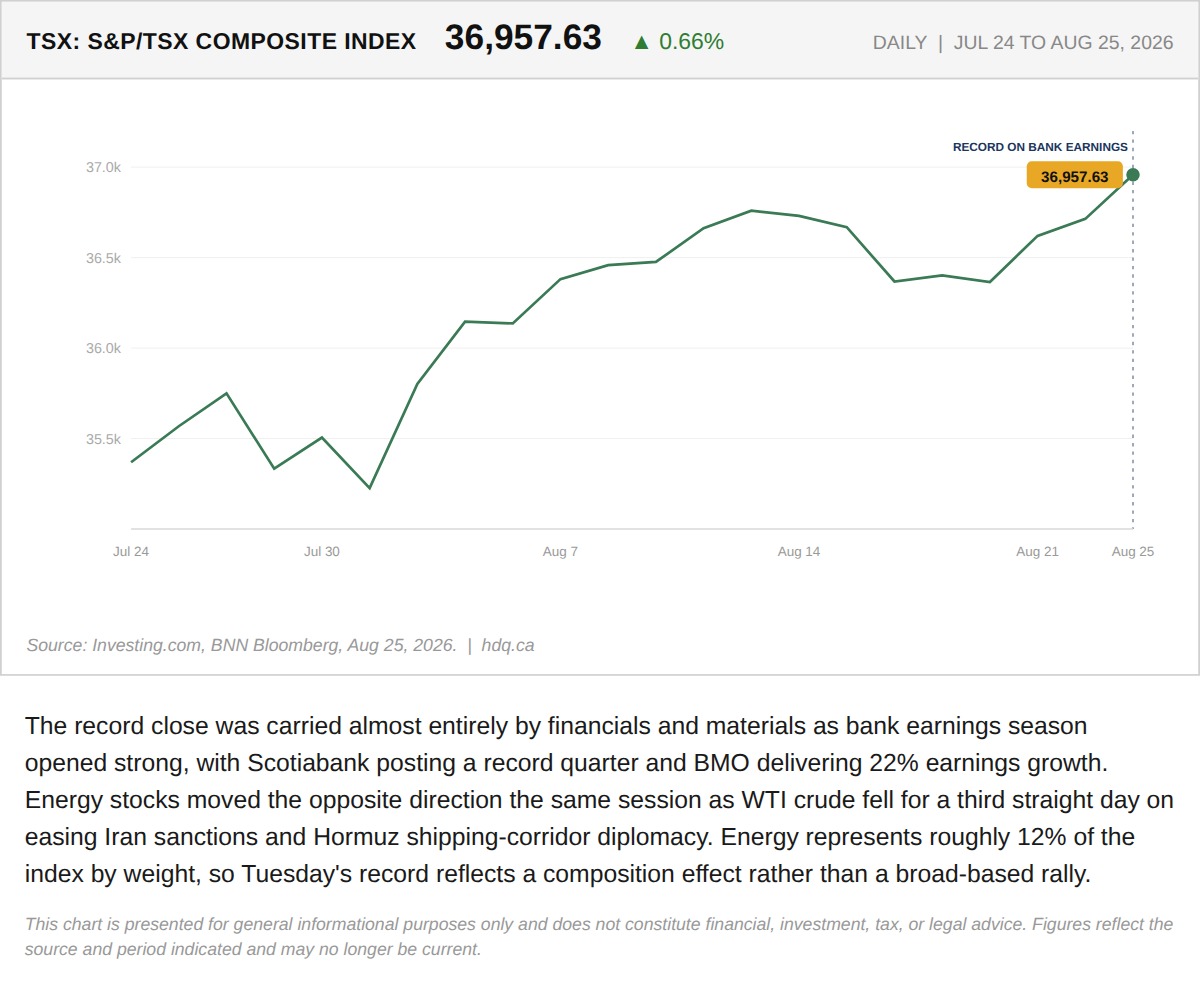
The record close was carried almost entirely by financials and materials as bank earnings season opened strong, with Scotiabank posting a…
The TSX Hit a Record High Tuesday. Only Two Sectors Actually Showed Up.
August 26, 2026
View chart & download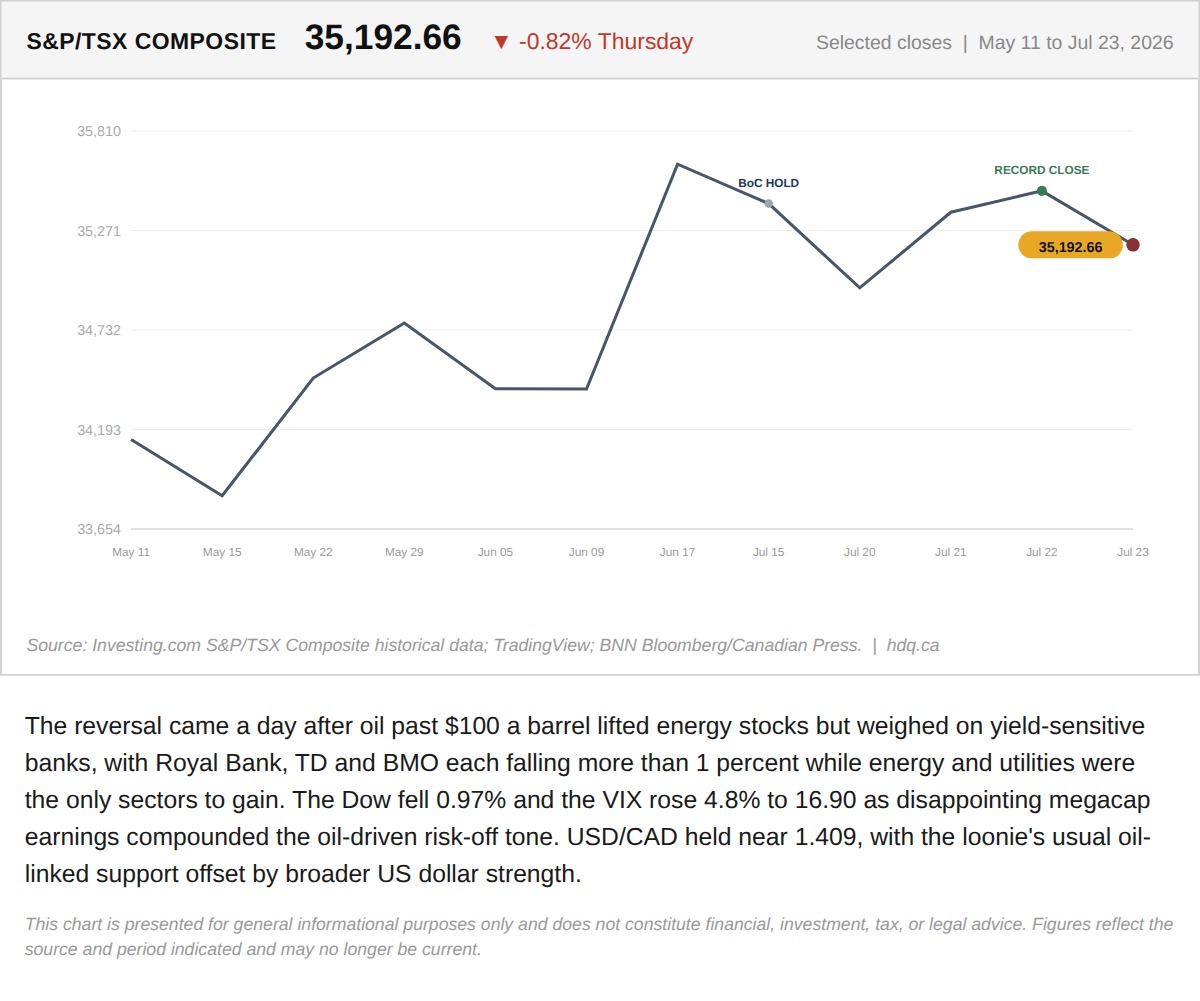
The reversal came a day after oil past $100 a barrel lifted energy stocks but weighed on yield-sensitive banks, with Royal Bank, TD and BMO…
Record High, Then a Bank-Led Reversal: Inside Thursday's TSX Split
July 24, 2026
View chart & download