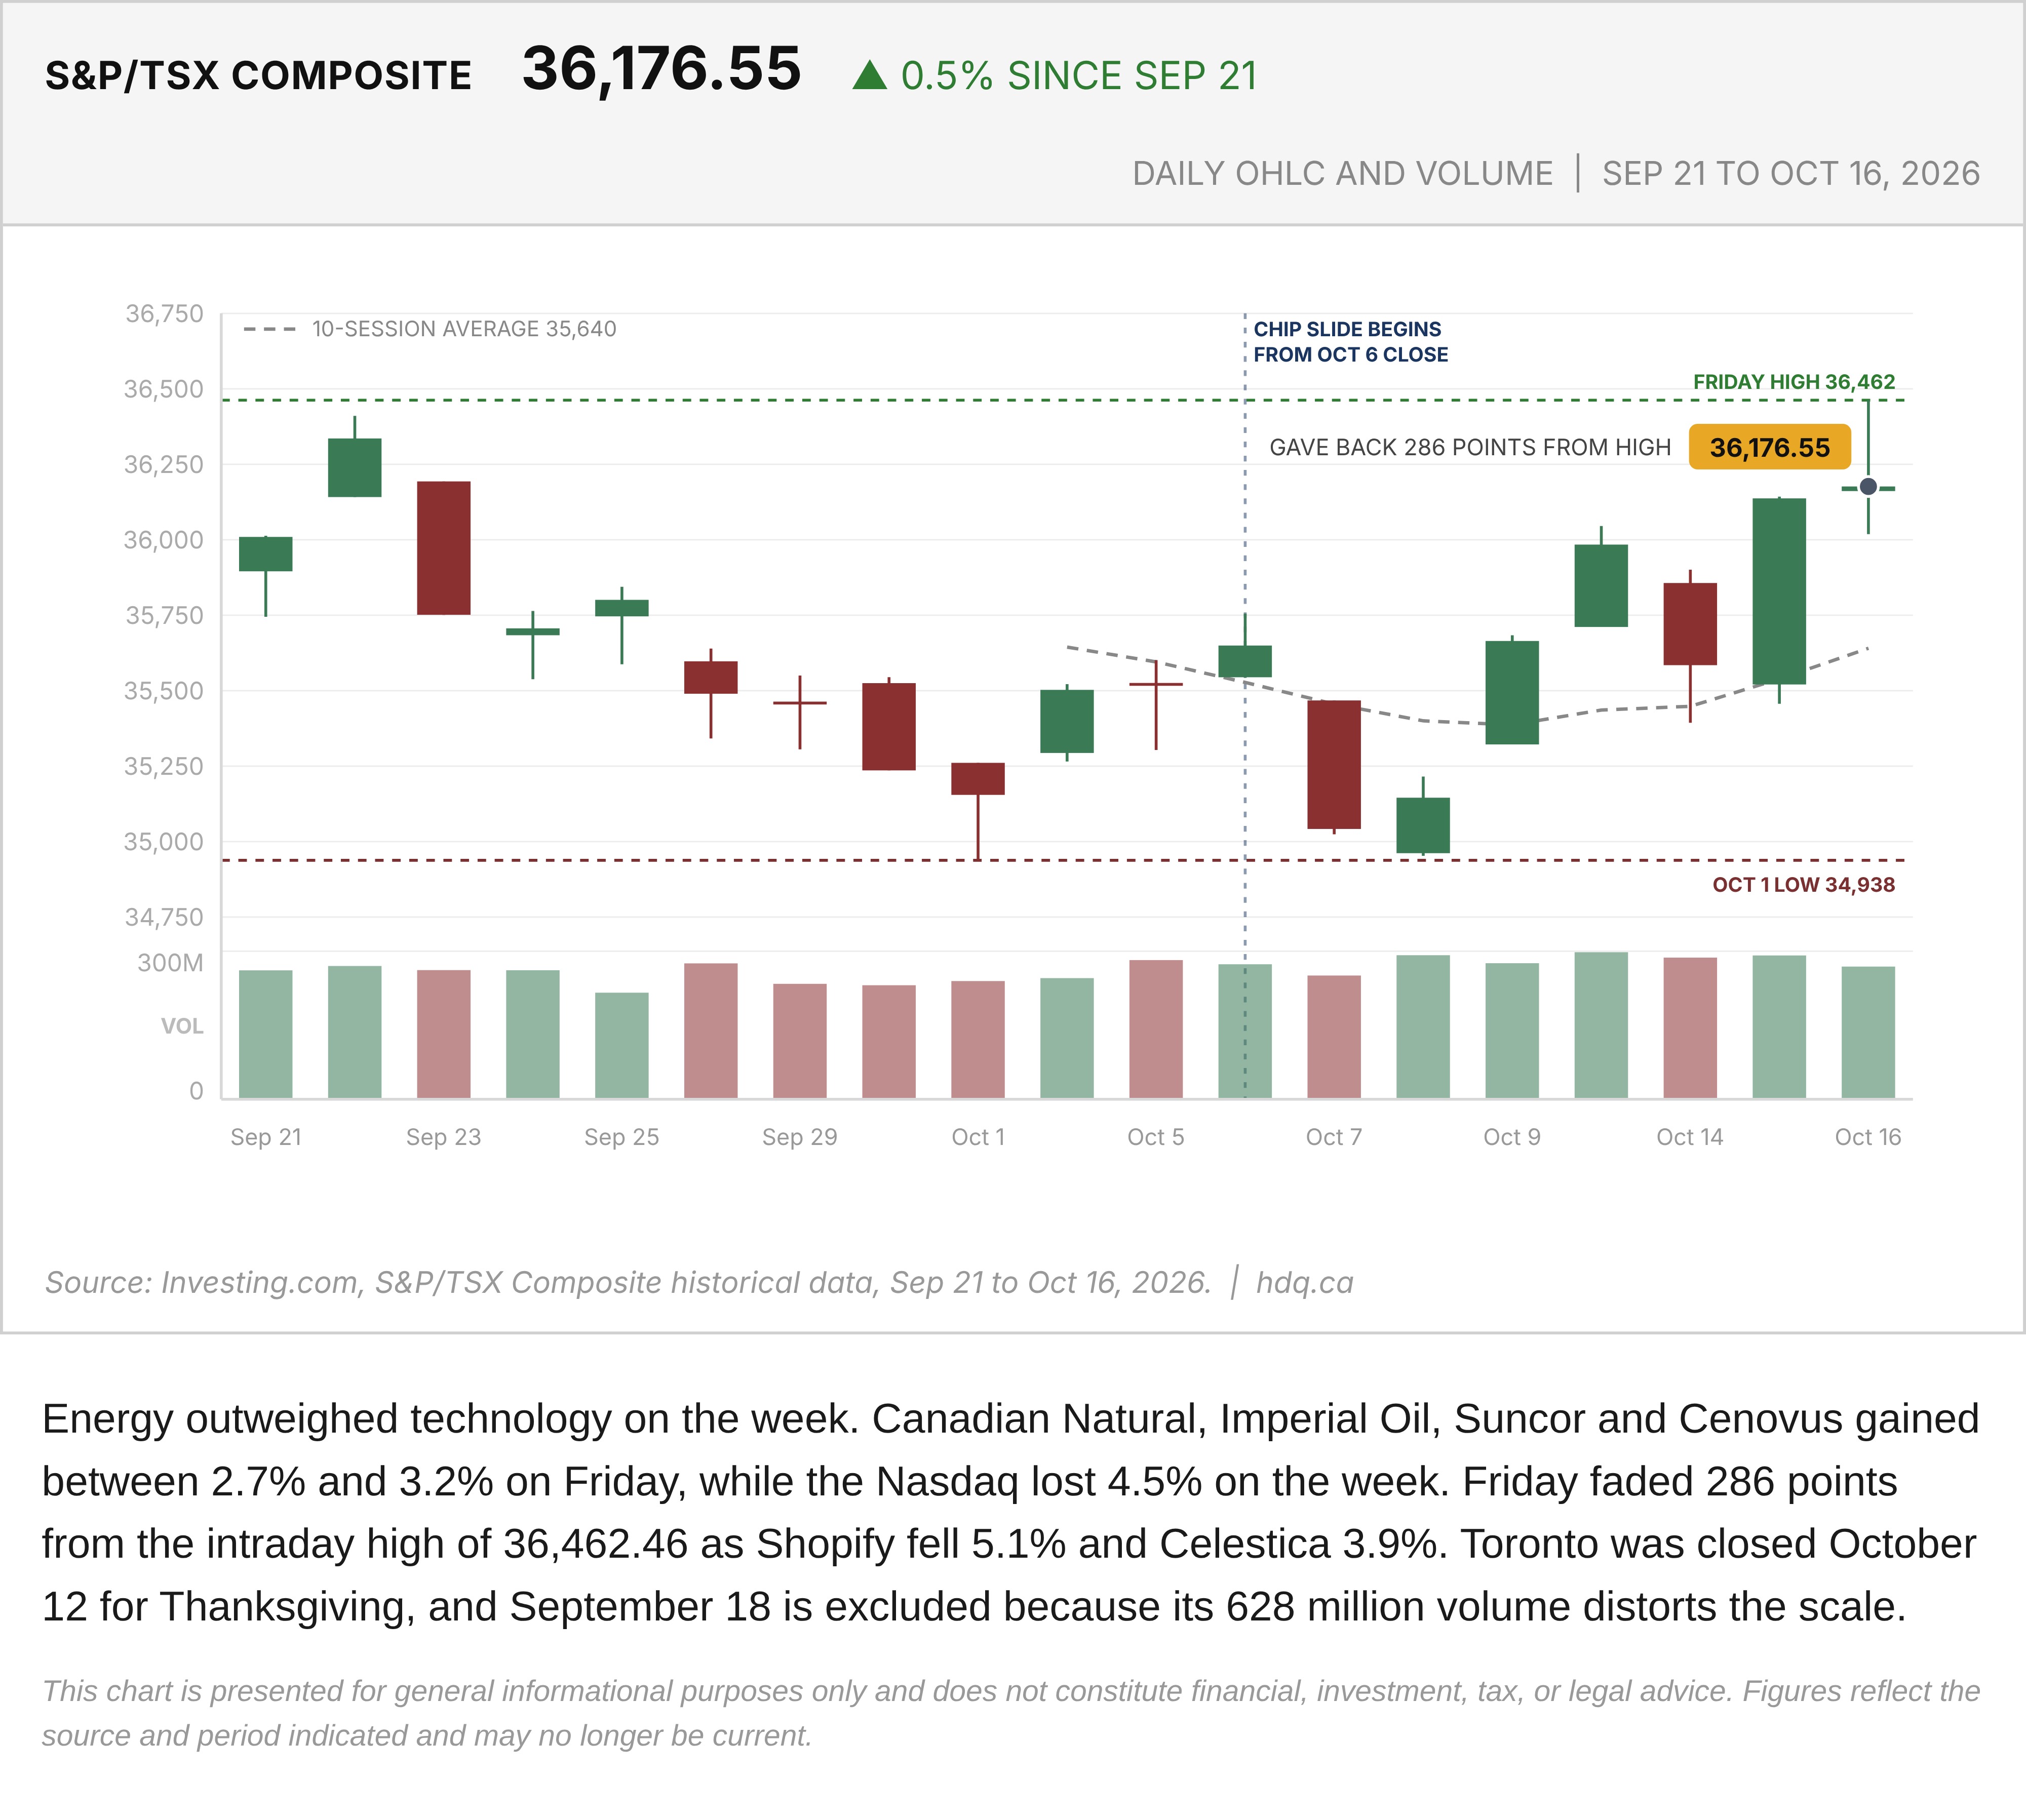
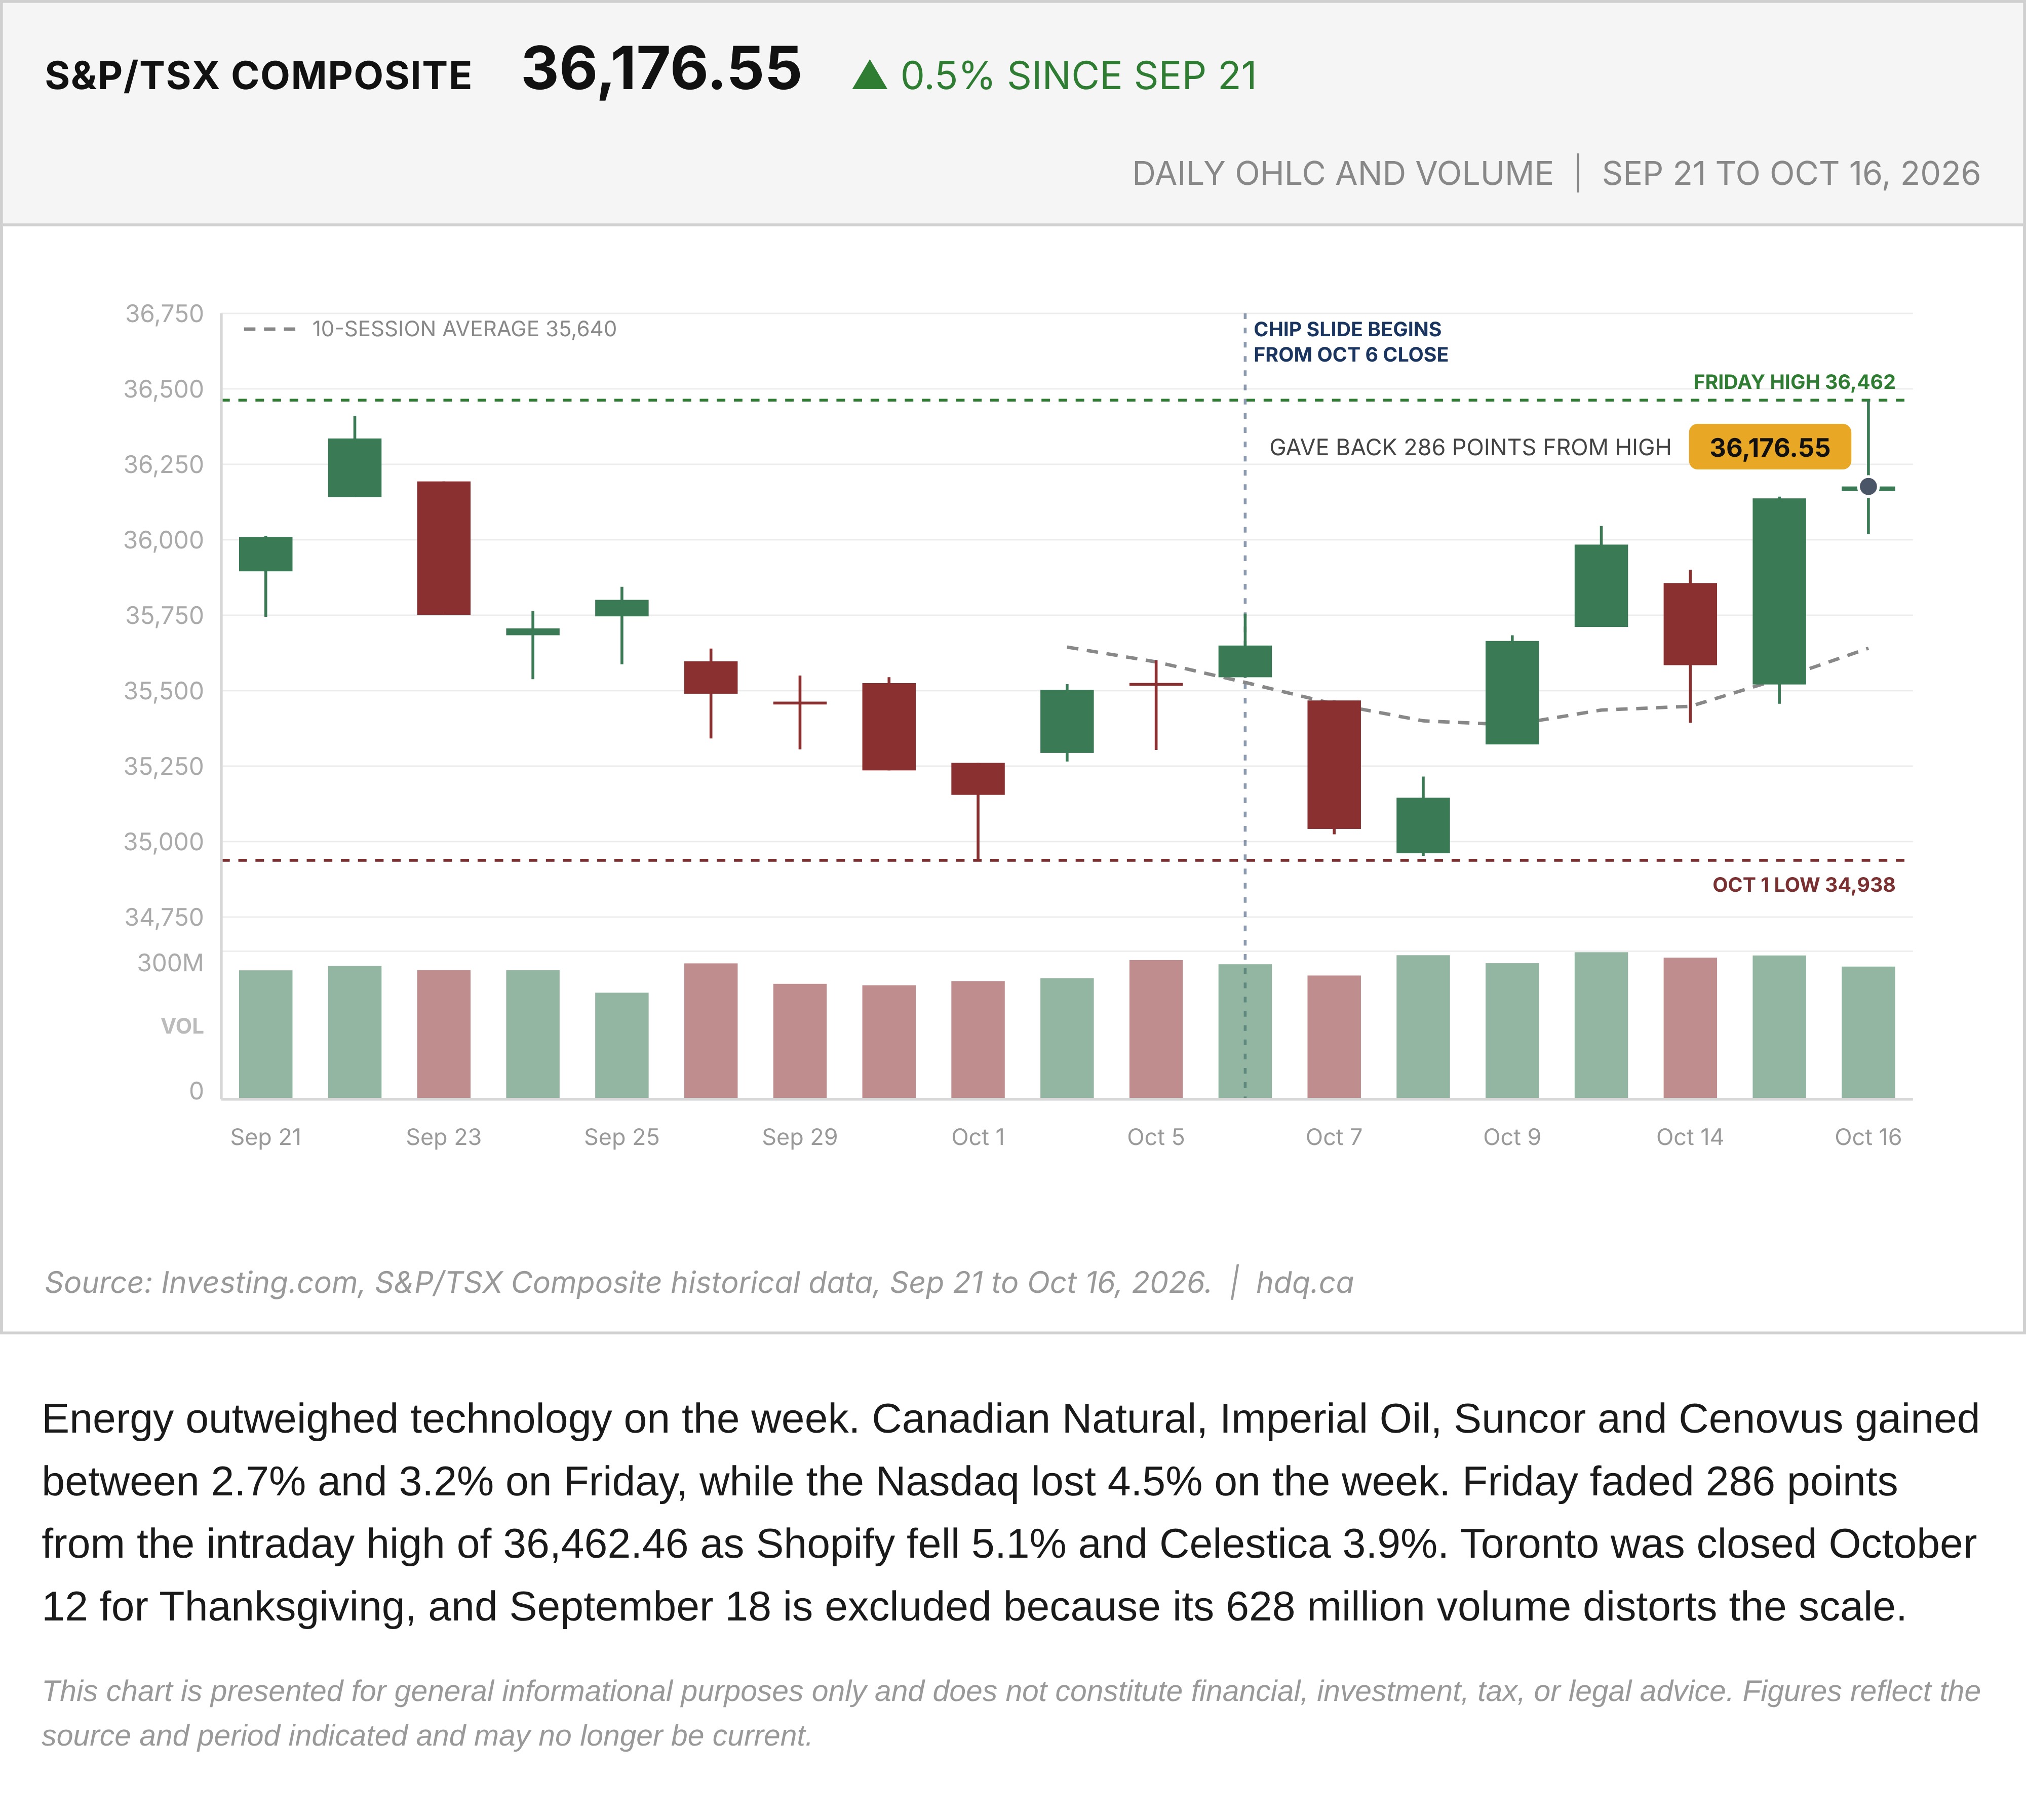
Energy outweighed technology on the week. Canadian Natural, Imperial Oil, Suncor and Cenovus gained between 2.7% and 3.2% on Friday, while the Nasdaq lost 4.5% on the week. Friday faded 286 points from the intraday high of 36,462.46 as Shopify fell 5.1% and Celestica 3.9%. Toronto was closed October 12 for Thanksgiving, and September 18 is excluded because its 628 million volume distorts the scale.
This chart is presented for general informational purposes only and does not constitute financial, investment, tax, or legal advice. Figures reflect the source and period indicated and may no longer be current.
Related charts
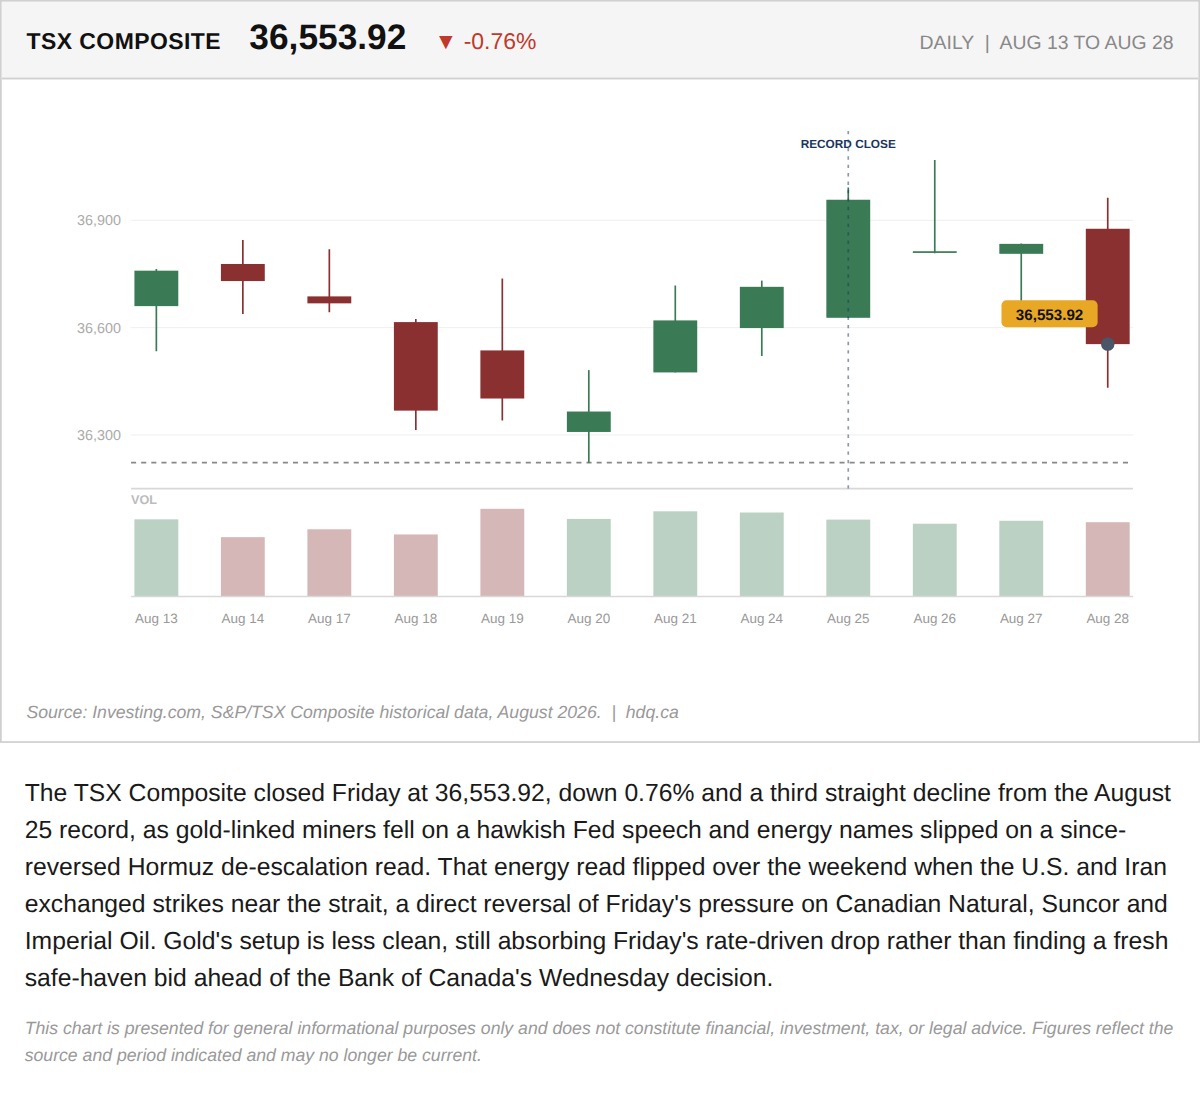
The TSX Composite closed Friday at 36,553.92, down 0.76% and a third straight decline from the August 25 record, as gold-linked miners fell…
The TSX Set a Record Close Six Sessions Ago. It Has Given Back 400 Points Since
August 31, 2026
View chart & download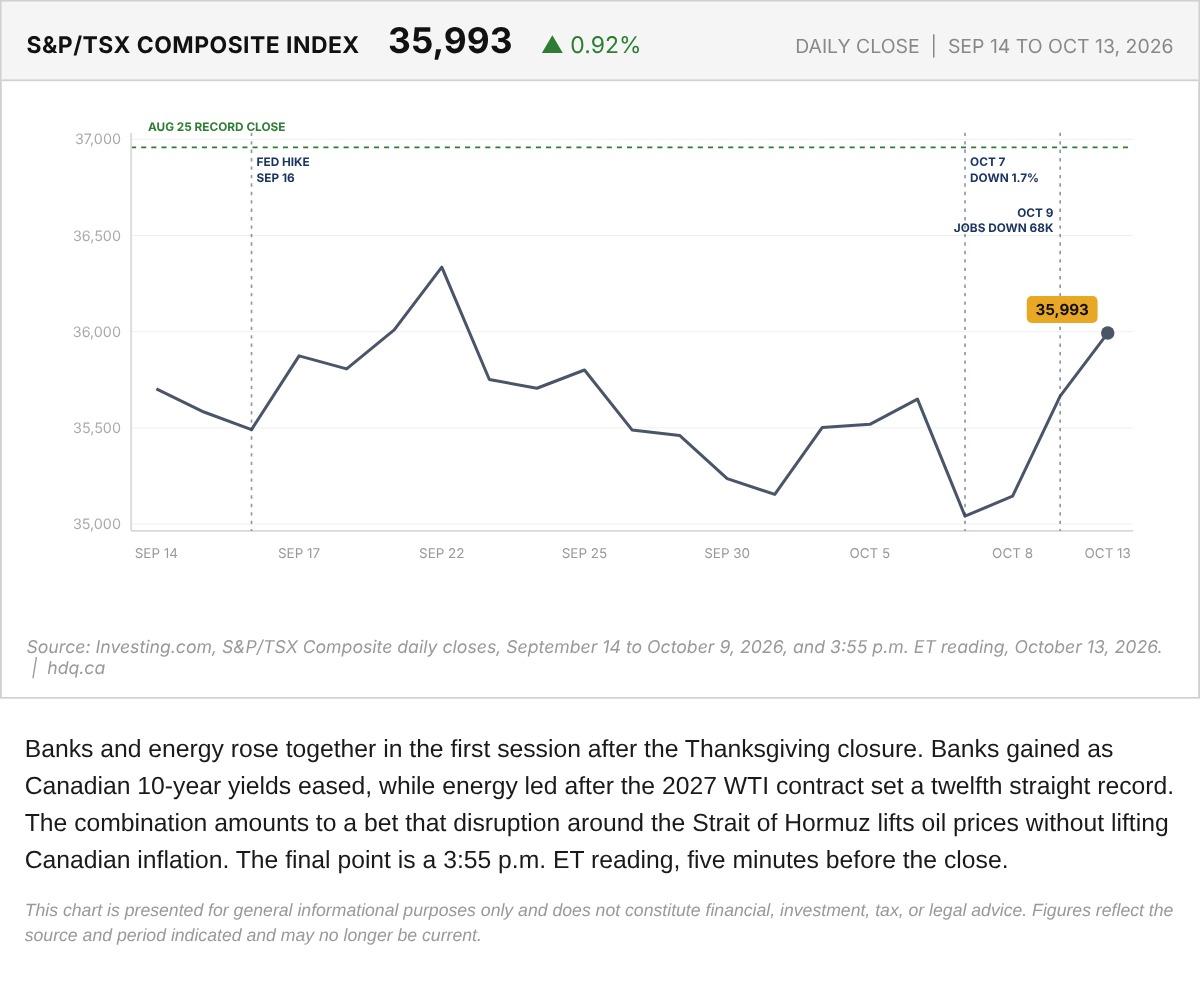
Banks and energy rose together in the first session after the Thanksgiving closure.
S&P/TSX Composite Index, September 14 to October 13, 2026
October 13, 2026
View chart & download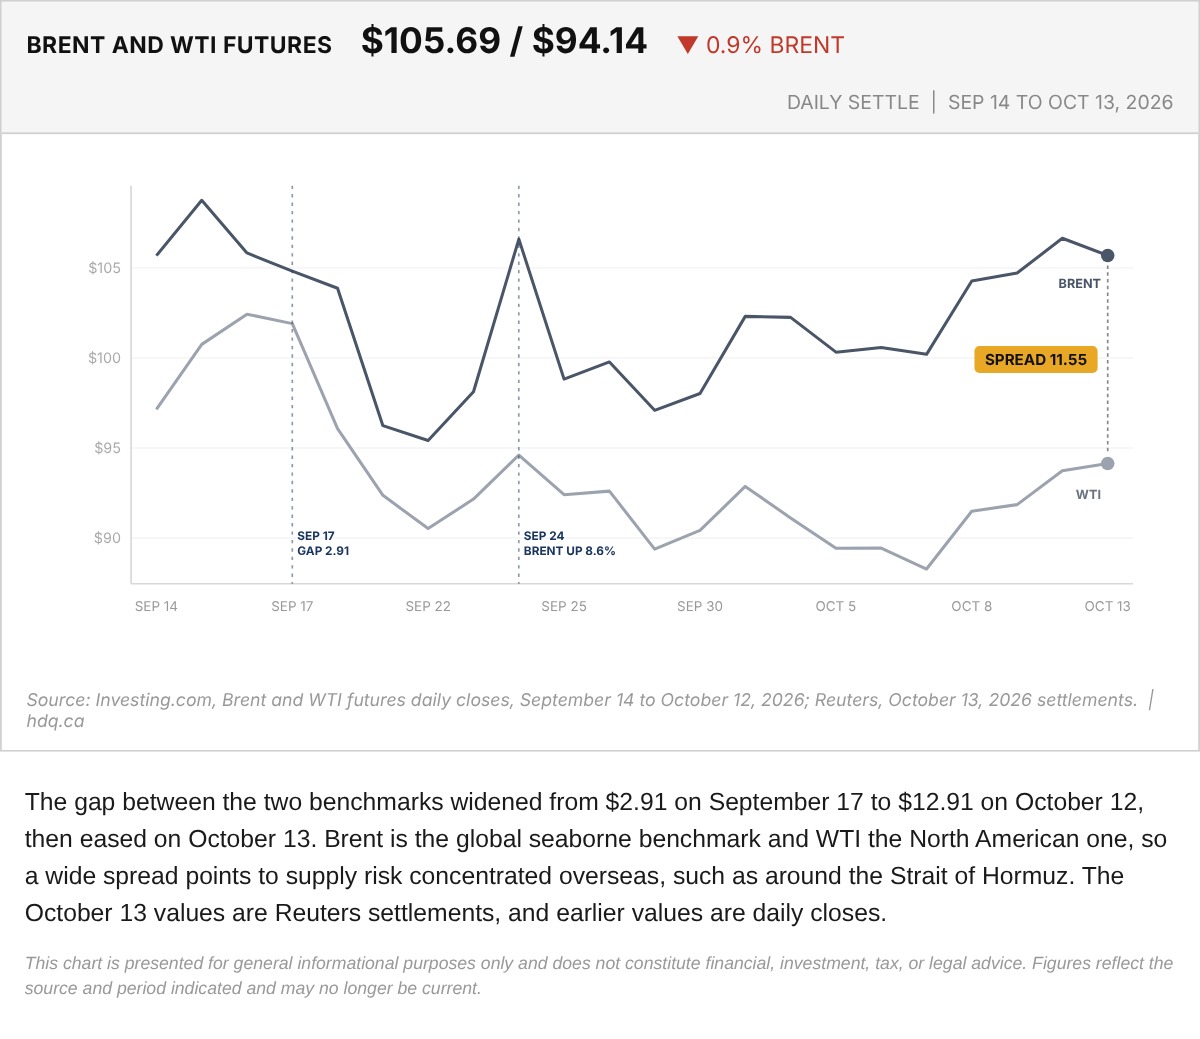
The gap between the two benchmarks widened from $2.91 on September 17 to $12.91 on October 12, then eased on October 13.
Brent and WTI Crude Oil Futures, September 14 to October 13, 2026
October 13, 2026
View chart & download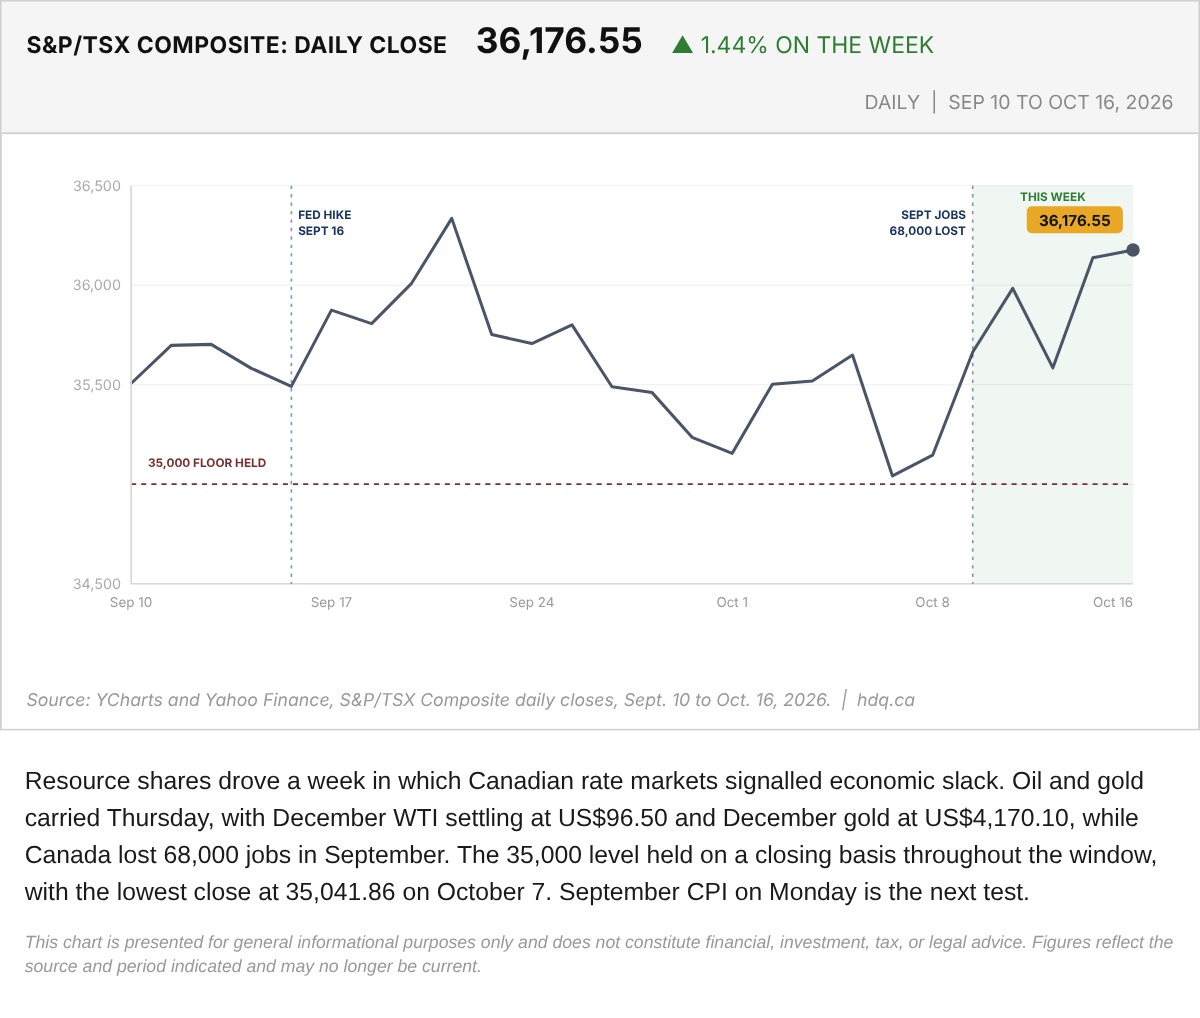
Resource shares drove a week in which Canadian rate markets signalled economic slack.
S&P/TSX Composite Daily Close, September 10 to October 16, 2026
October 16, 2026
View chart & download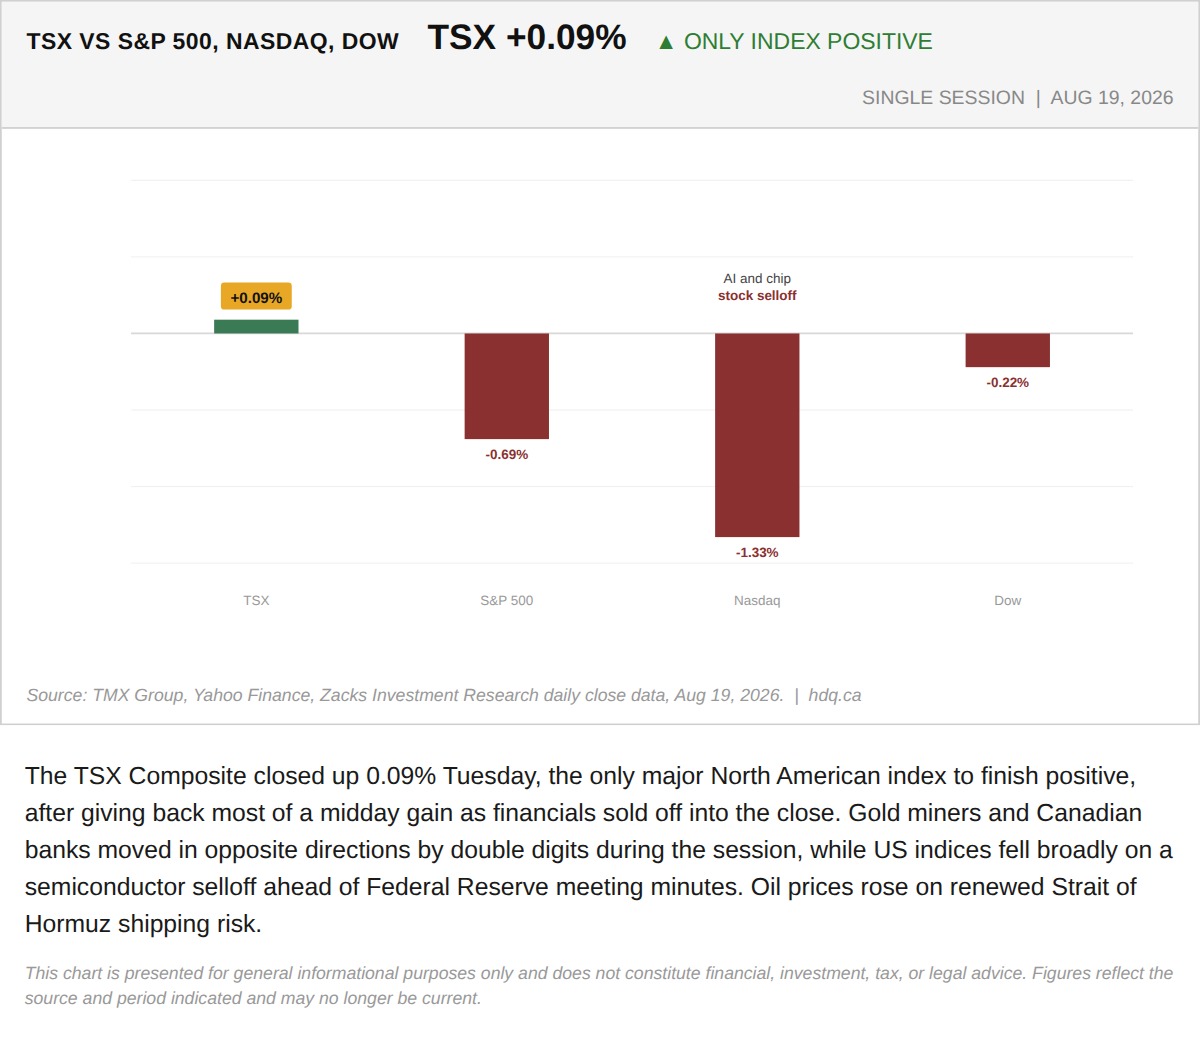
The TSX Composite closed up 0.09% Tuesday, the only major North American index to finish positive, after giving back most of a midday gain as financials sold off into the close.
The TSX Gave Back a 127-Point Tariff Rally as Financials Sold Off Into the Close
August 19, 2026
View chart & download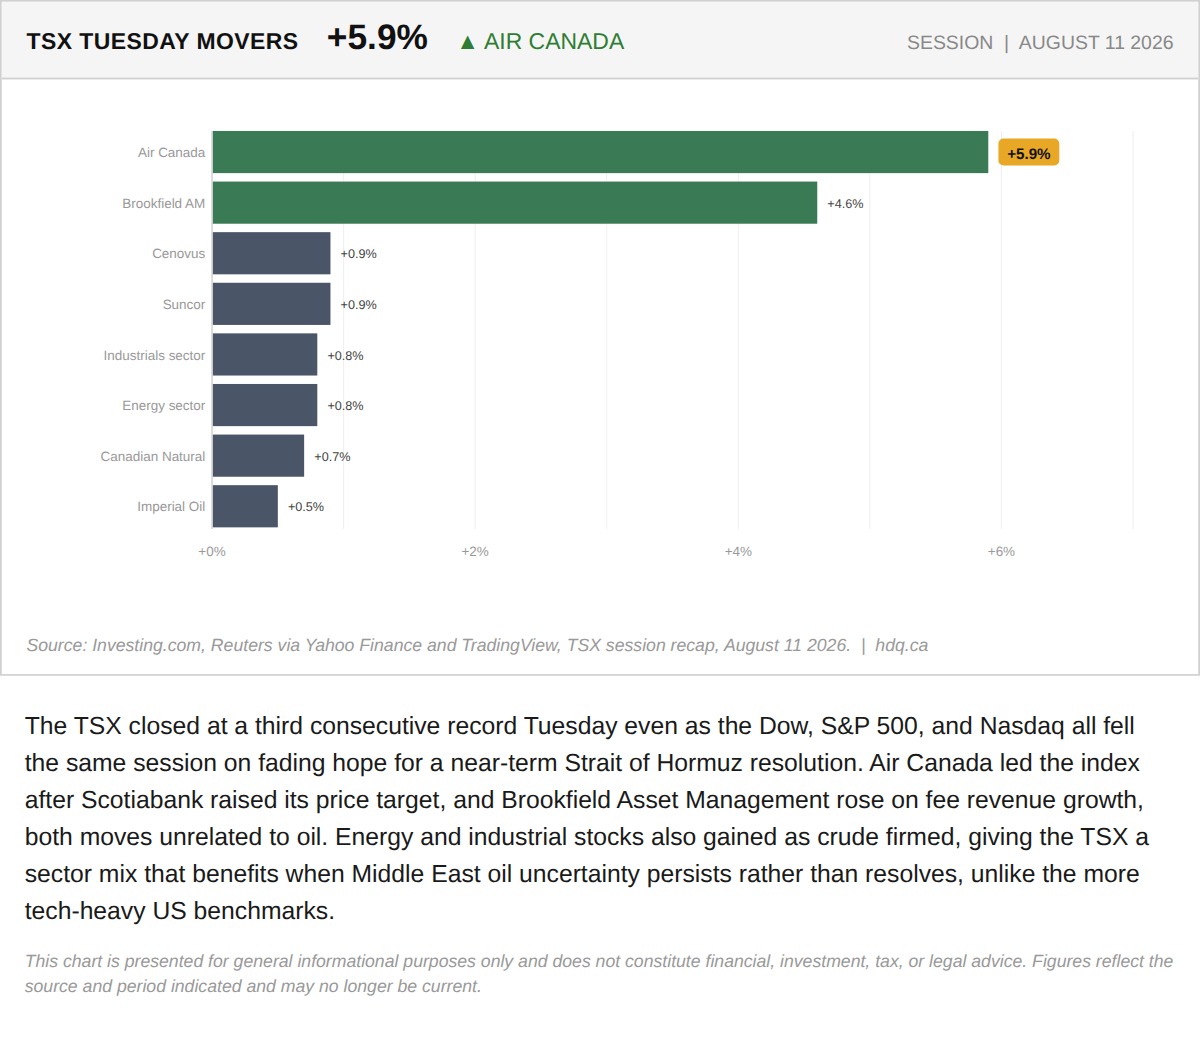
The TSX closed at a third consecutive record Tuesday even as the Dow, S&P 500, and Nasdaq all fell the same session on fading hope for a near-term Strait of Hormuz resolution.
The TSX Hit a Third Straight Record. Every Major US Index Fell the Same Day.
August 12, 2026
View chart & download