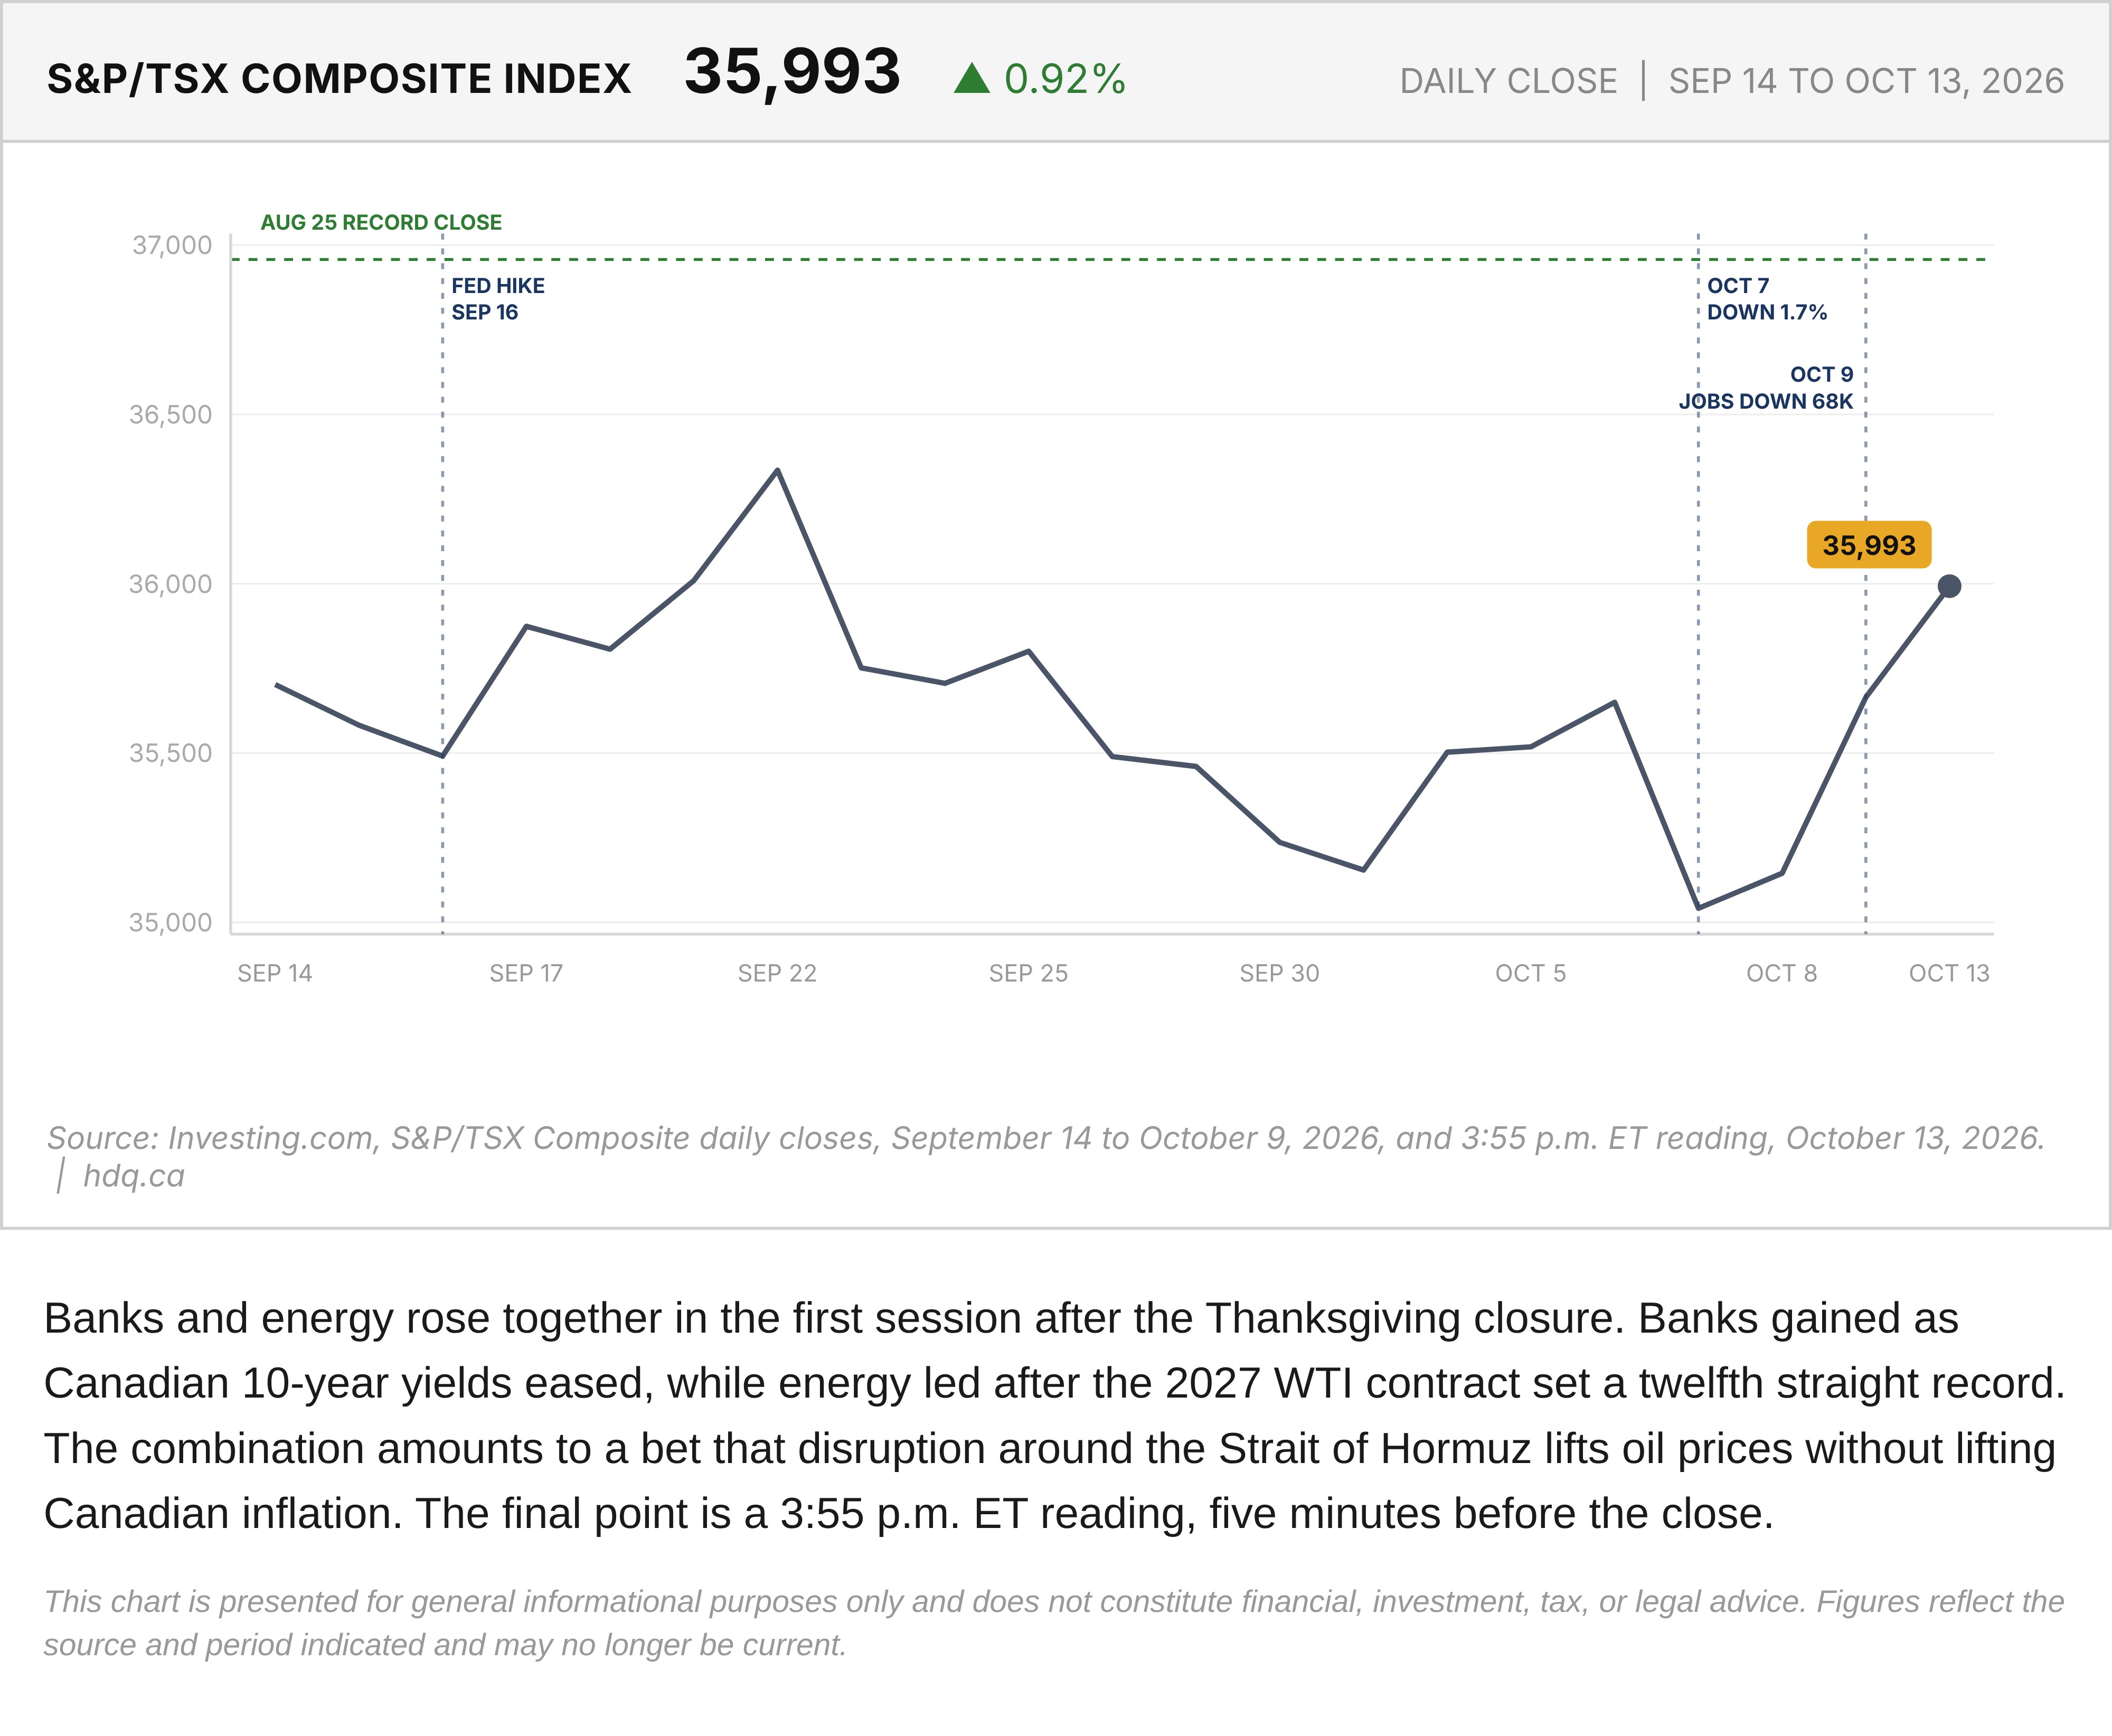
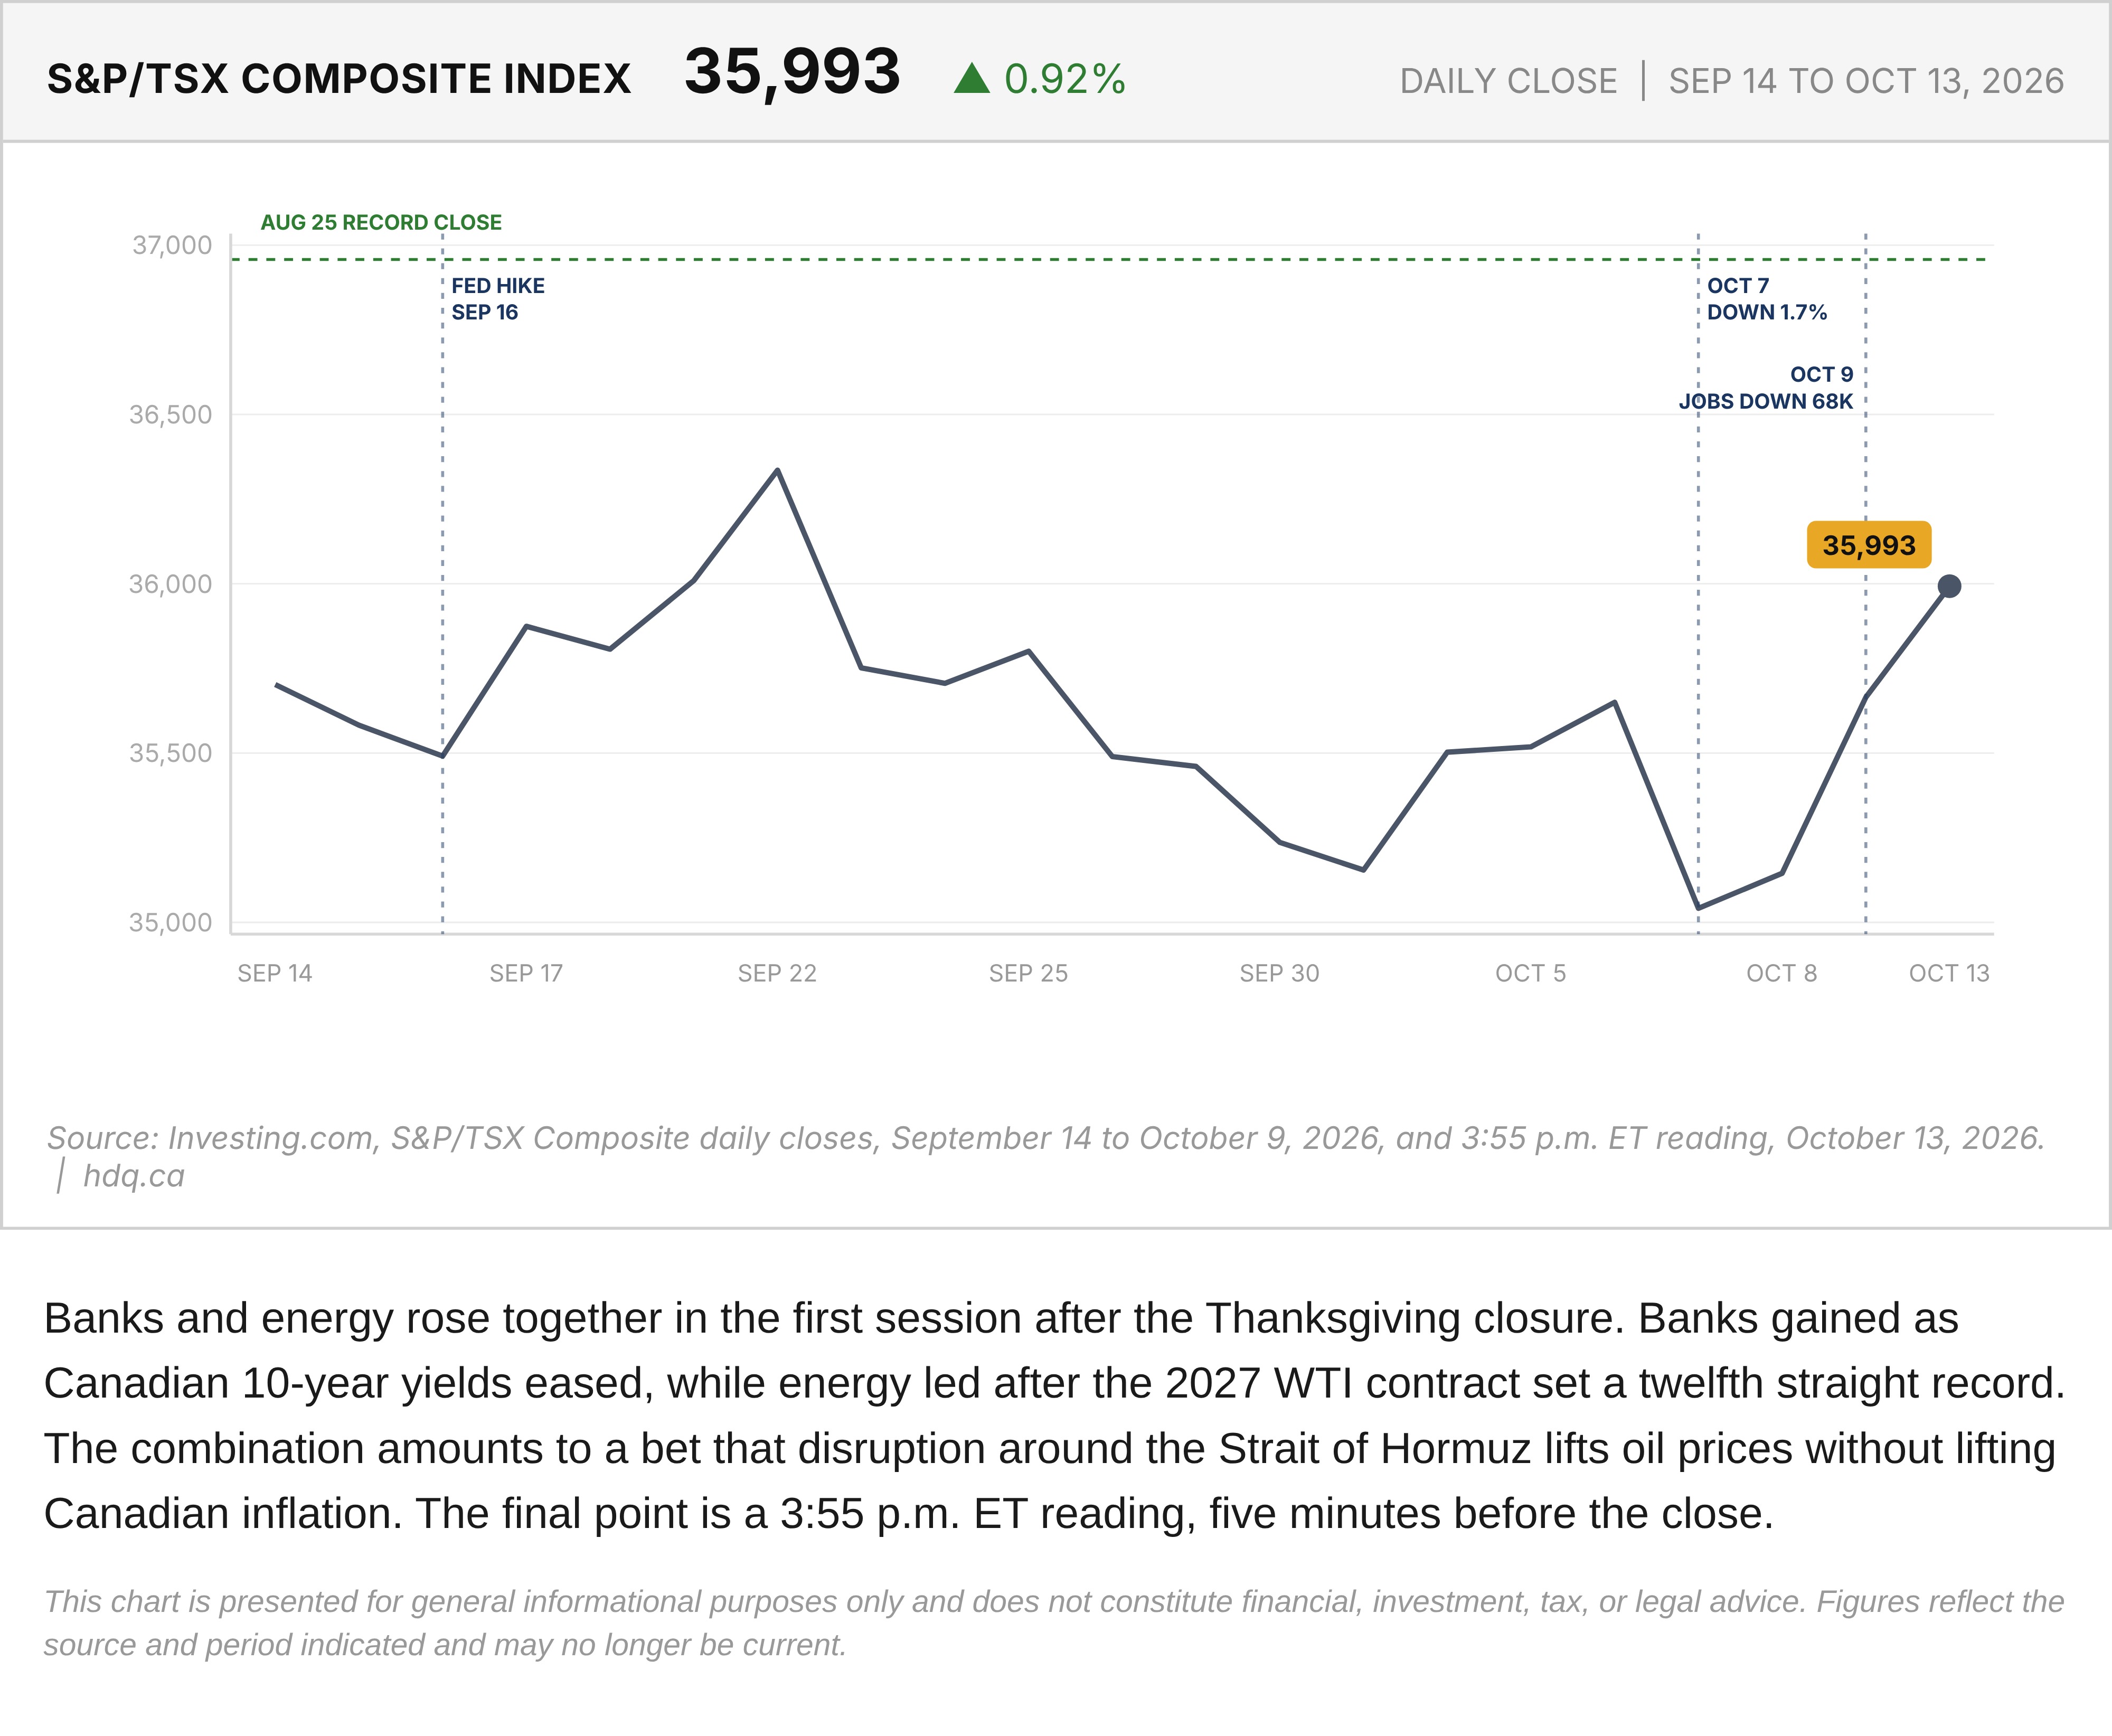
Banks and energy rose together in the first session after the Thanksgiving closure. Banks gained as Canadian 10-year yields eased, while energy led after the 2027 WTI contract set a twelfth straight record. The combination amounts to a bet that disruption around the Strait of Hormuz lifts oil prices without lifting Canadian inflation. The final point is a 3:55 p.m. ET reading, five minutes before the close.
This chart is presented for general informational purposes only and does not constitute financial, investment, tax, or legal advice. Figures reflect the source and period indicated and may no longer be current.
Related charts
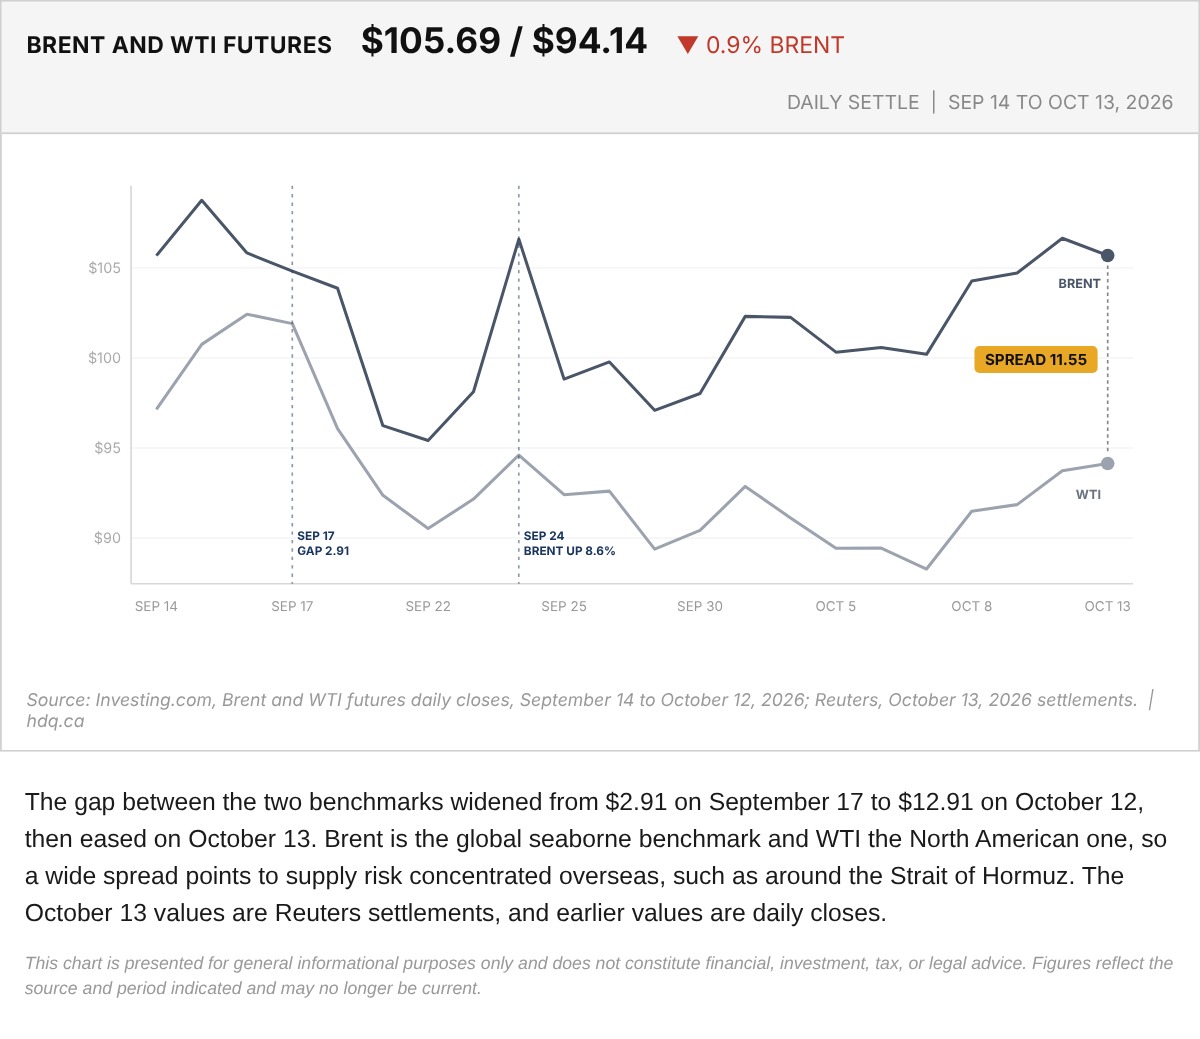
The gap between the two benchmarks widened from $2.91 on September 17 to $12.91 on October 12, then eased on October 13.
Brent and WTI Crude Oil Futures, September 14 to October 13, 2026
October 13, 2026
View chart & download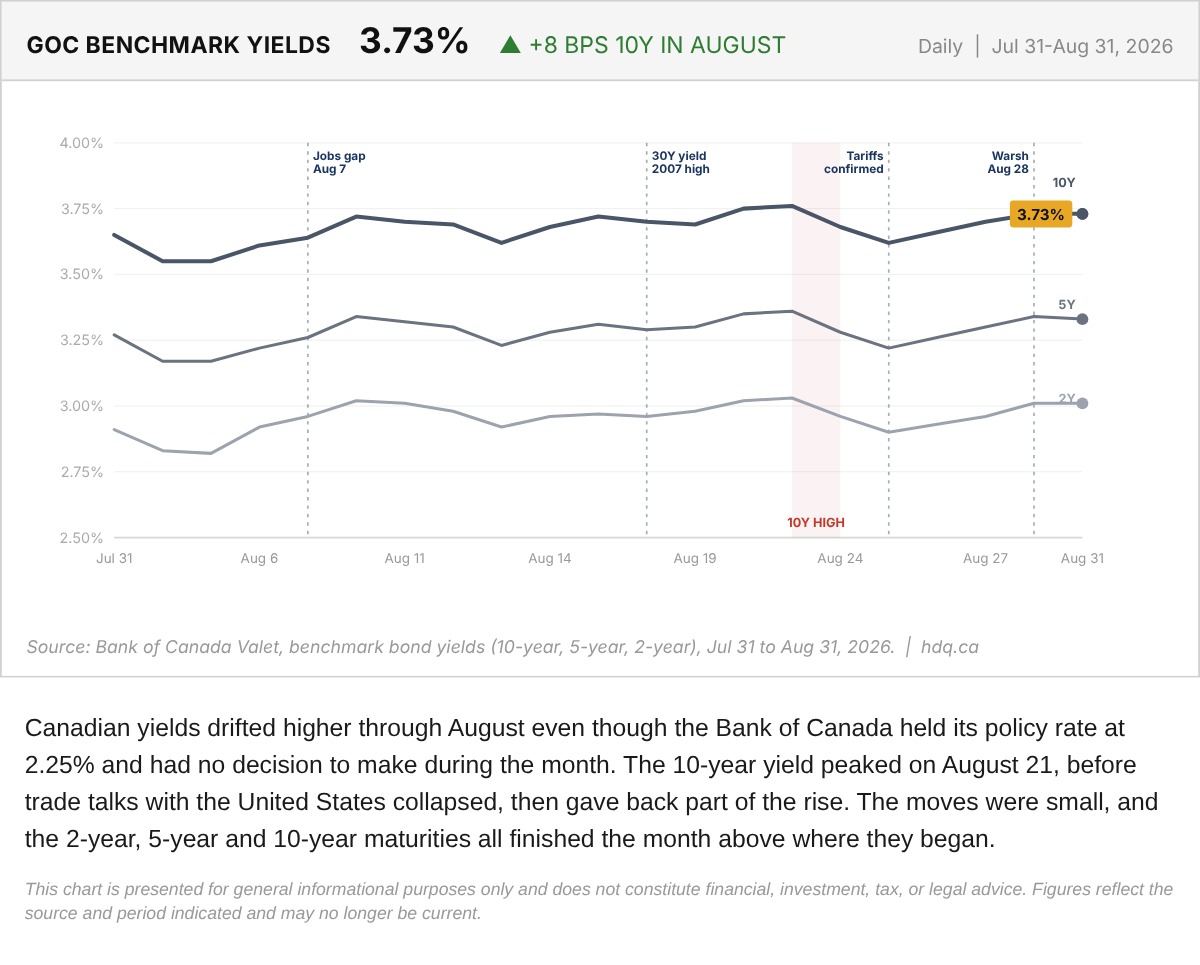
Canadian yields drifted higher through August even though the Bank of Canada held its policy rate at 2.25% and had no decision to make during the month.
Government of Canada Benchmark Yields, August 2026
August 31, 2026
View chart & download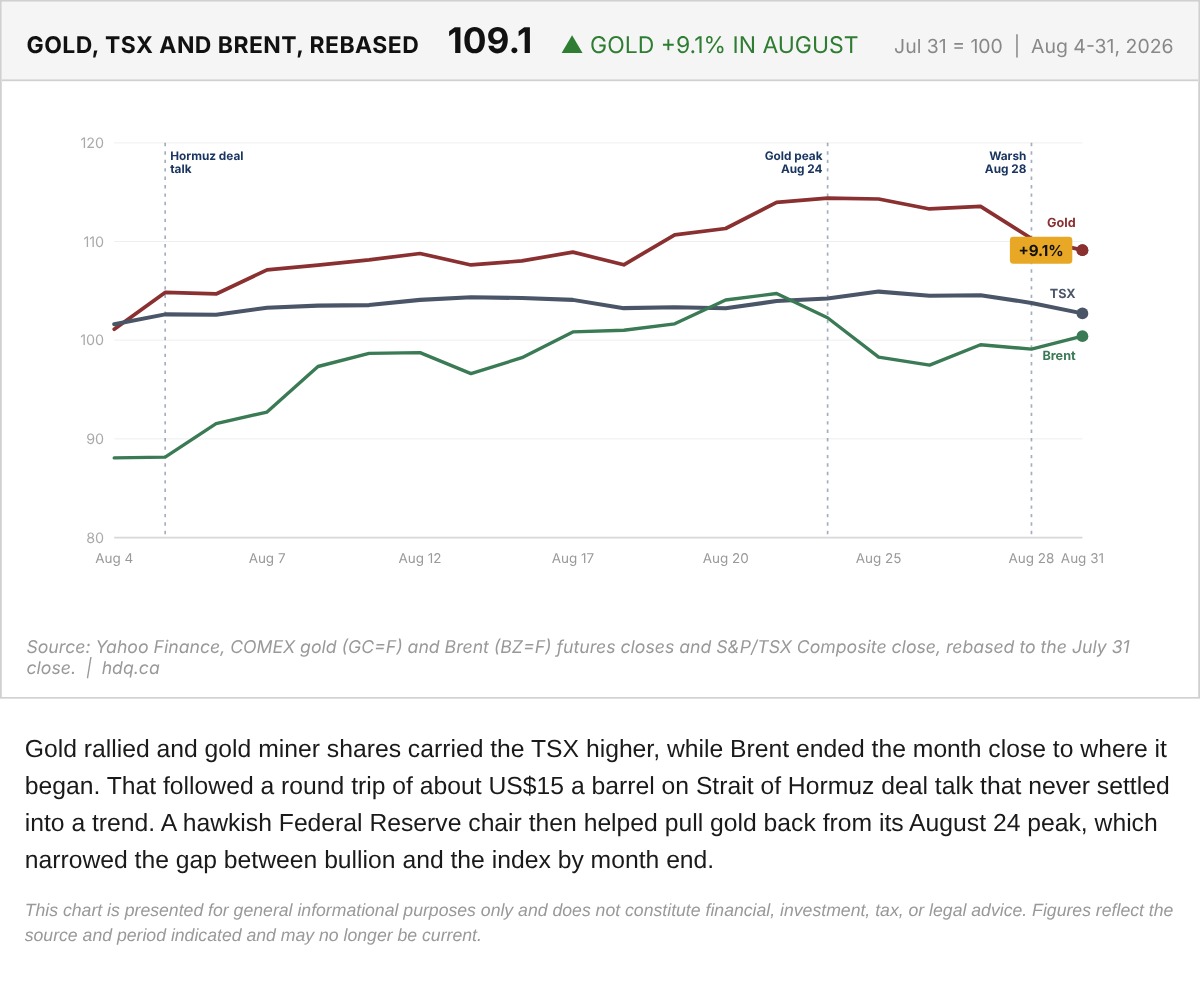
Gold rallied and gold miner shares carried the TSX higher, while Brent ended the month close to where it began.
Gold, TSX and Brent Rebased to the July 31 Close
August 31, 2026
View chart & download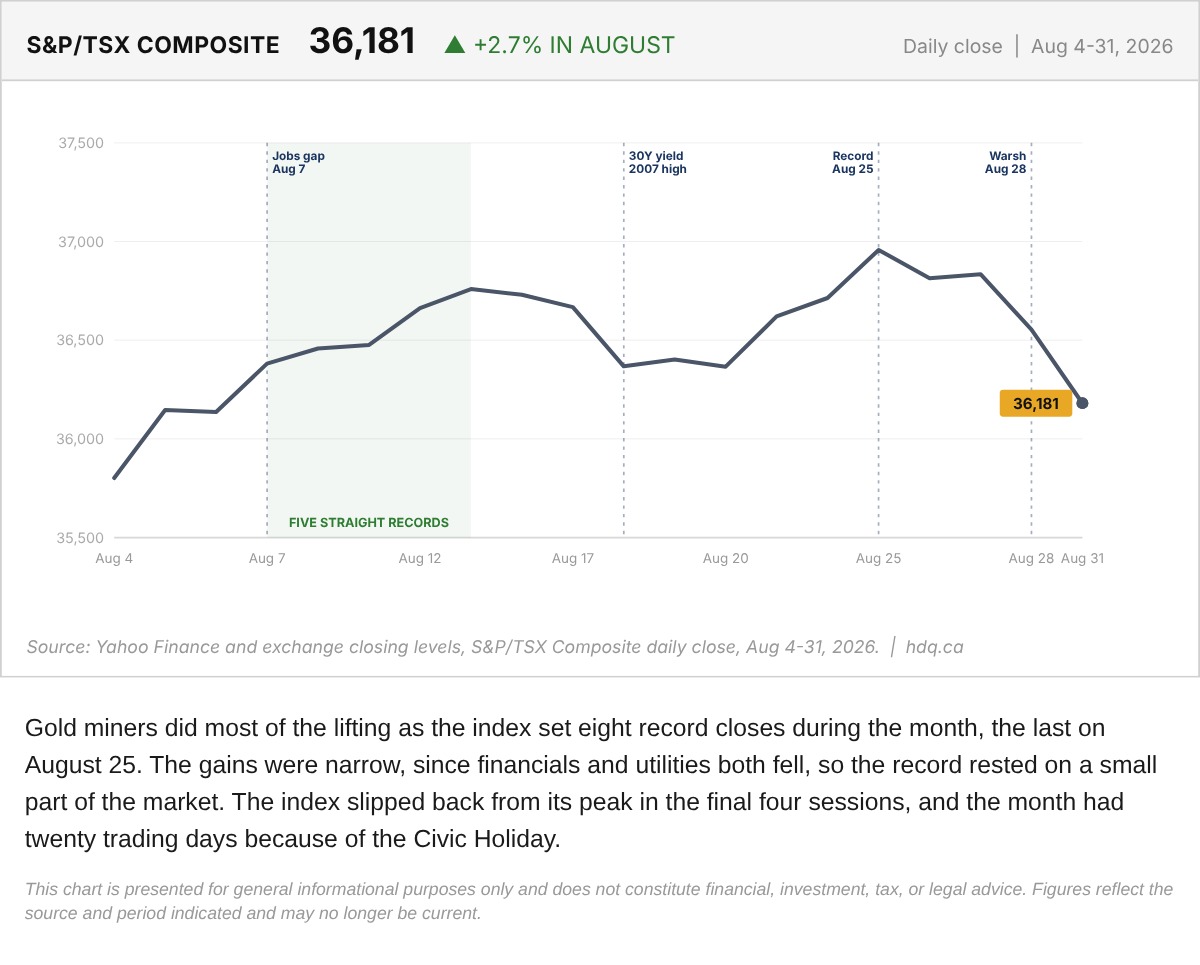
Gold miners did most of the lifting as the index set eight record closes during the month, the last on August 25.
S&P/TSX Composite Daily Close Through August 2026
August 31, 2026
View chart & download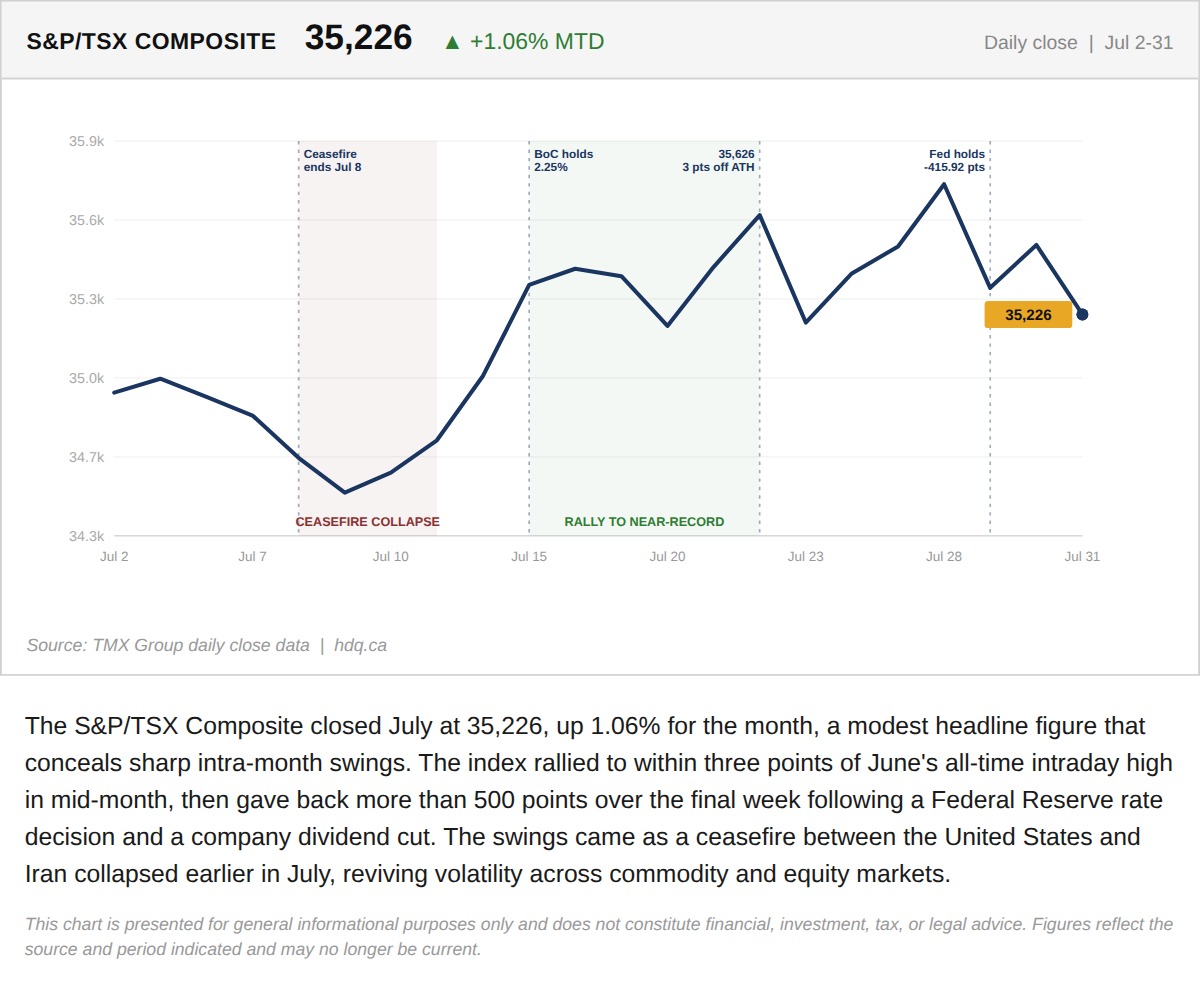
The S&P/TSX Composite closed July at 35,226, up 1.06% for the month, a modest headline figure that conceals sharp intra-month swings.
S&P/TSX Composite closes July up 1.06% after a volatile month
July 31, 2026
View chart & download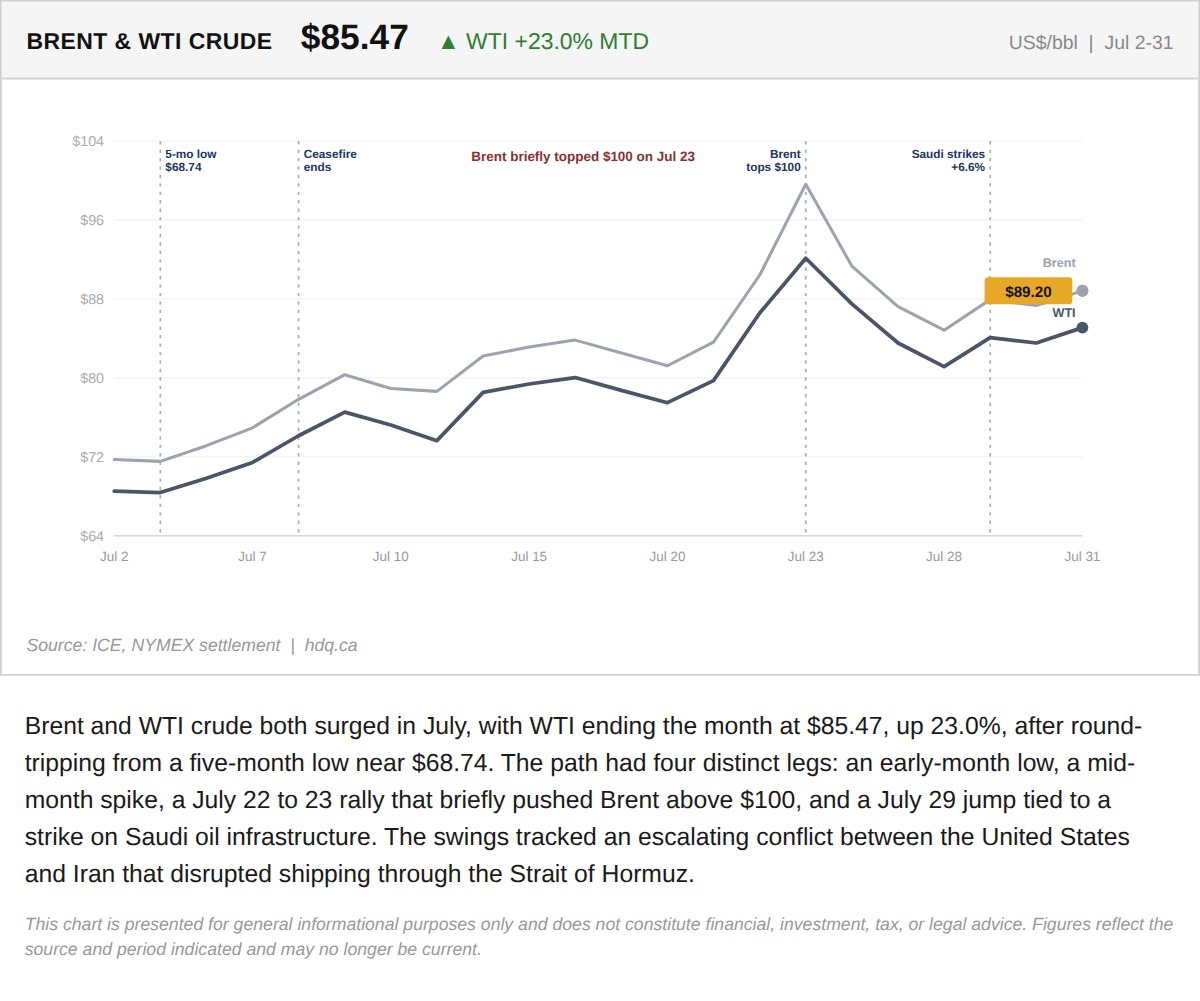
Brent and WTI crude both surged in July, with WTI ending the month at $85.47, up 23.0%, after round-tripping from a five-month low near $68.74.
WTI and Brent crude surge in July as the Iran ceasefire collapses
July 31, 2026
View chart & download