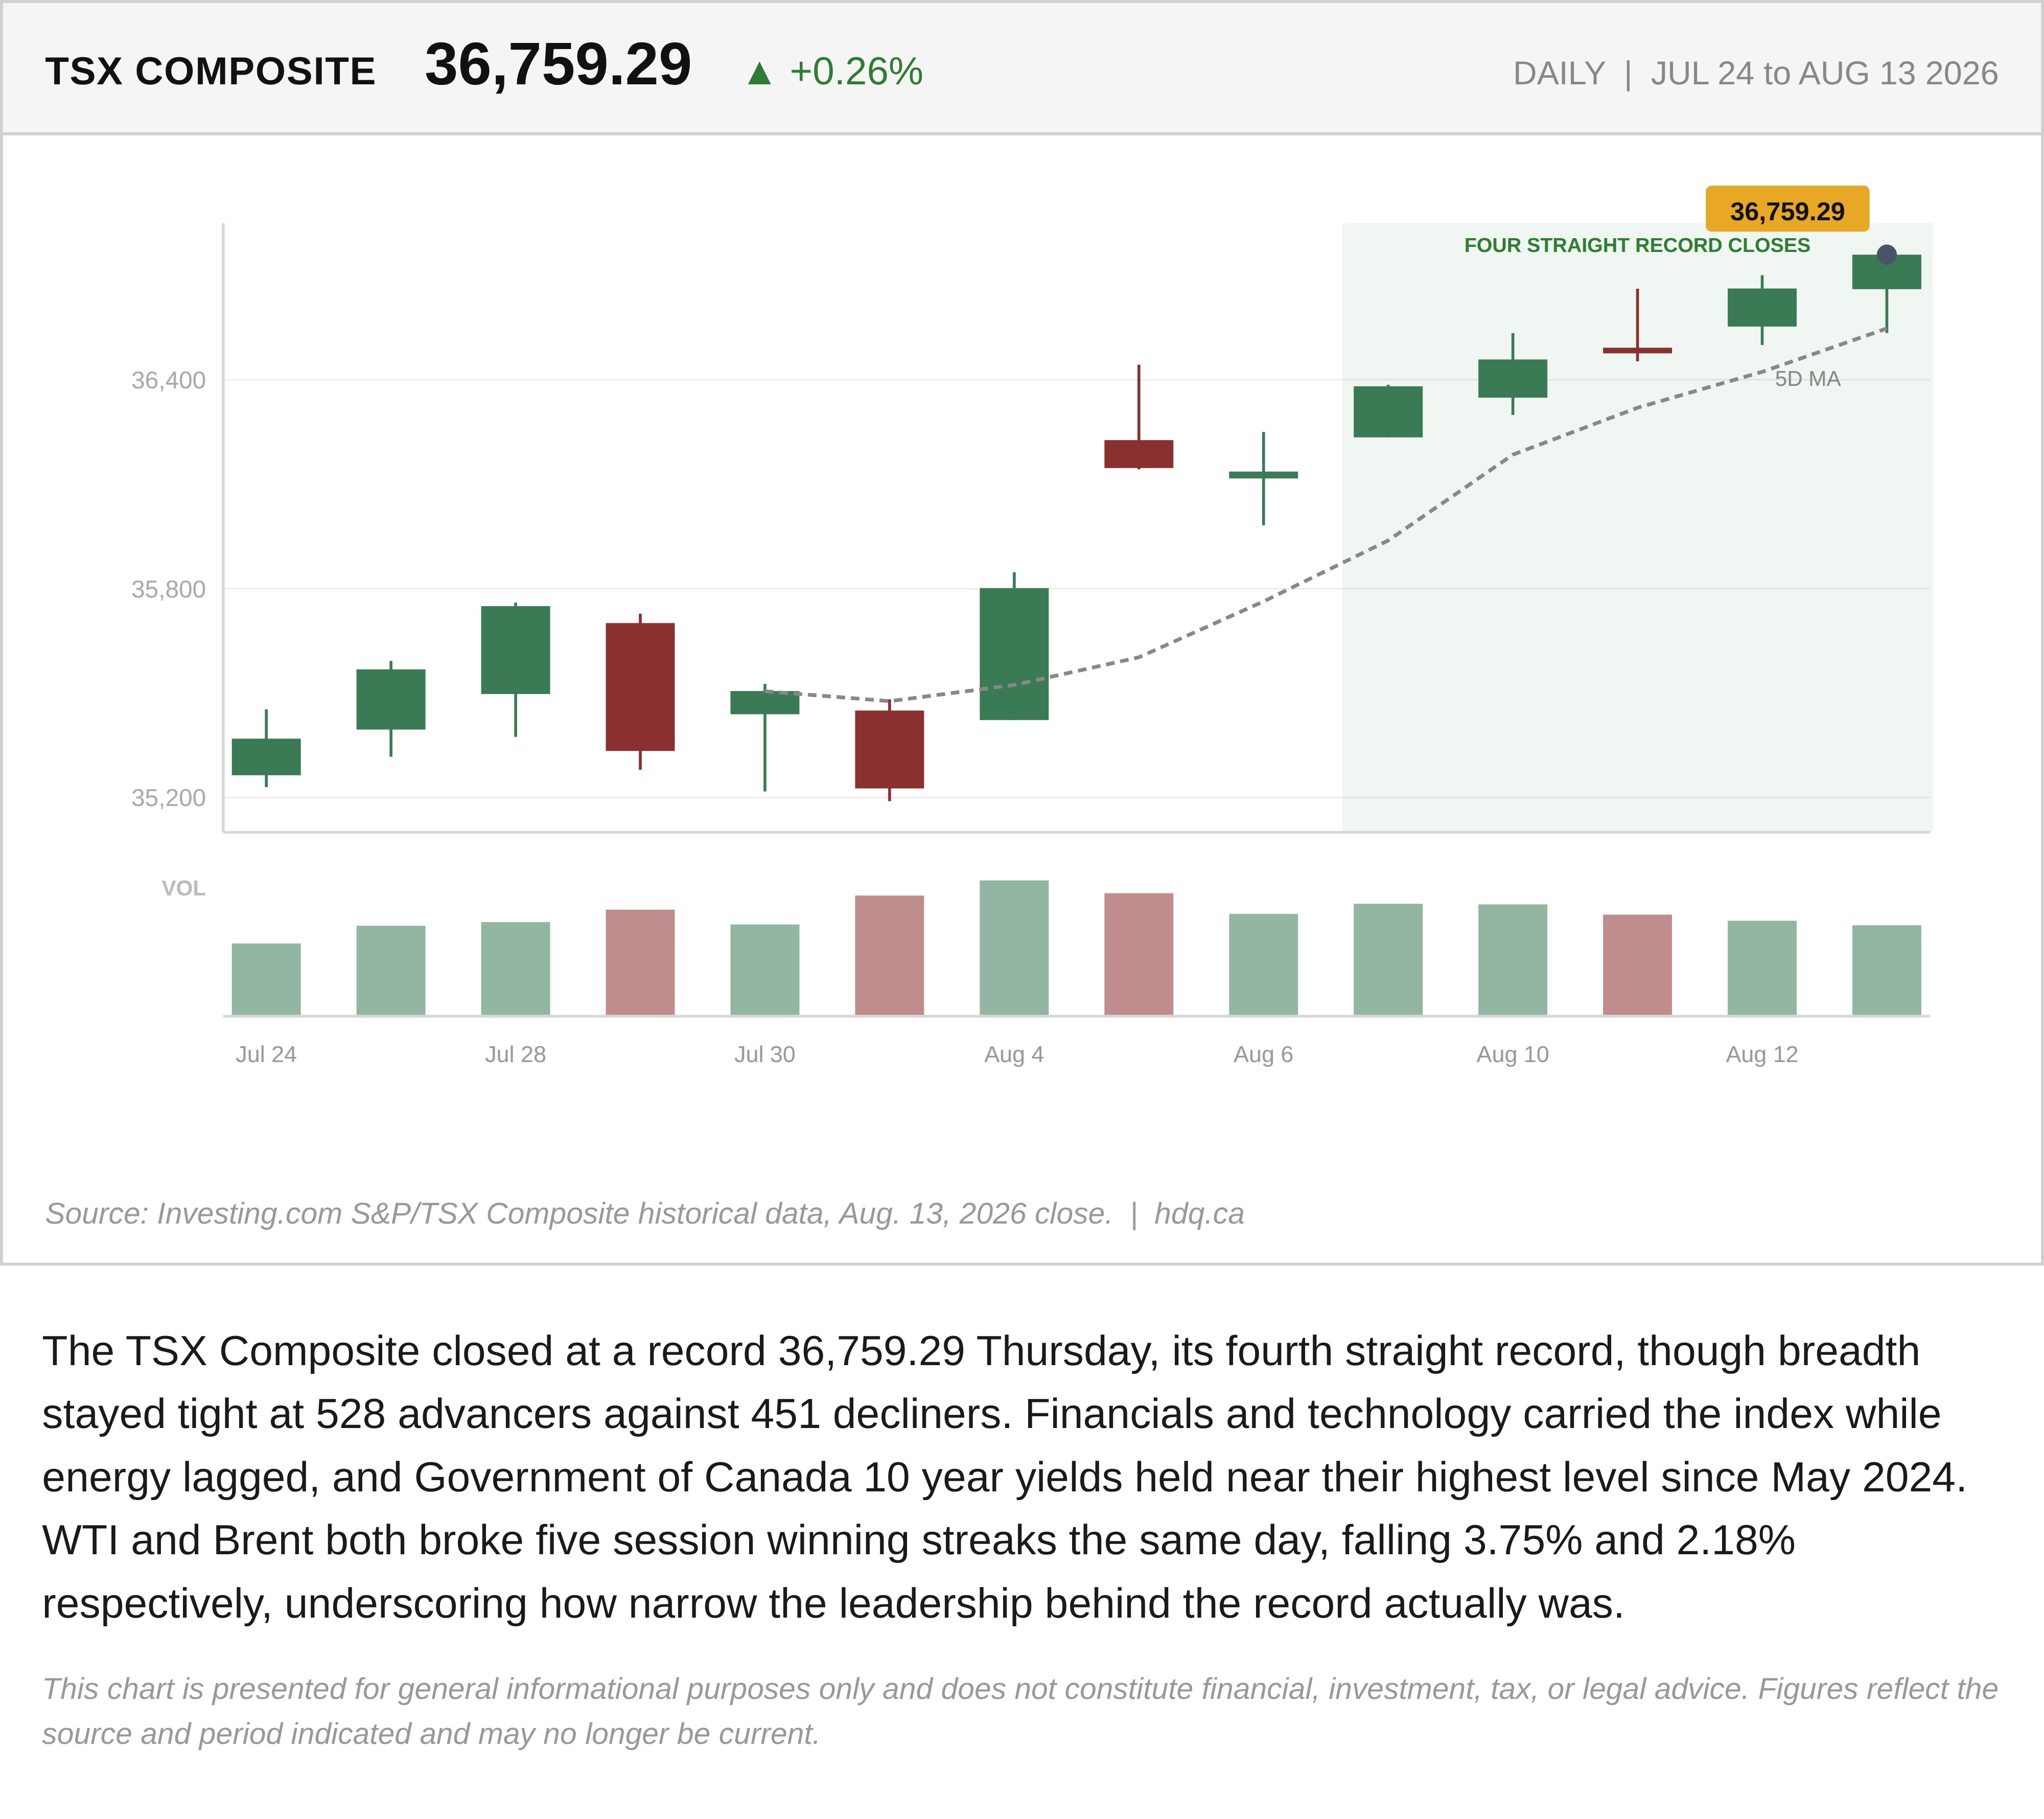
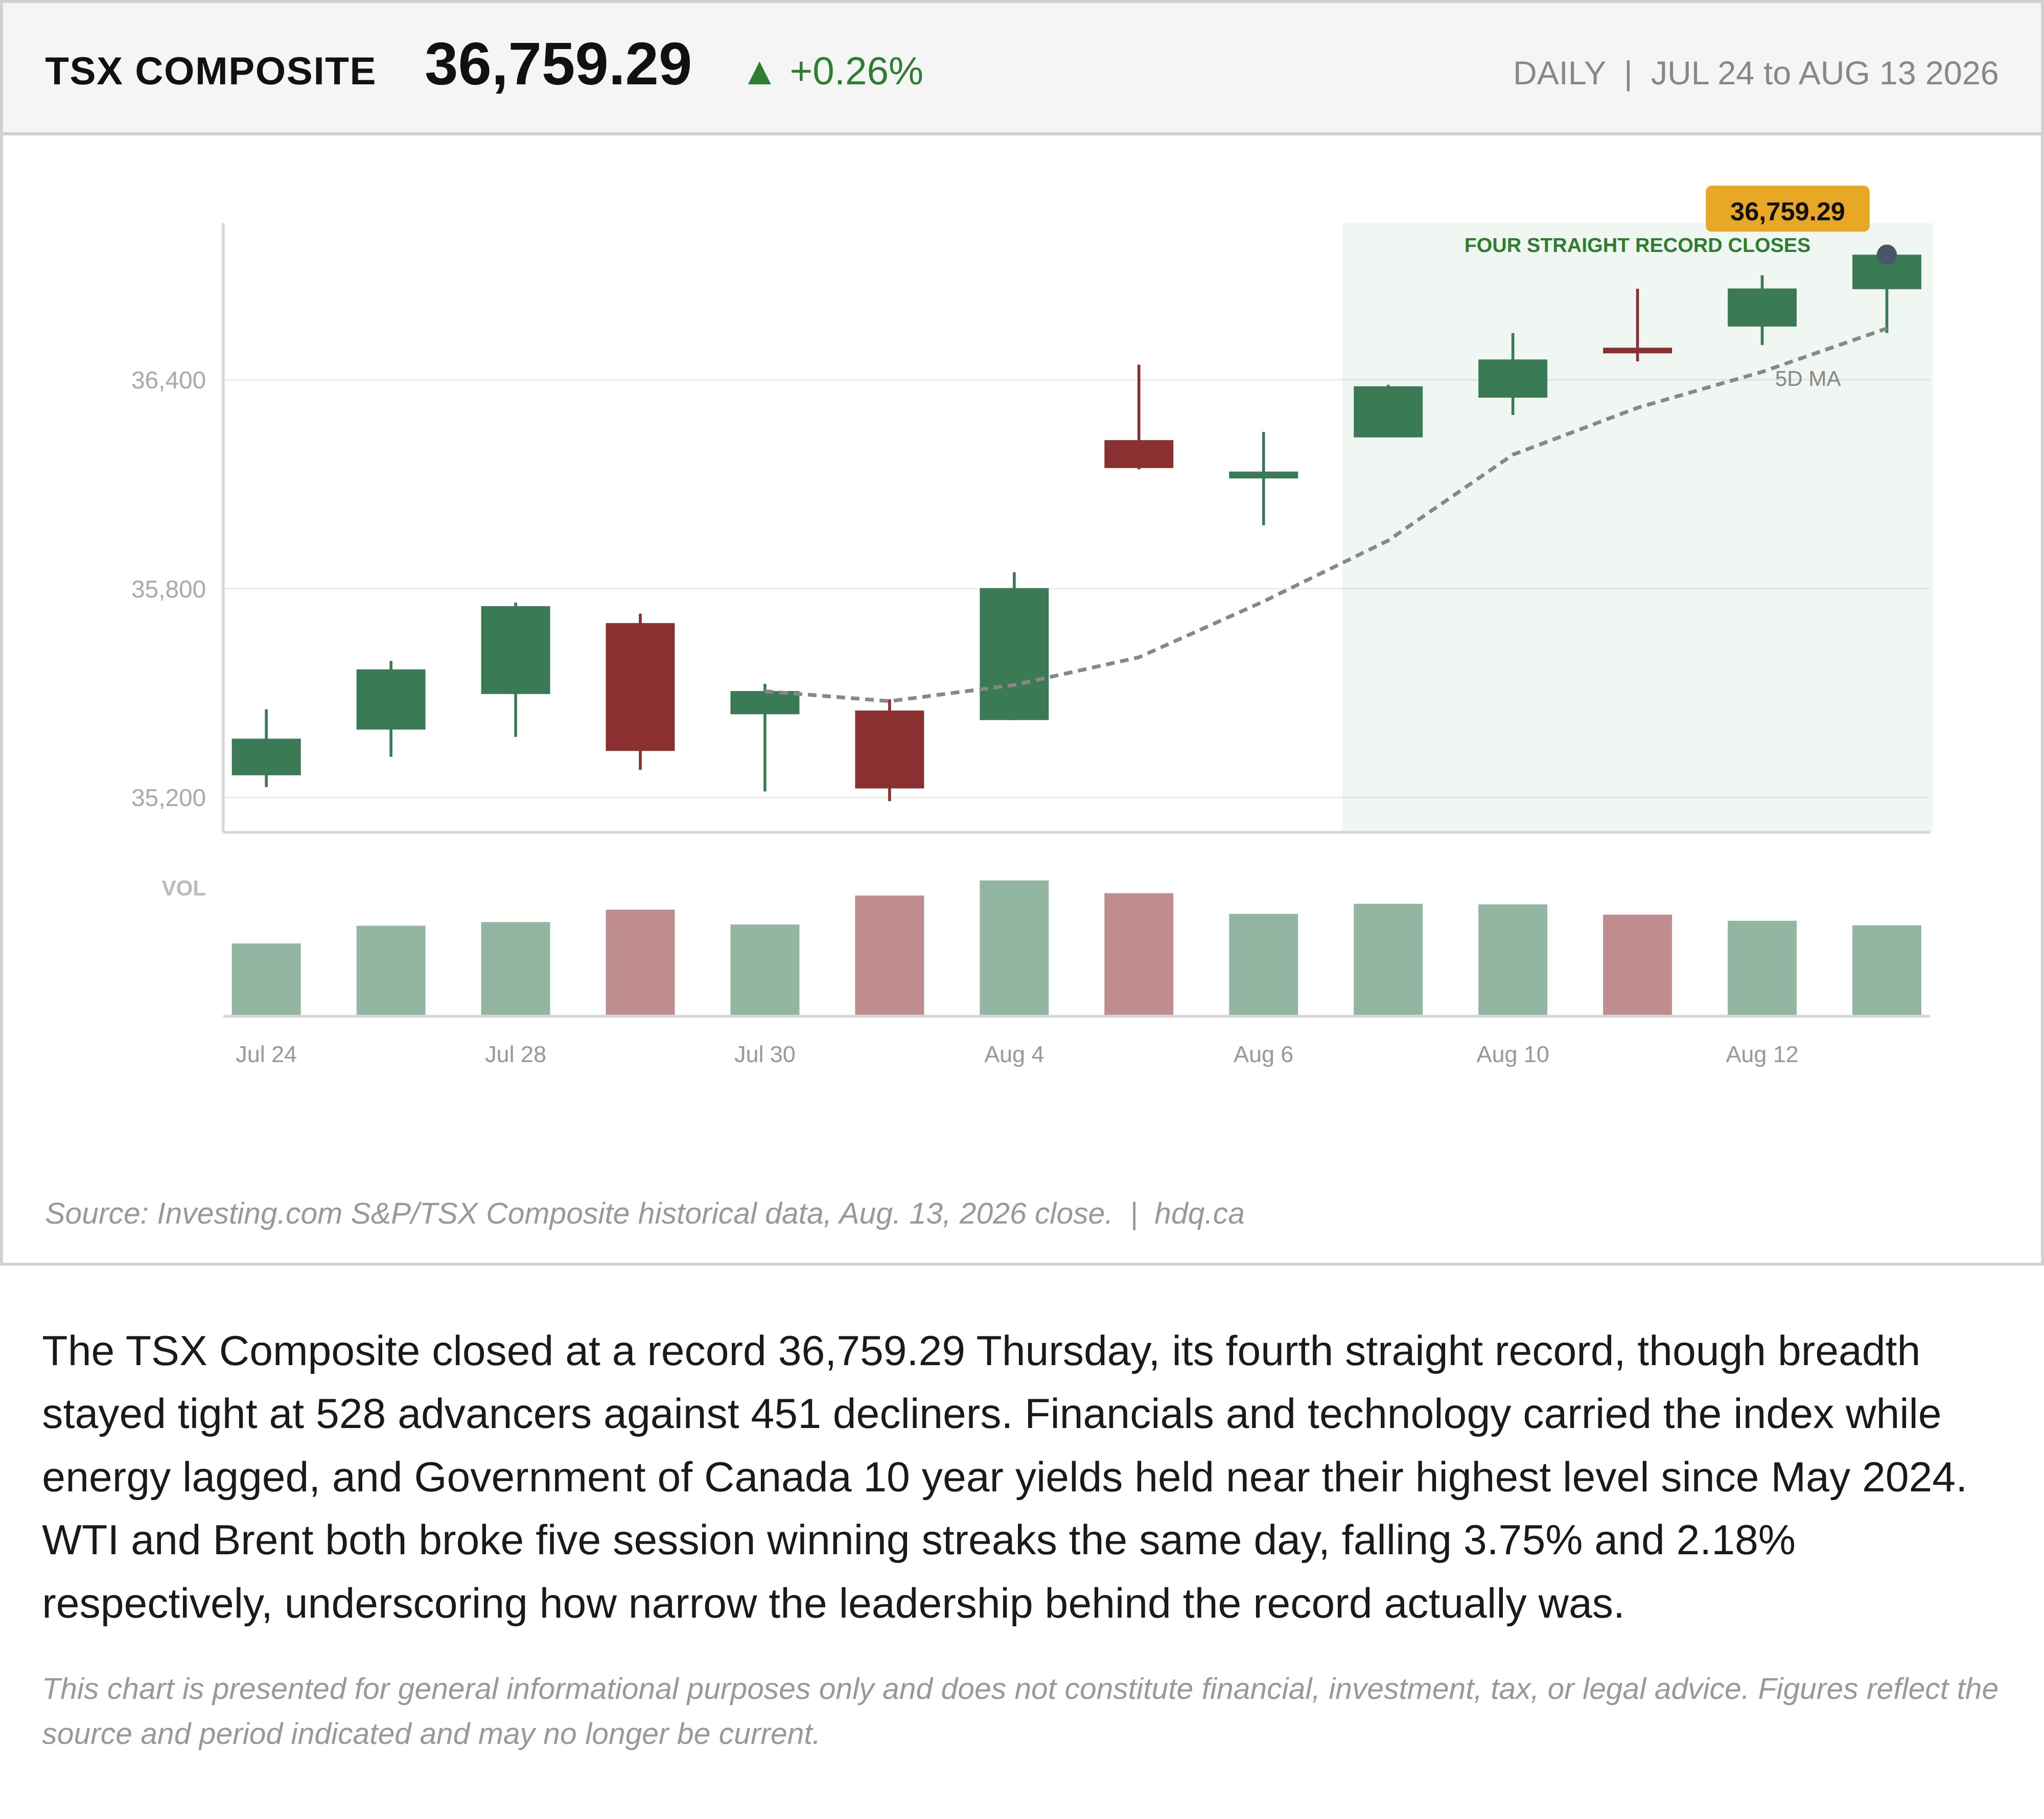
The TSX Composite closed at a record 36,759.29 Thursday, its fourth straight record, though breadth stayed tight at 528 advancers against 451 decliners. Financials and technology carried the index while energy lagged, and Government of Canada 10 year yields held near their highest level since May 2024. WTI and Brent both broke five session winning streaks the same day, falling 3.75% and 2.18% respectively, underscoring how narrow the leadership behind the record actually was.
This chart is presented for general informational purposes only and does not constitute financial, investment, tax, or legal advice. Figures reflect the source and period indicated and may no longer be current.
Related charts
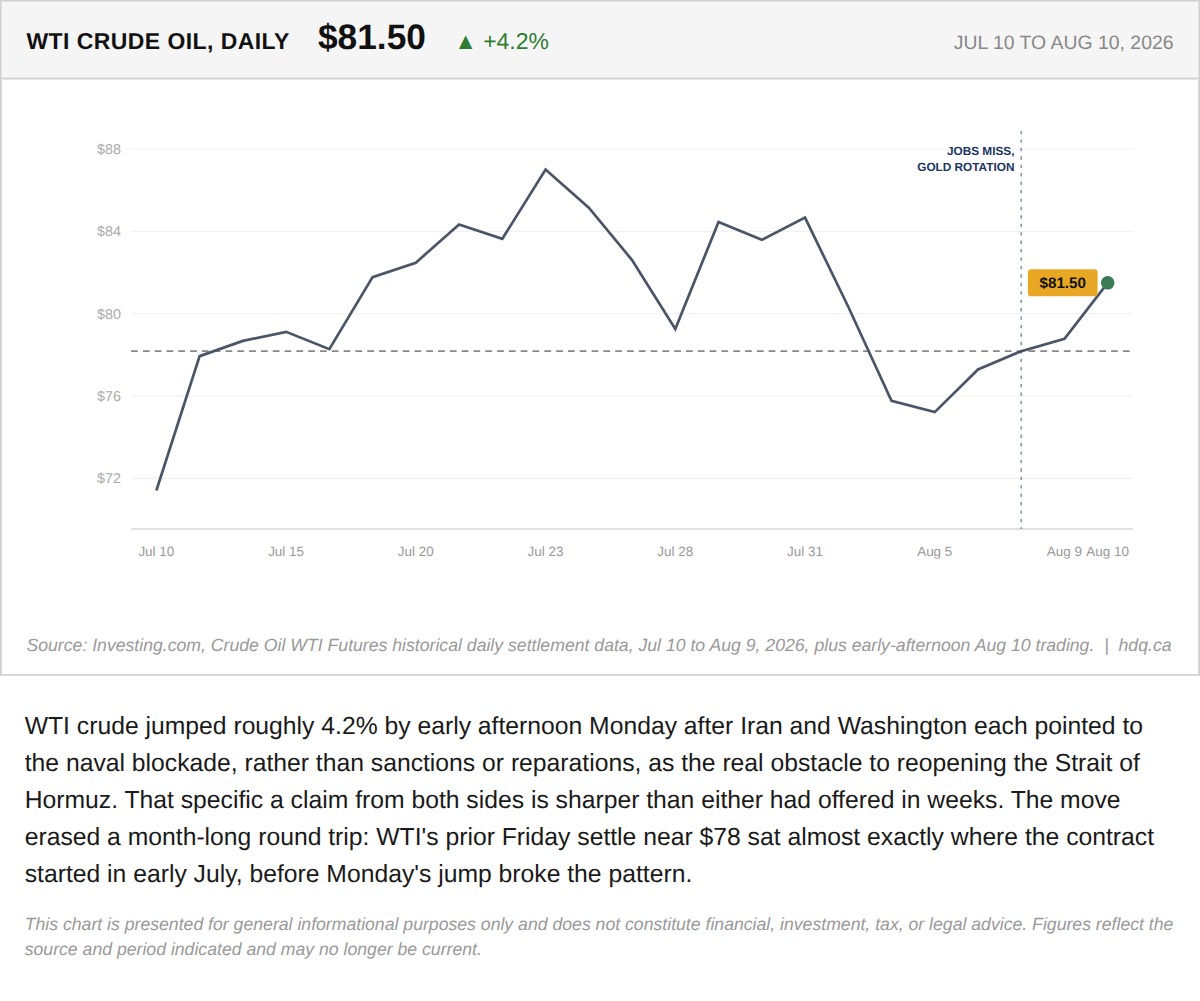
WTI crude jumped roughly 4.2% by early afternoon Monday after Iran and Washington each pointed to the naval blockade, rather than sanctions…
WTI Crude Oil Jumps as Hormuz Naval Blockade Named the Real Sticking Point
August 10, 2026
View chart & download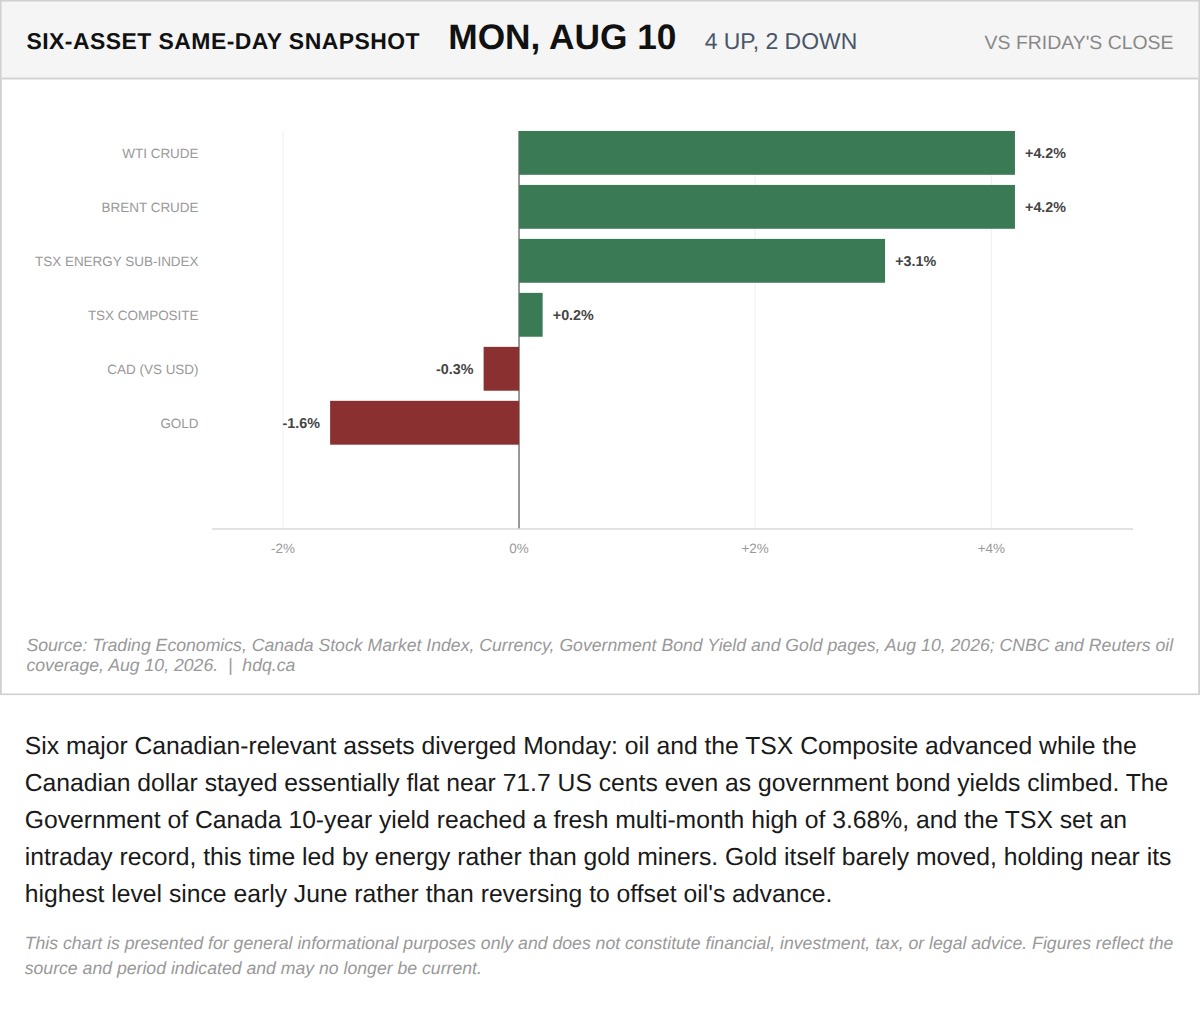
Six major Canadian-relevant assets diverged Monday: oil and the TSX Composite advanced while the Canadian dollar stayed essentially flat…
Six Assets, One Session: Oil and the TSX Rally While the Loonie and Gold Stay Flat
August 10, 2026
View chart & download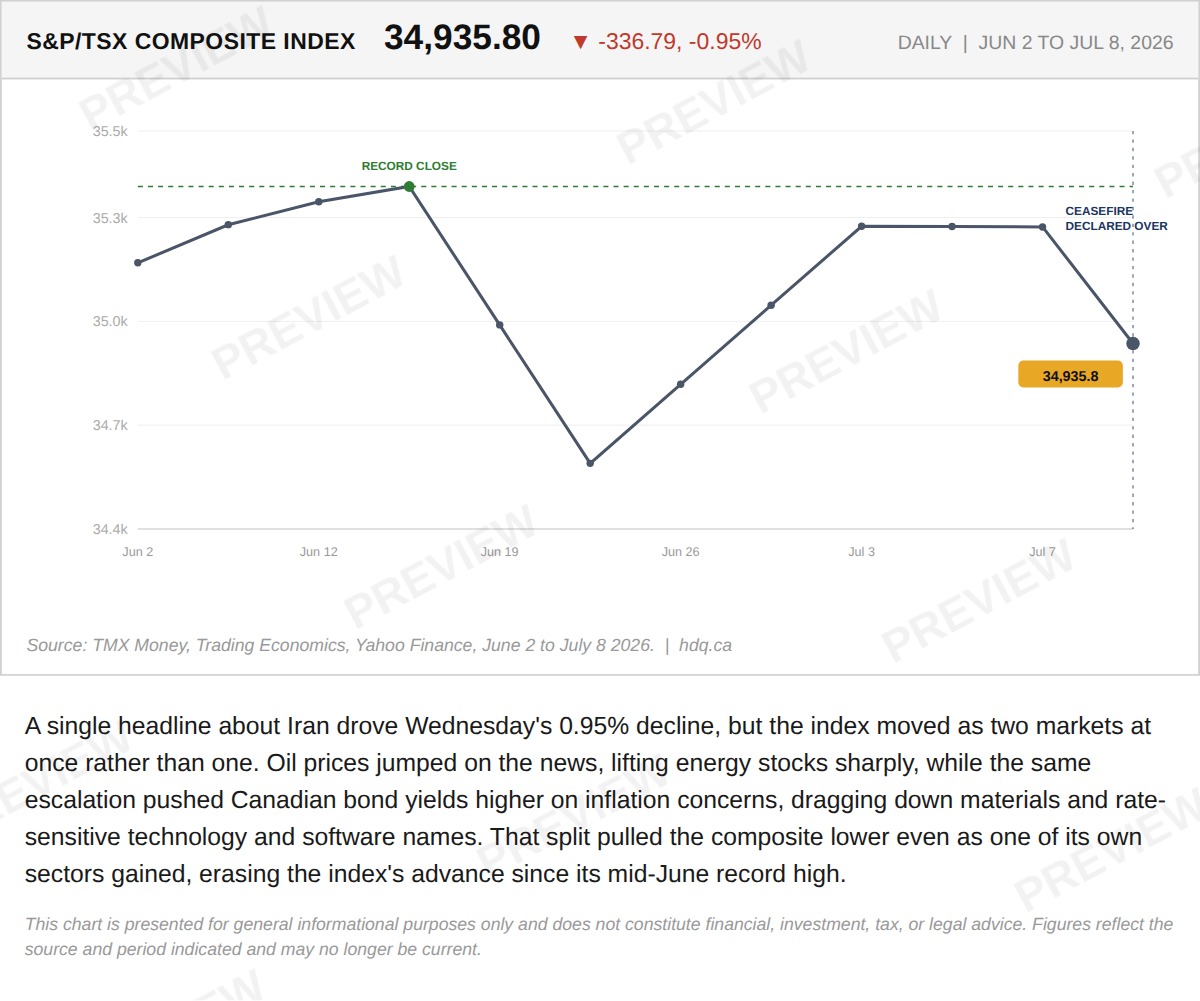
A single headline about Iran drove Wednesday's 0.95% decline, but the index moved as two markets at once rather than one.
The TSX Fell 337 Points Wednesday While Its Own Energy Sector Rose Nearly 4%
July 9, 2026
View chart & download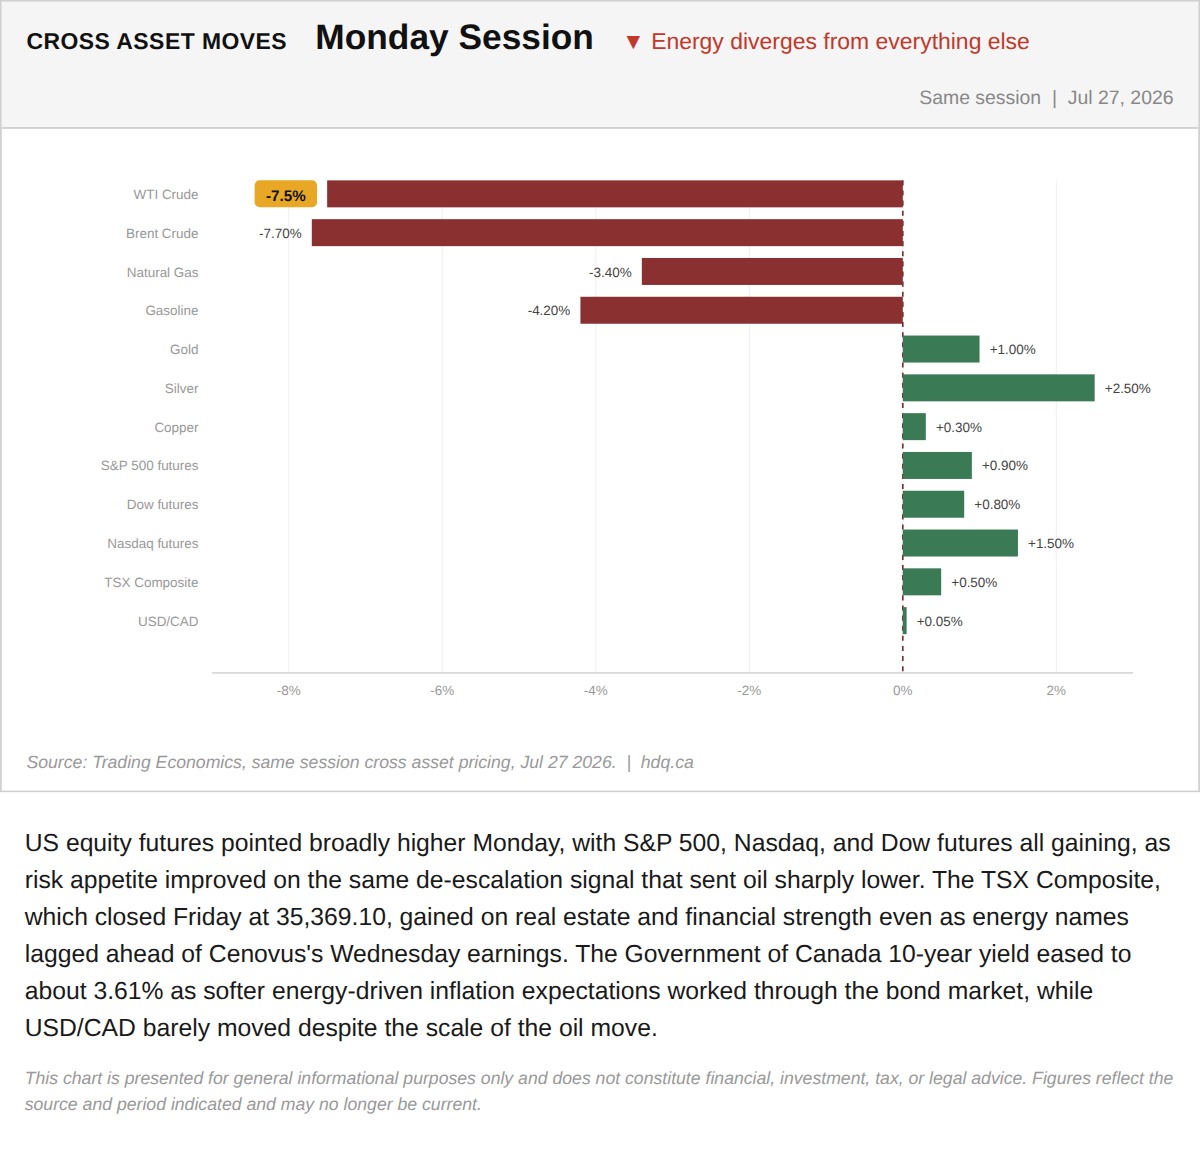
US equity futures pointed broadly higher Monday, with S&P 500, Nasdaq, and Dow futures all gaining, as risk appetite improved on the same…
Cross-Asset Moves Diverge as Energy Lags Monday's Broader Rally
July 27, 2026
View chart & download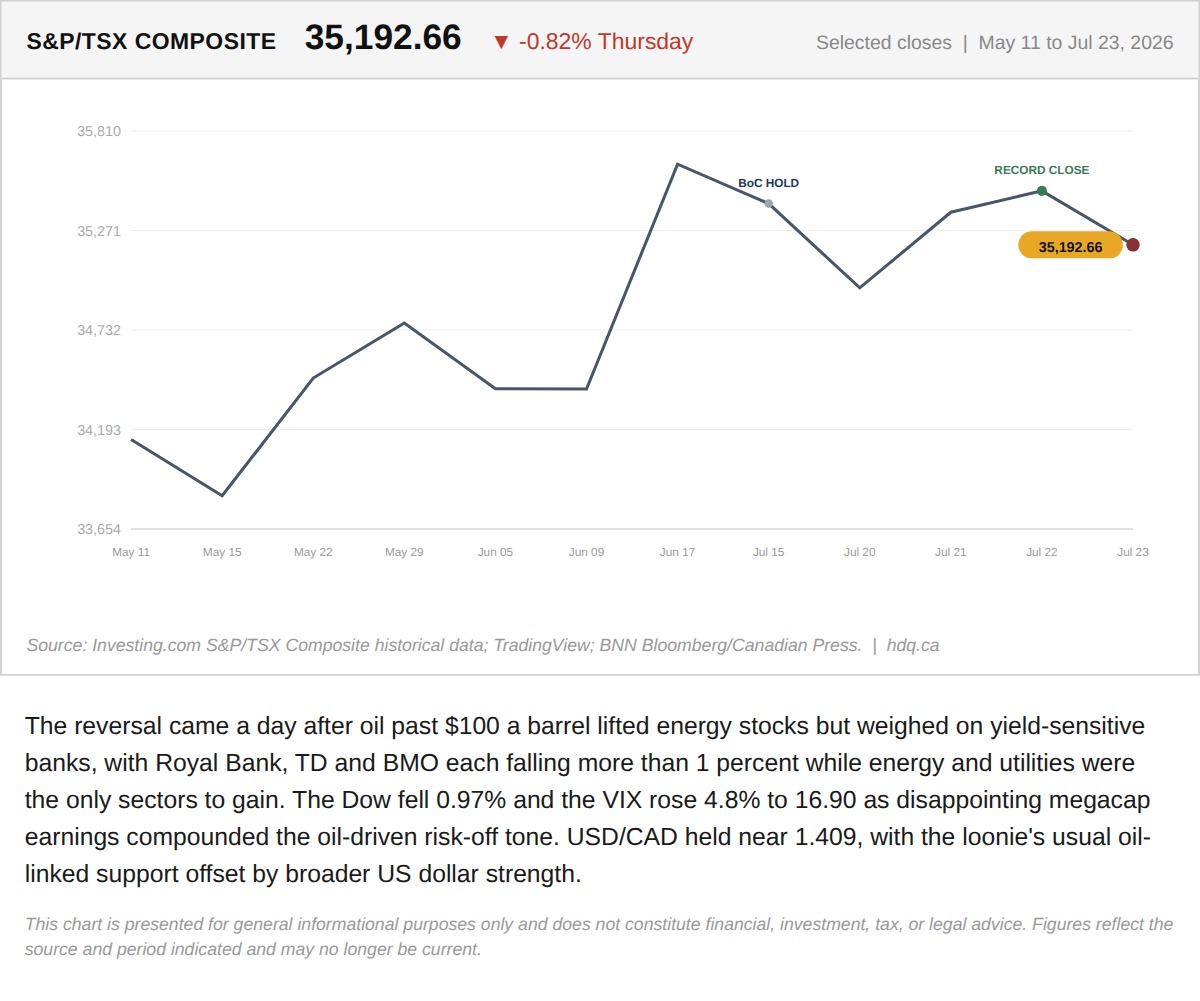
The reversal came a day after oil past $100 a barrel lifted energy stocks but weighed on yield-sensitive banks, with Royal Bank, TD and BMO…
Record High, Then a Bank-Led Reversal: Inside Thursday's TSX Split
July 24, 2026
View chart & download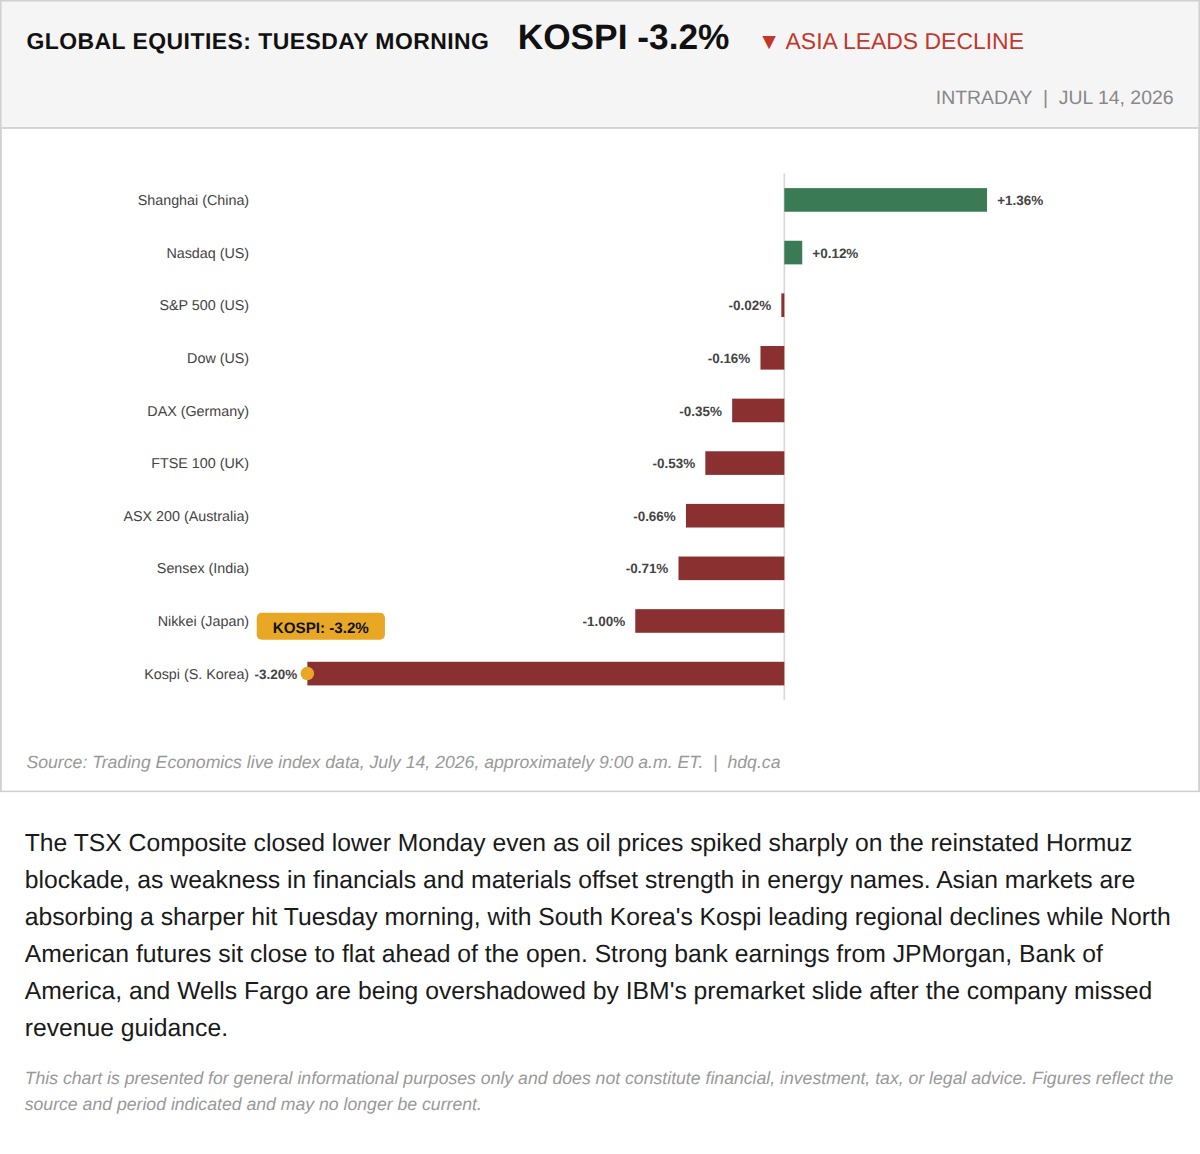
The TSX Composite closed lower Monday even as oil prices spiked sharply on the reinstated Hormuz blockade, as weakness in financials and materials offset strength in energy names.
Oil Jumped 9.6% Monday. The TSX Still Closed Lower.
July 14, 2026
View chart & download