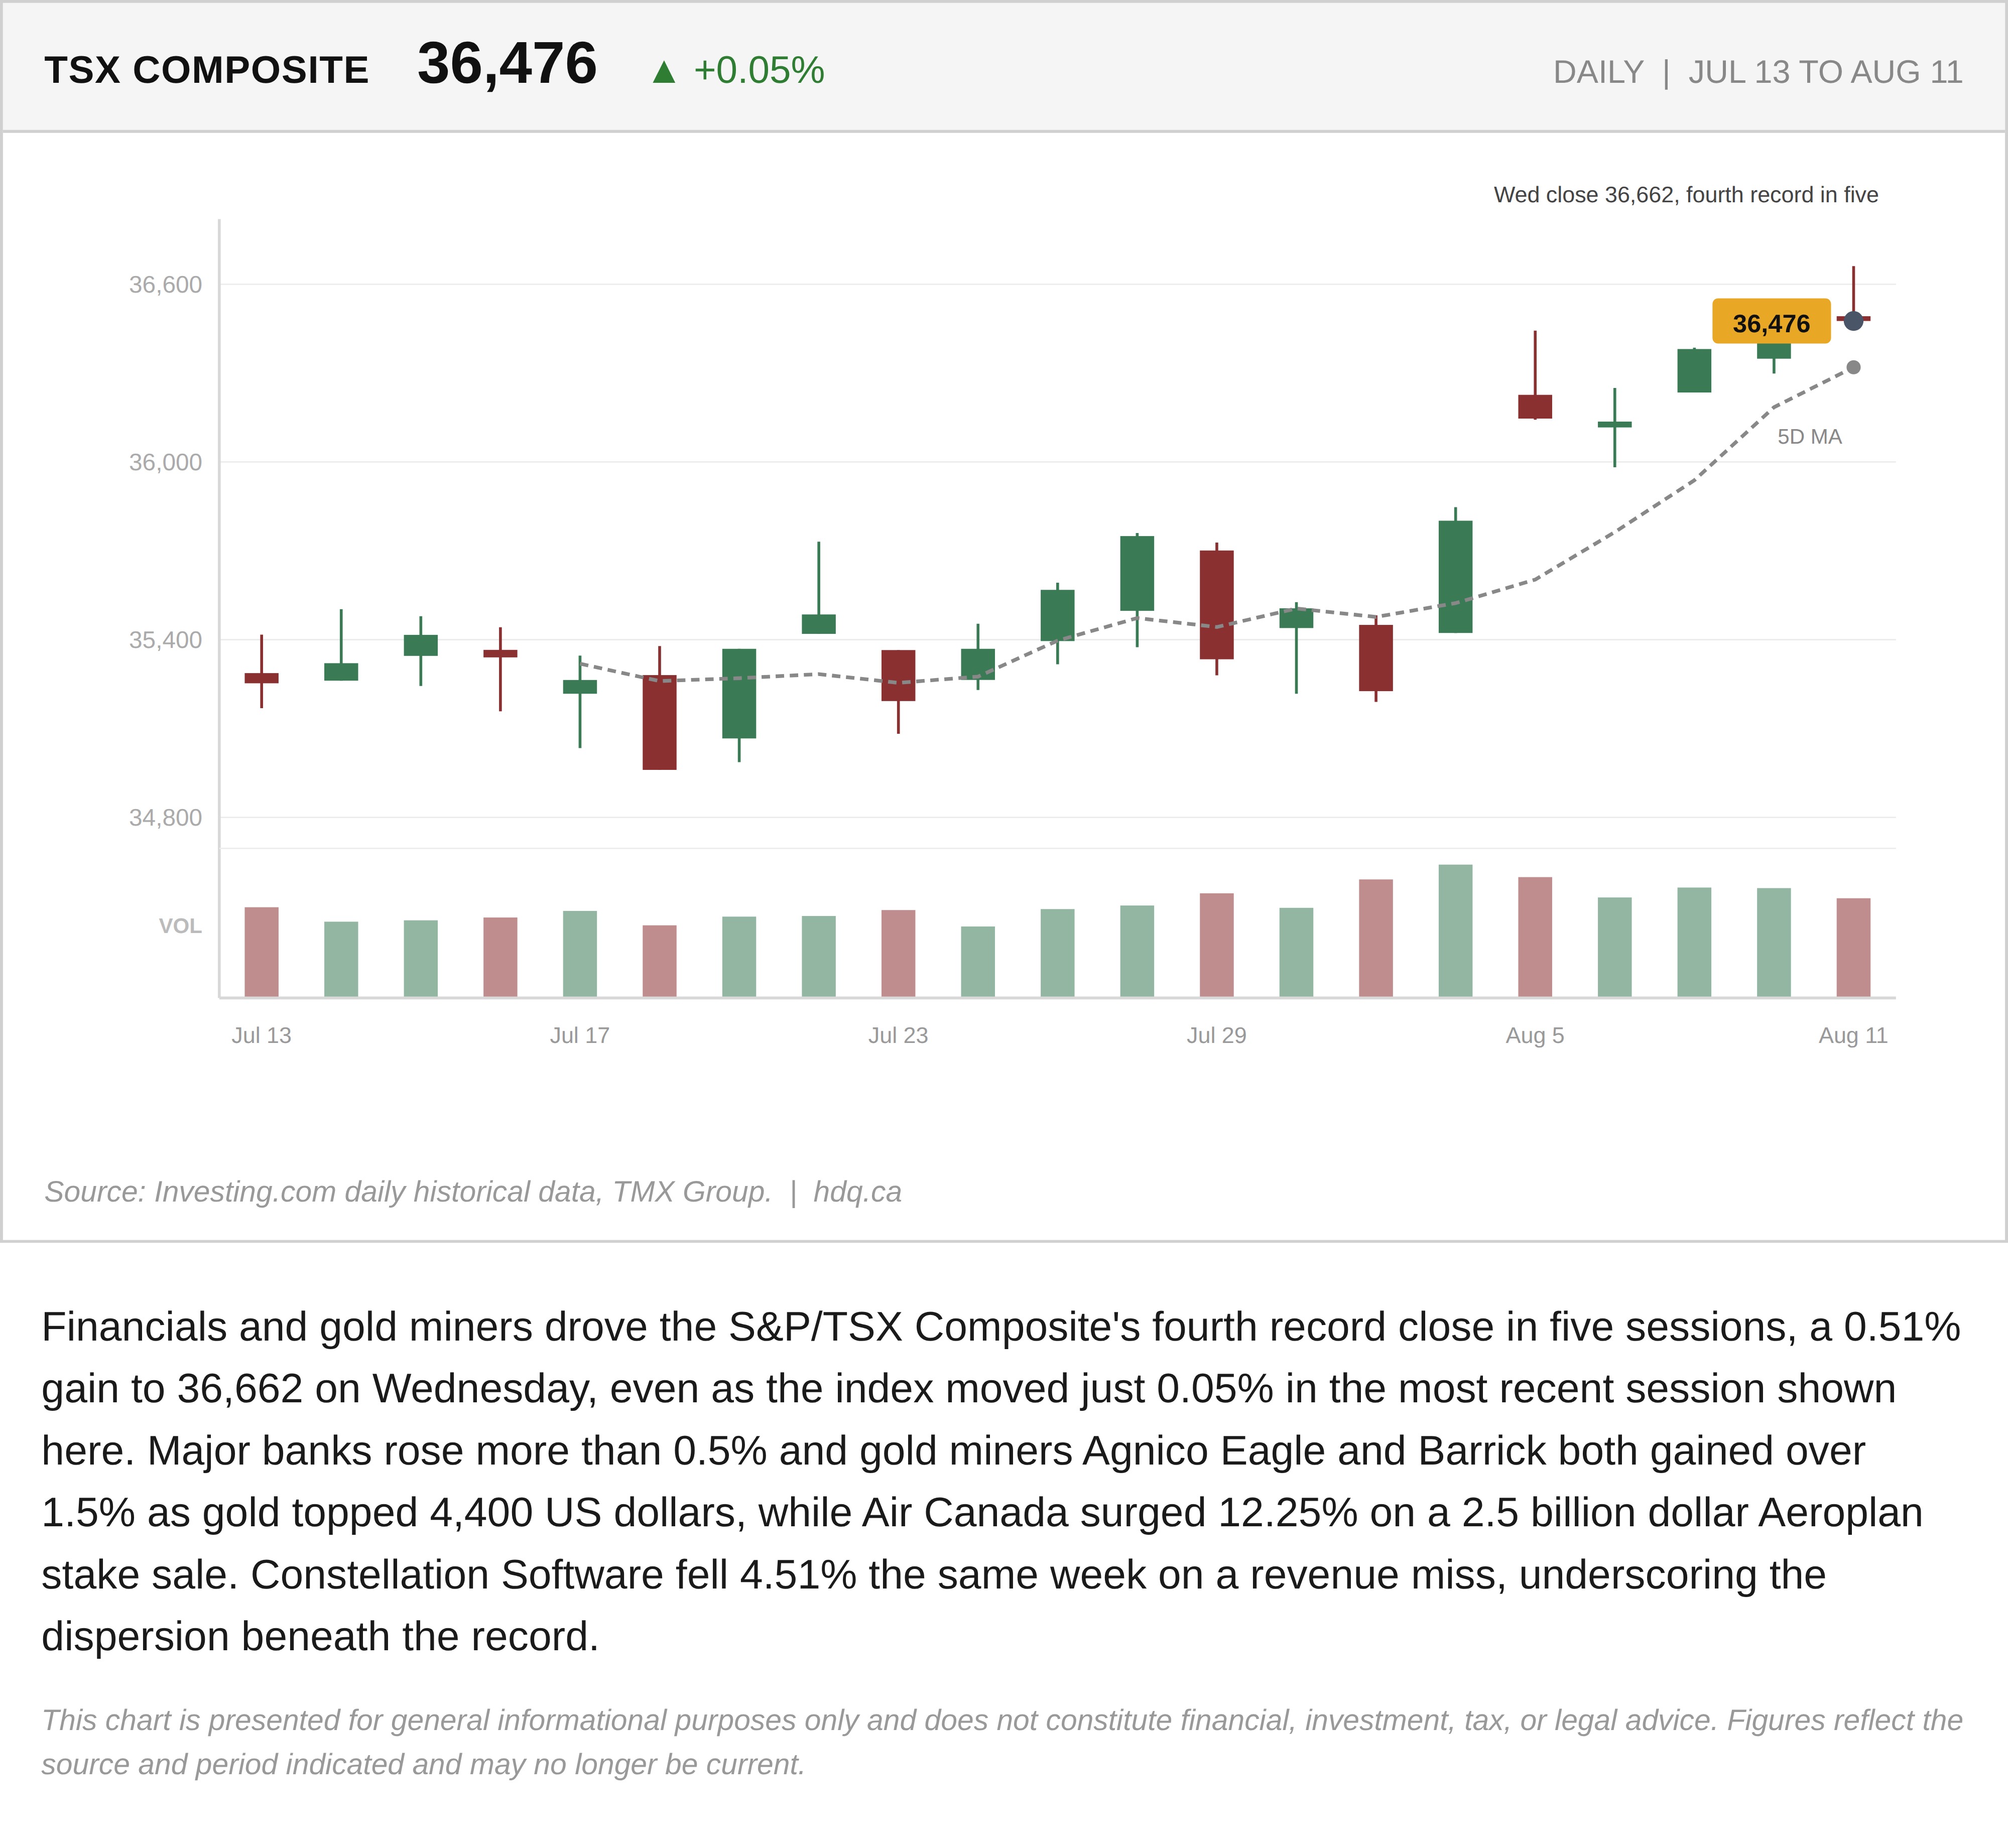
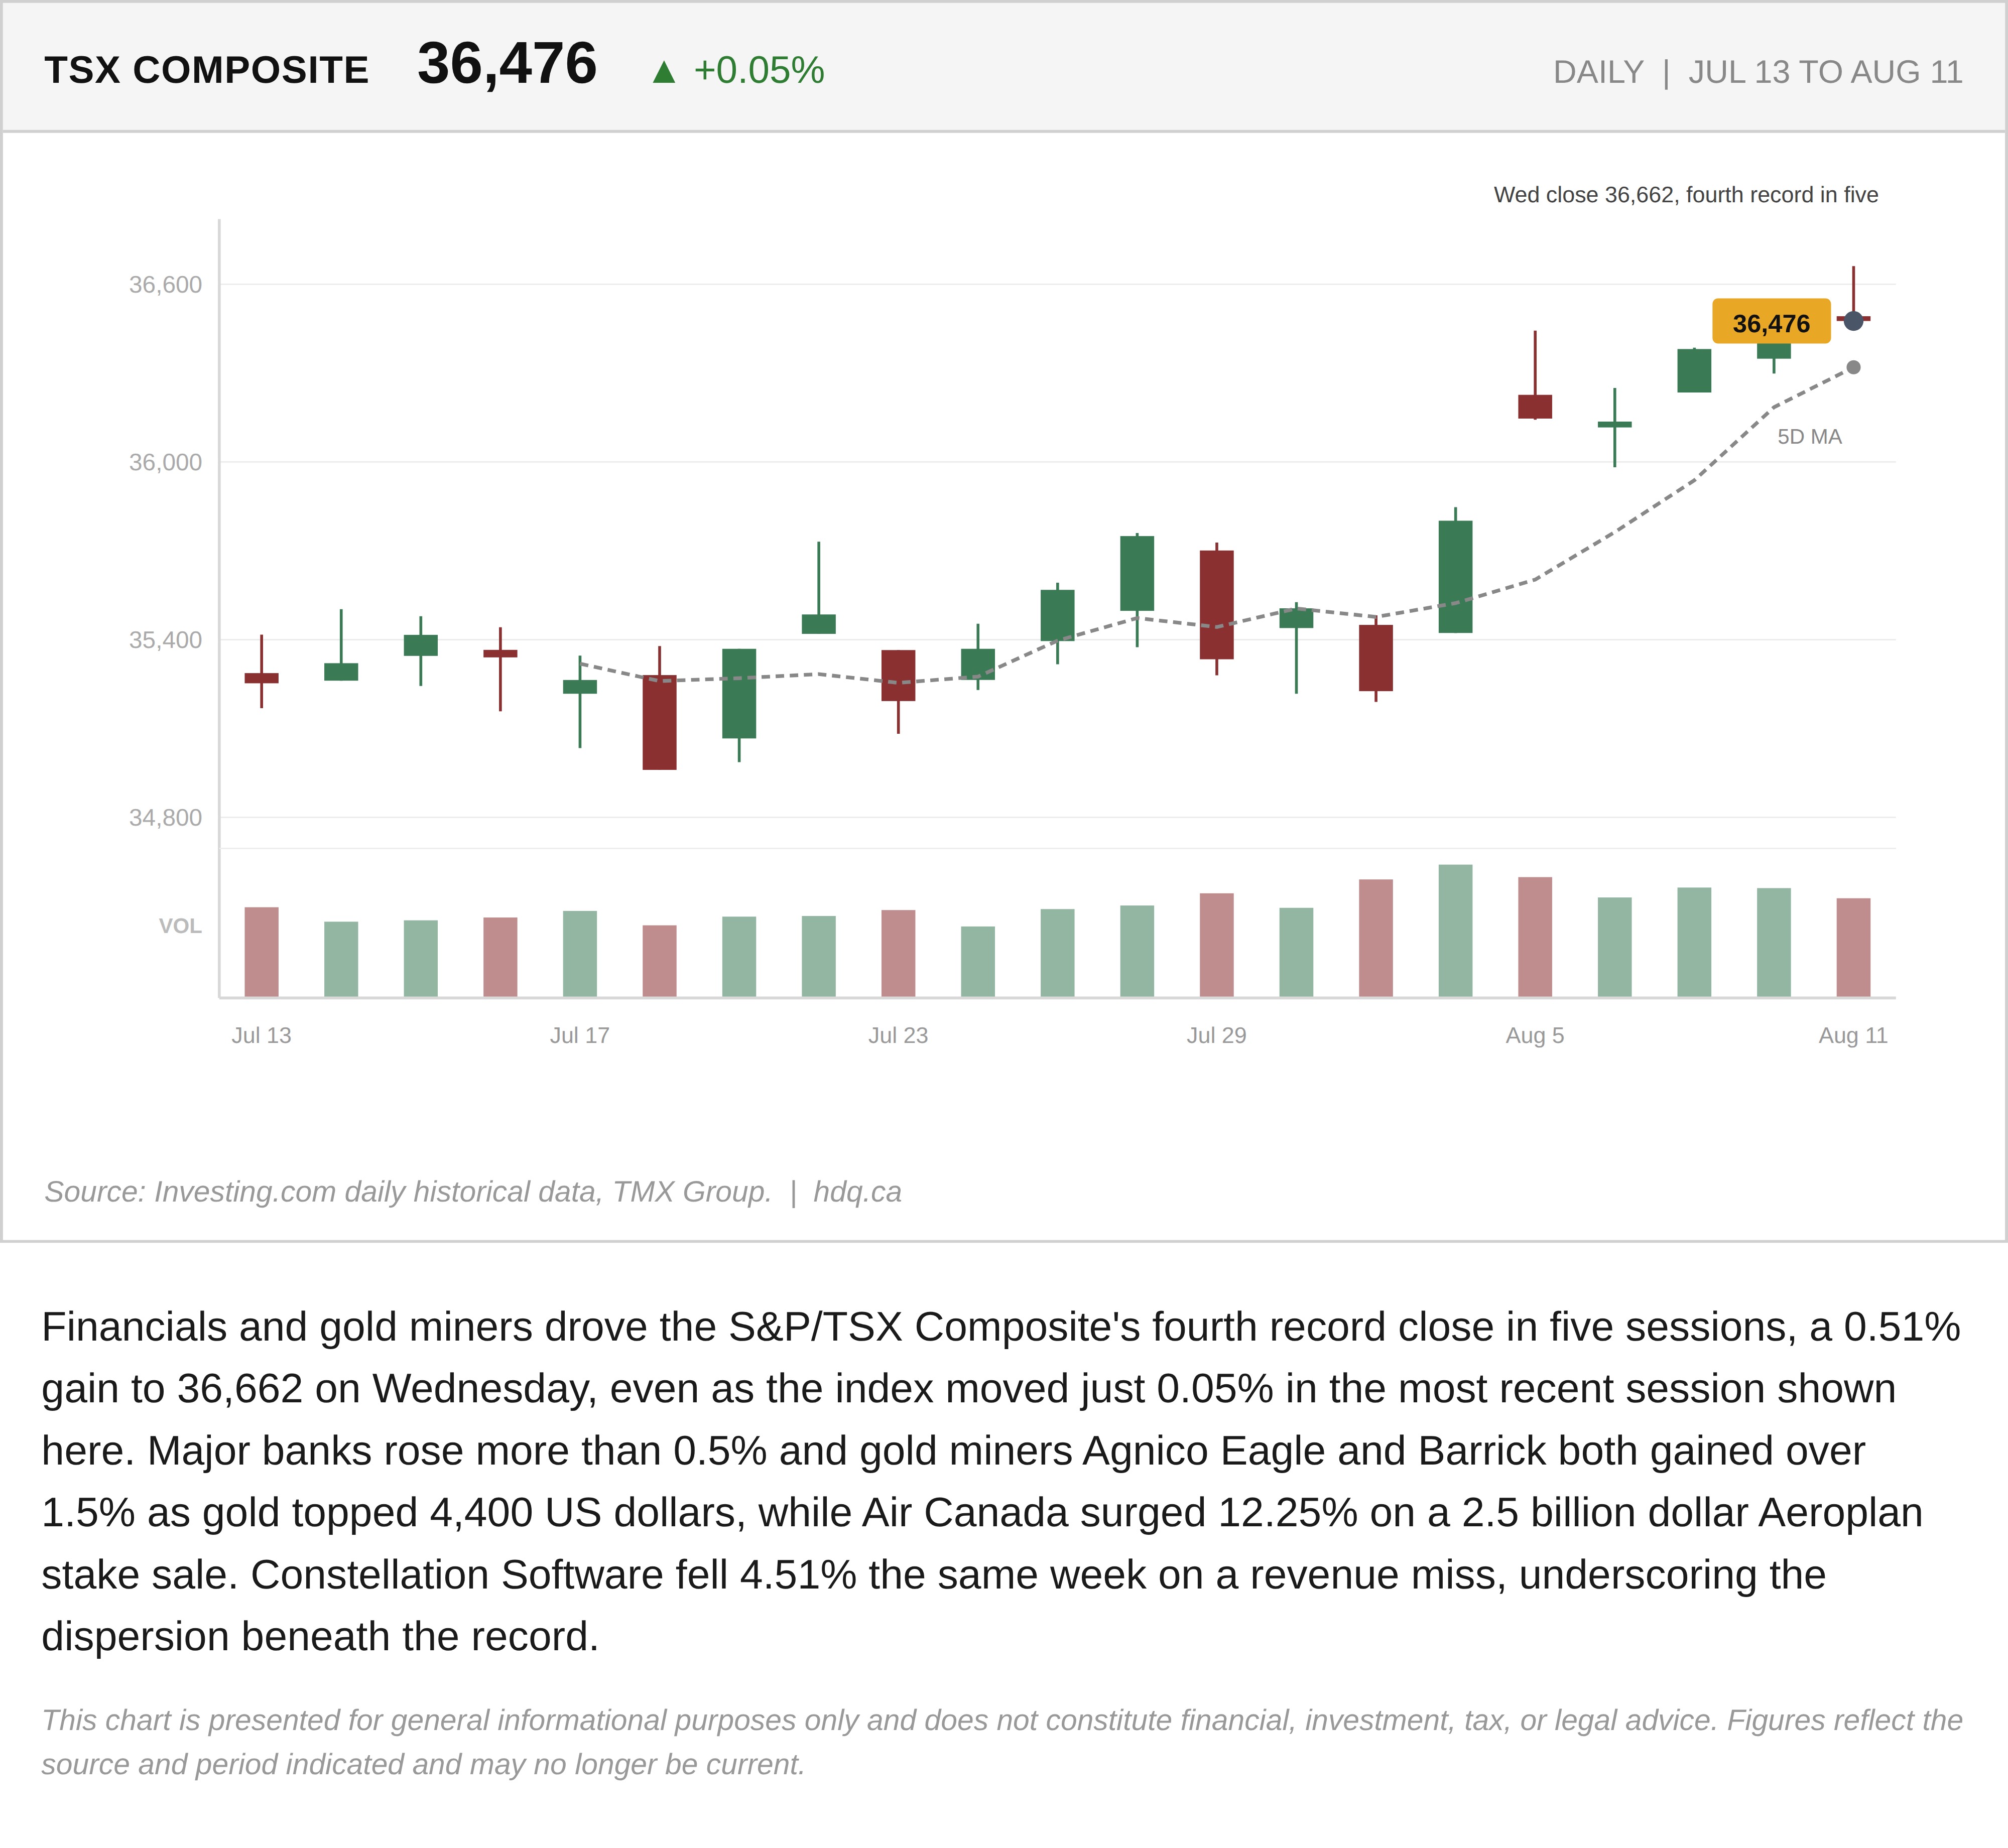
Financials and gold miners drove the S&P/TSX Composite's fourth record close in five sessions, a 0.51% gain to 36,662 on Wednesday, even as the index moved just 0.05% in the most recent session shown here. Major banks rose more than 0.5% and gold miners Agnico Eagle and Barrick both gained over 1.5% as gold topped 4,400 US dollars, while Air Canada surged 12.25% on a 2.5 billion dollar Aeroplan stake sale. Constellation Software fell 4.51% the same week on a revenue miss, underscoring the dispersion beneath the record.
This chart is presented for general informational purposes only and does not constitute financial, investment, tax, or legal advice. Figures reflect the source and period indicated and may no longer be current.
Related charts
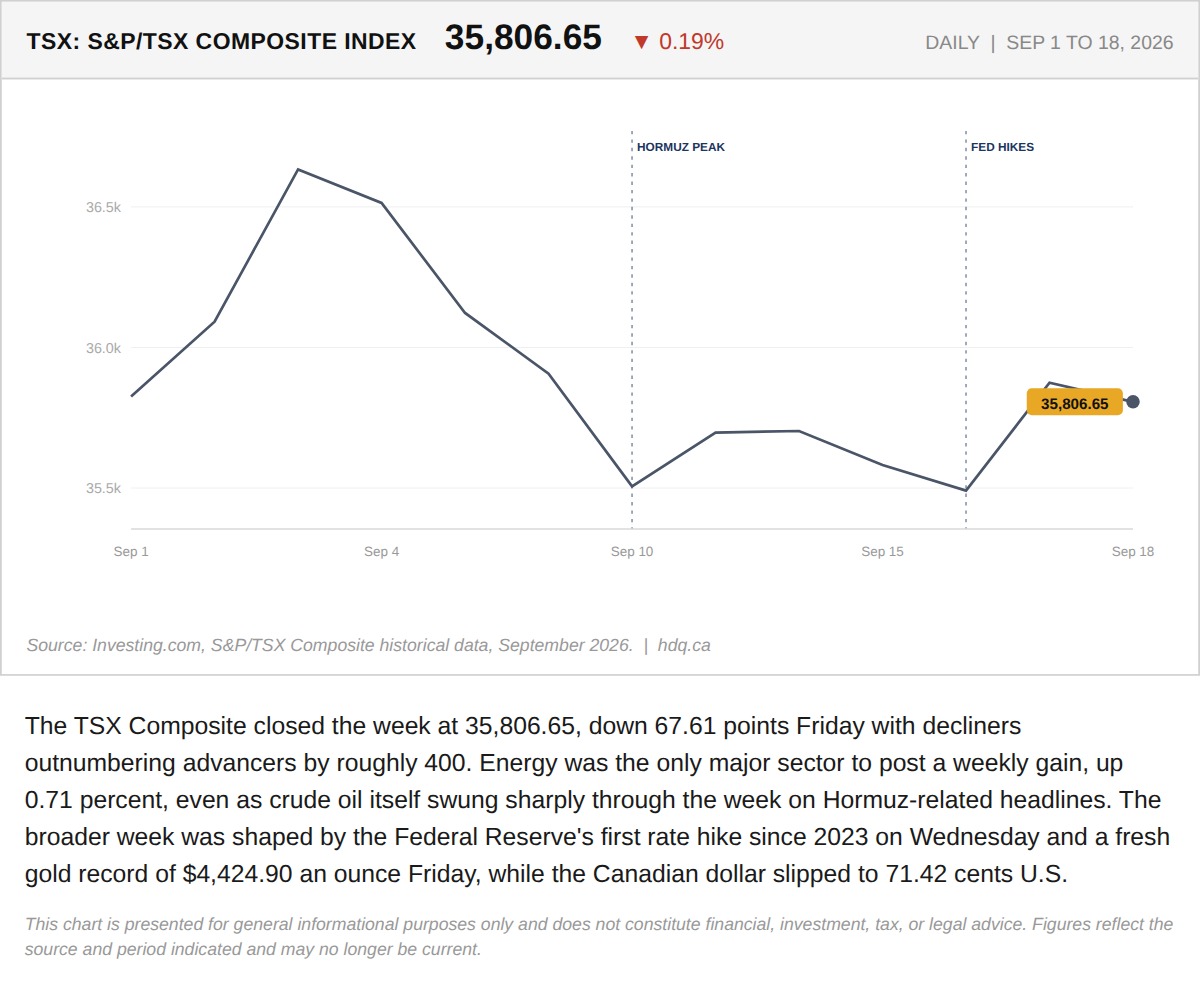
The TSX Composite closed the week at 35,806.65, down 67.61 points Friday with decliners outnumbering advancers by roughly 400.
The TSX Closed a Volatile Week at 35,806.65. Energy Was the Only Sector That Actually Held.
September 21, 2026
View chart & download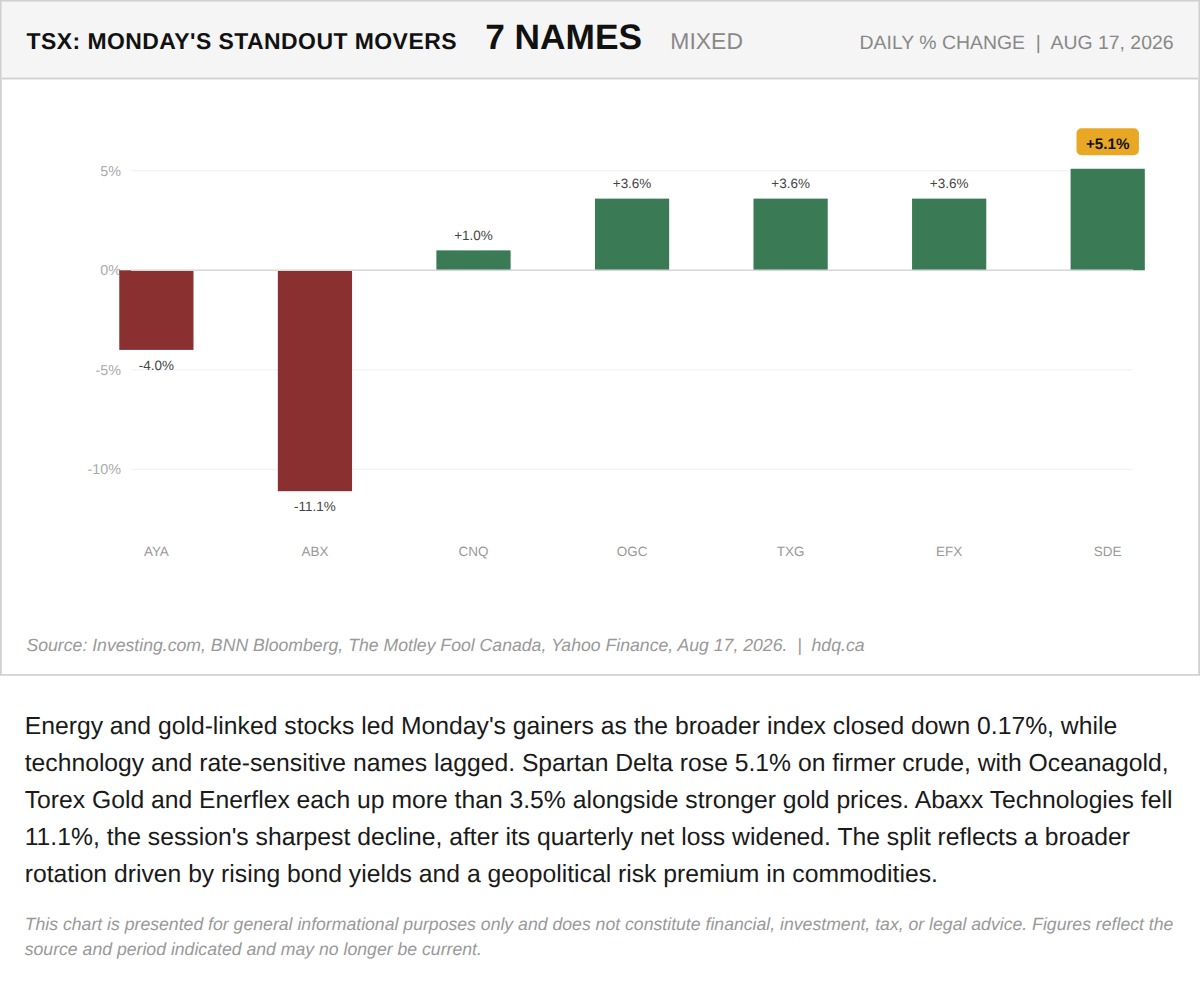
Energy and gold-linked stocks led Monday's gainers as the broader index closed down 0.17%, while technology and rate-sensitive names lagged.
Energy and Gold Names Lead Monday's TSX Movers
August 18, 2026
View chart & download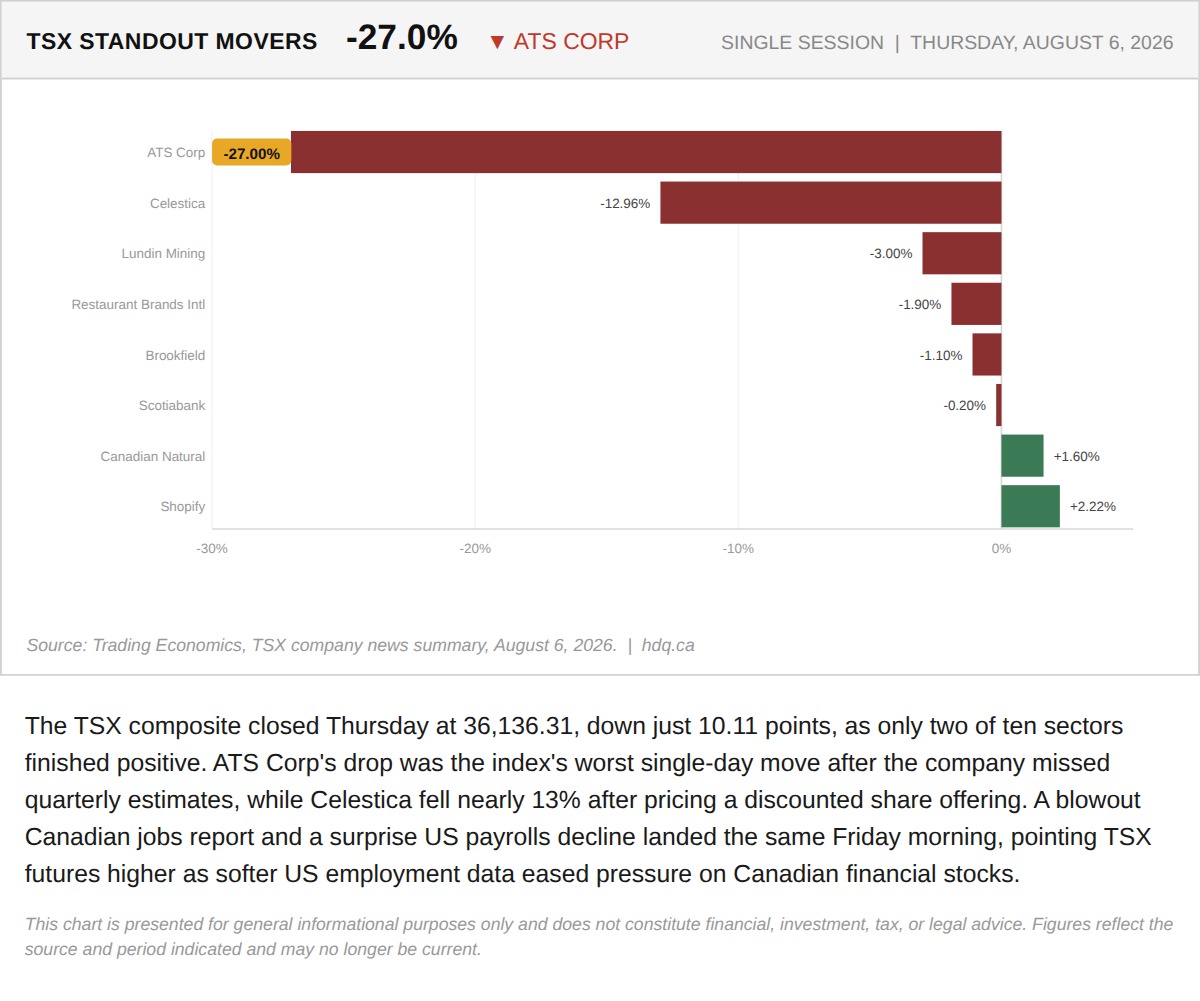
The TSX composite closed Thursday at 36,136.31, down just 10.11 points, as only two of ten sectors finished positive.
ATS Corp's 27% Plunge Masked a Quiet Day for the TSX Ahead of a Jobs-Driven Friday
August 7, 2026
View chart & download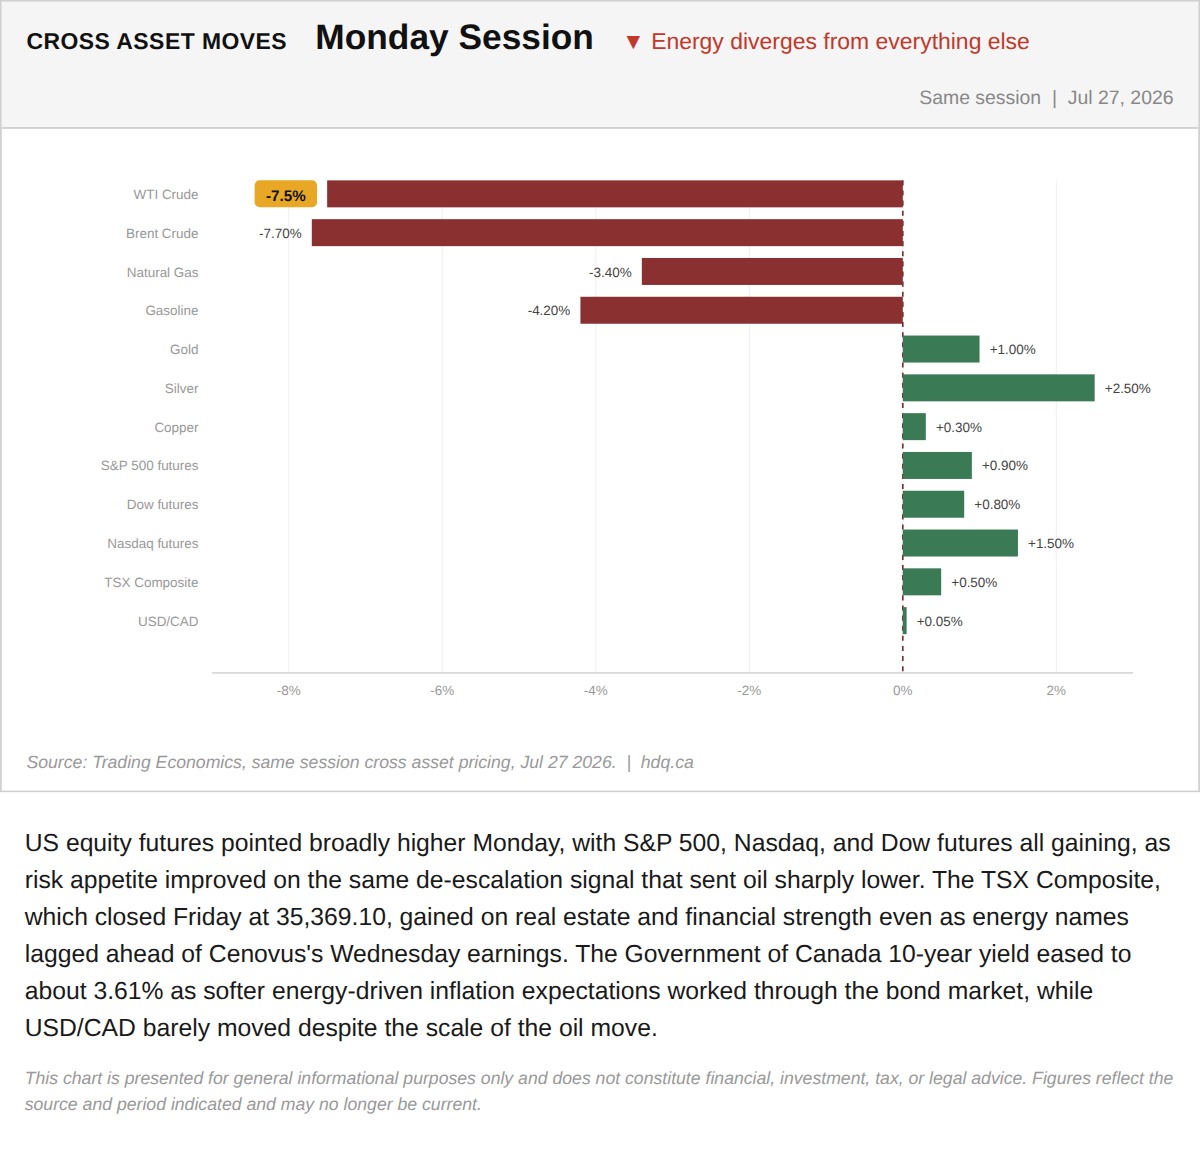
US equity futures pointed broadly higher Monday, with S&P 500, Nasdaq, and Dow futures all gaining, as risk appetite improved on the same…
Cross-Asset Moves Diverge as Energy Lags Monday's Broader Rally
July 27, 2026
View chart & download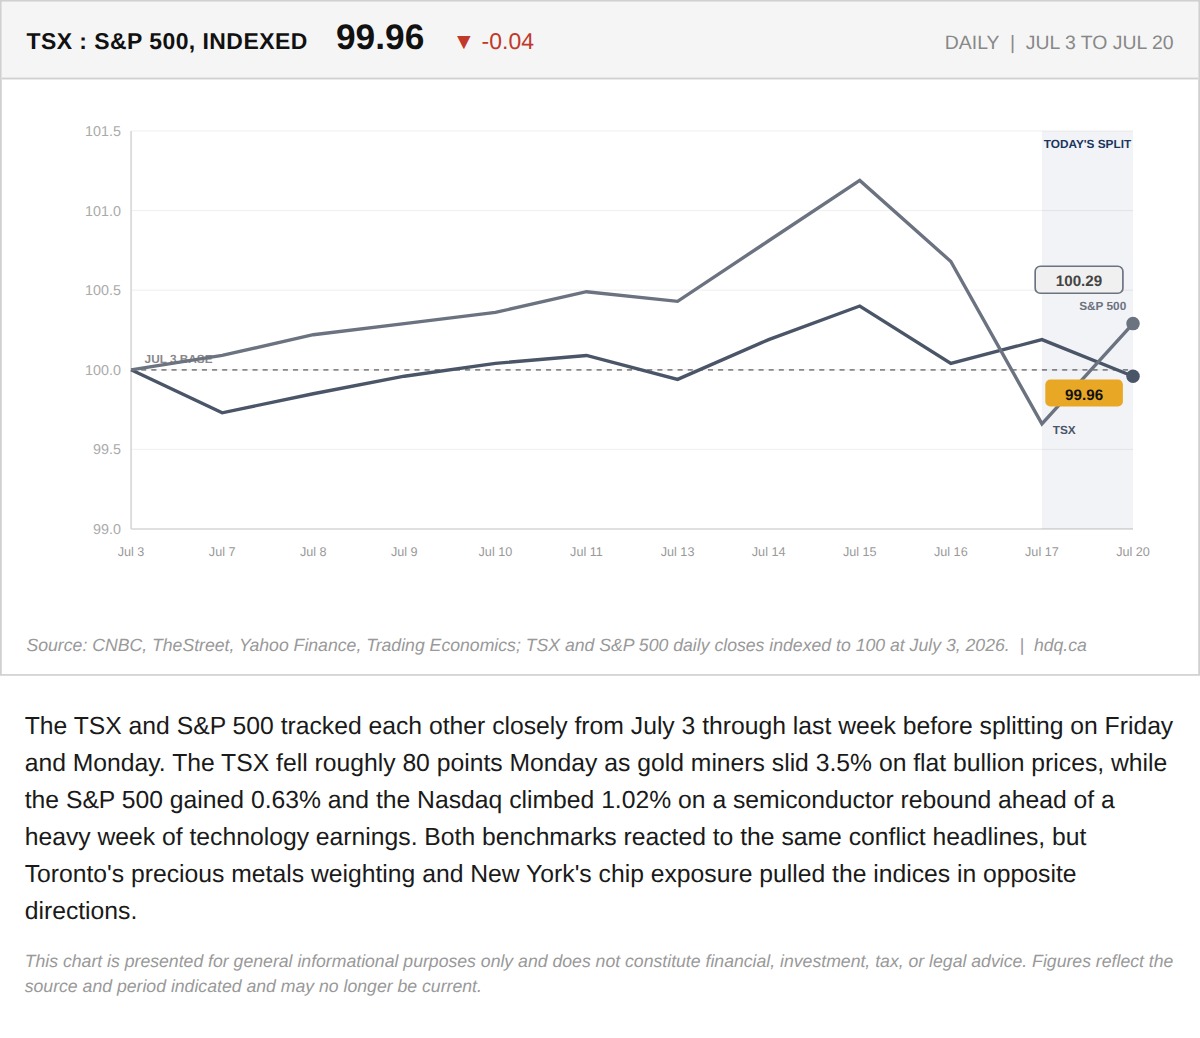
The TSX and S&P 500 tracked each other closely from July 3 through last week before splitting on Friday and Monday.
TSX Falls 80 Points as Gold Miners Slide 3.5%. The S&P 500 Rose 0.6% on the Exact Same Day.
July 20, 2026
View chart & download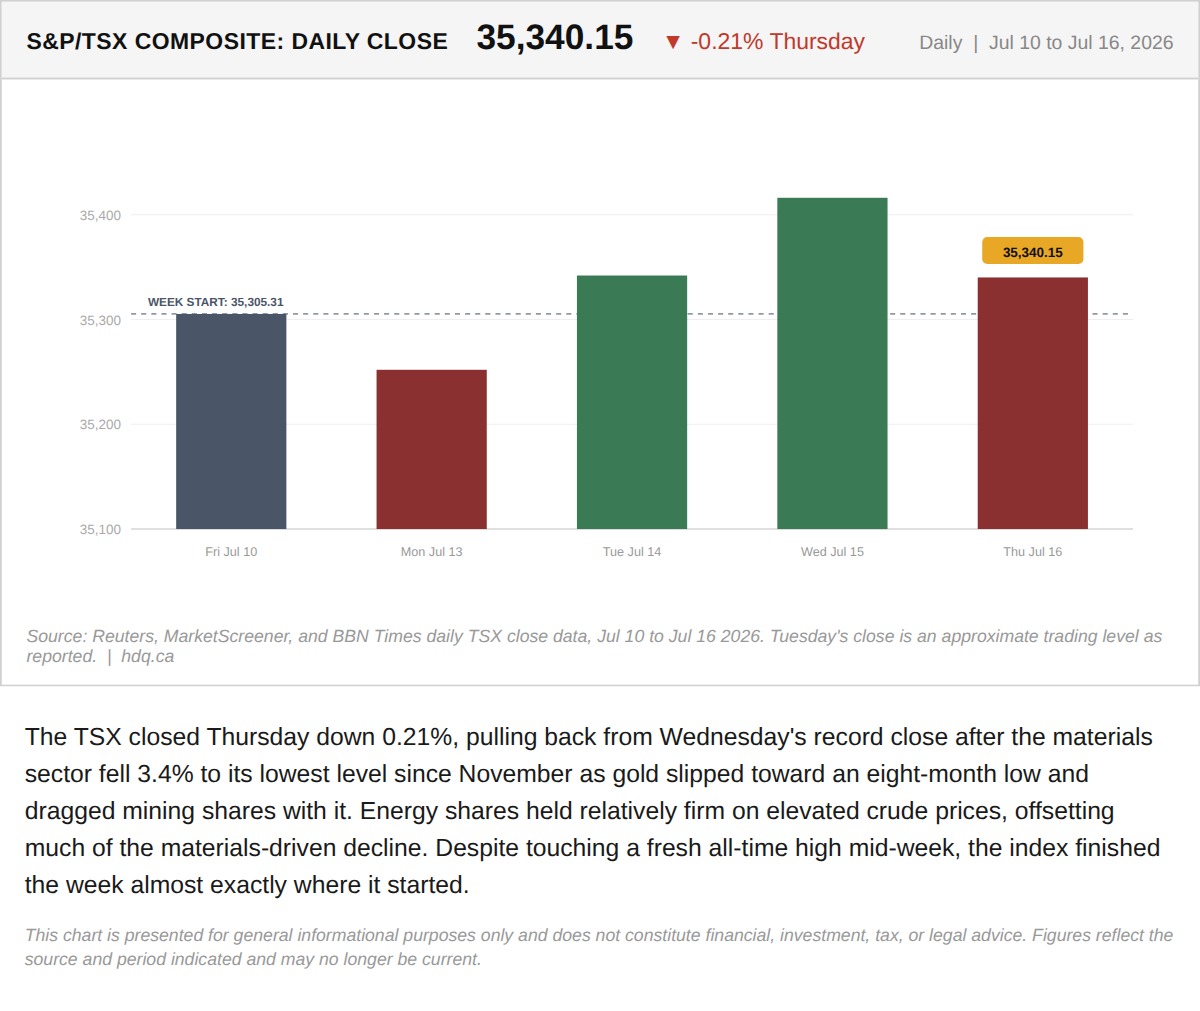
The TSX closed Thursday down 0.21%, pulling back from Wednesday's record close after the materials sector fell 3.4% to its lowest level…
July 17, 2026
View chart & download