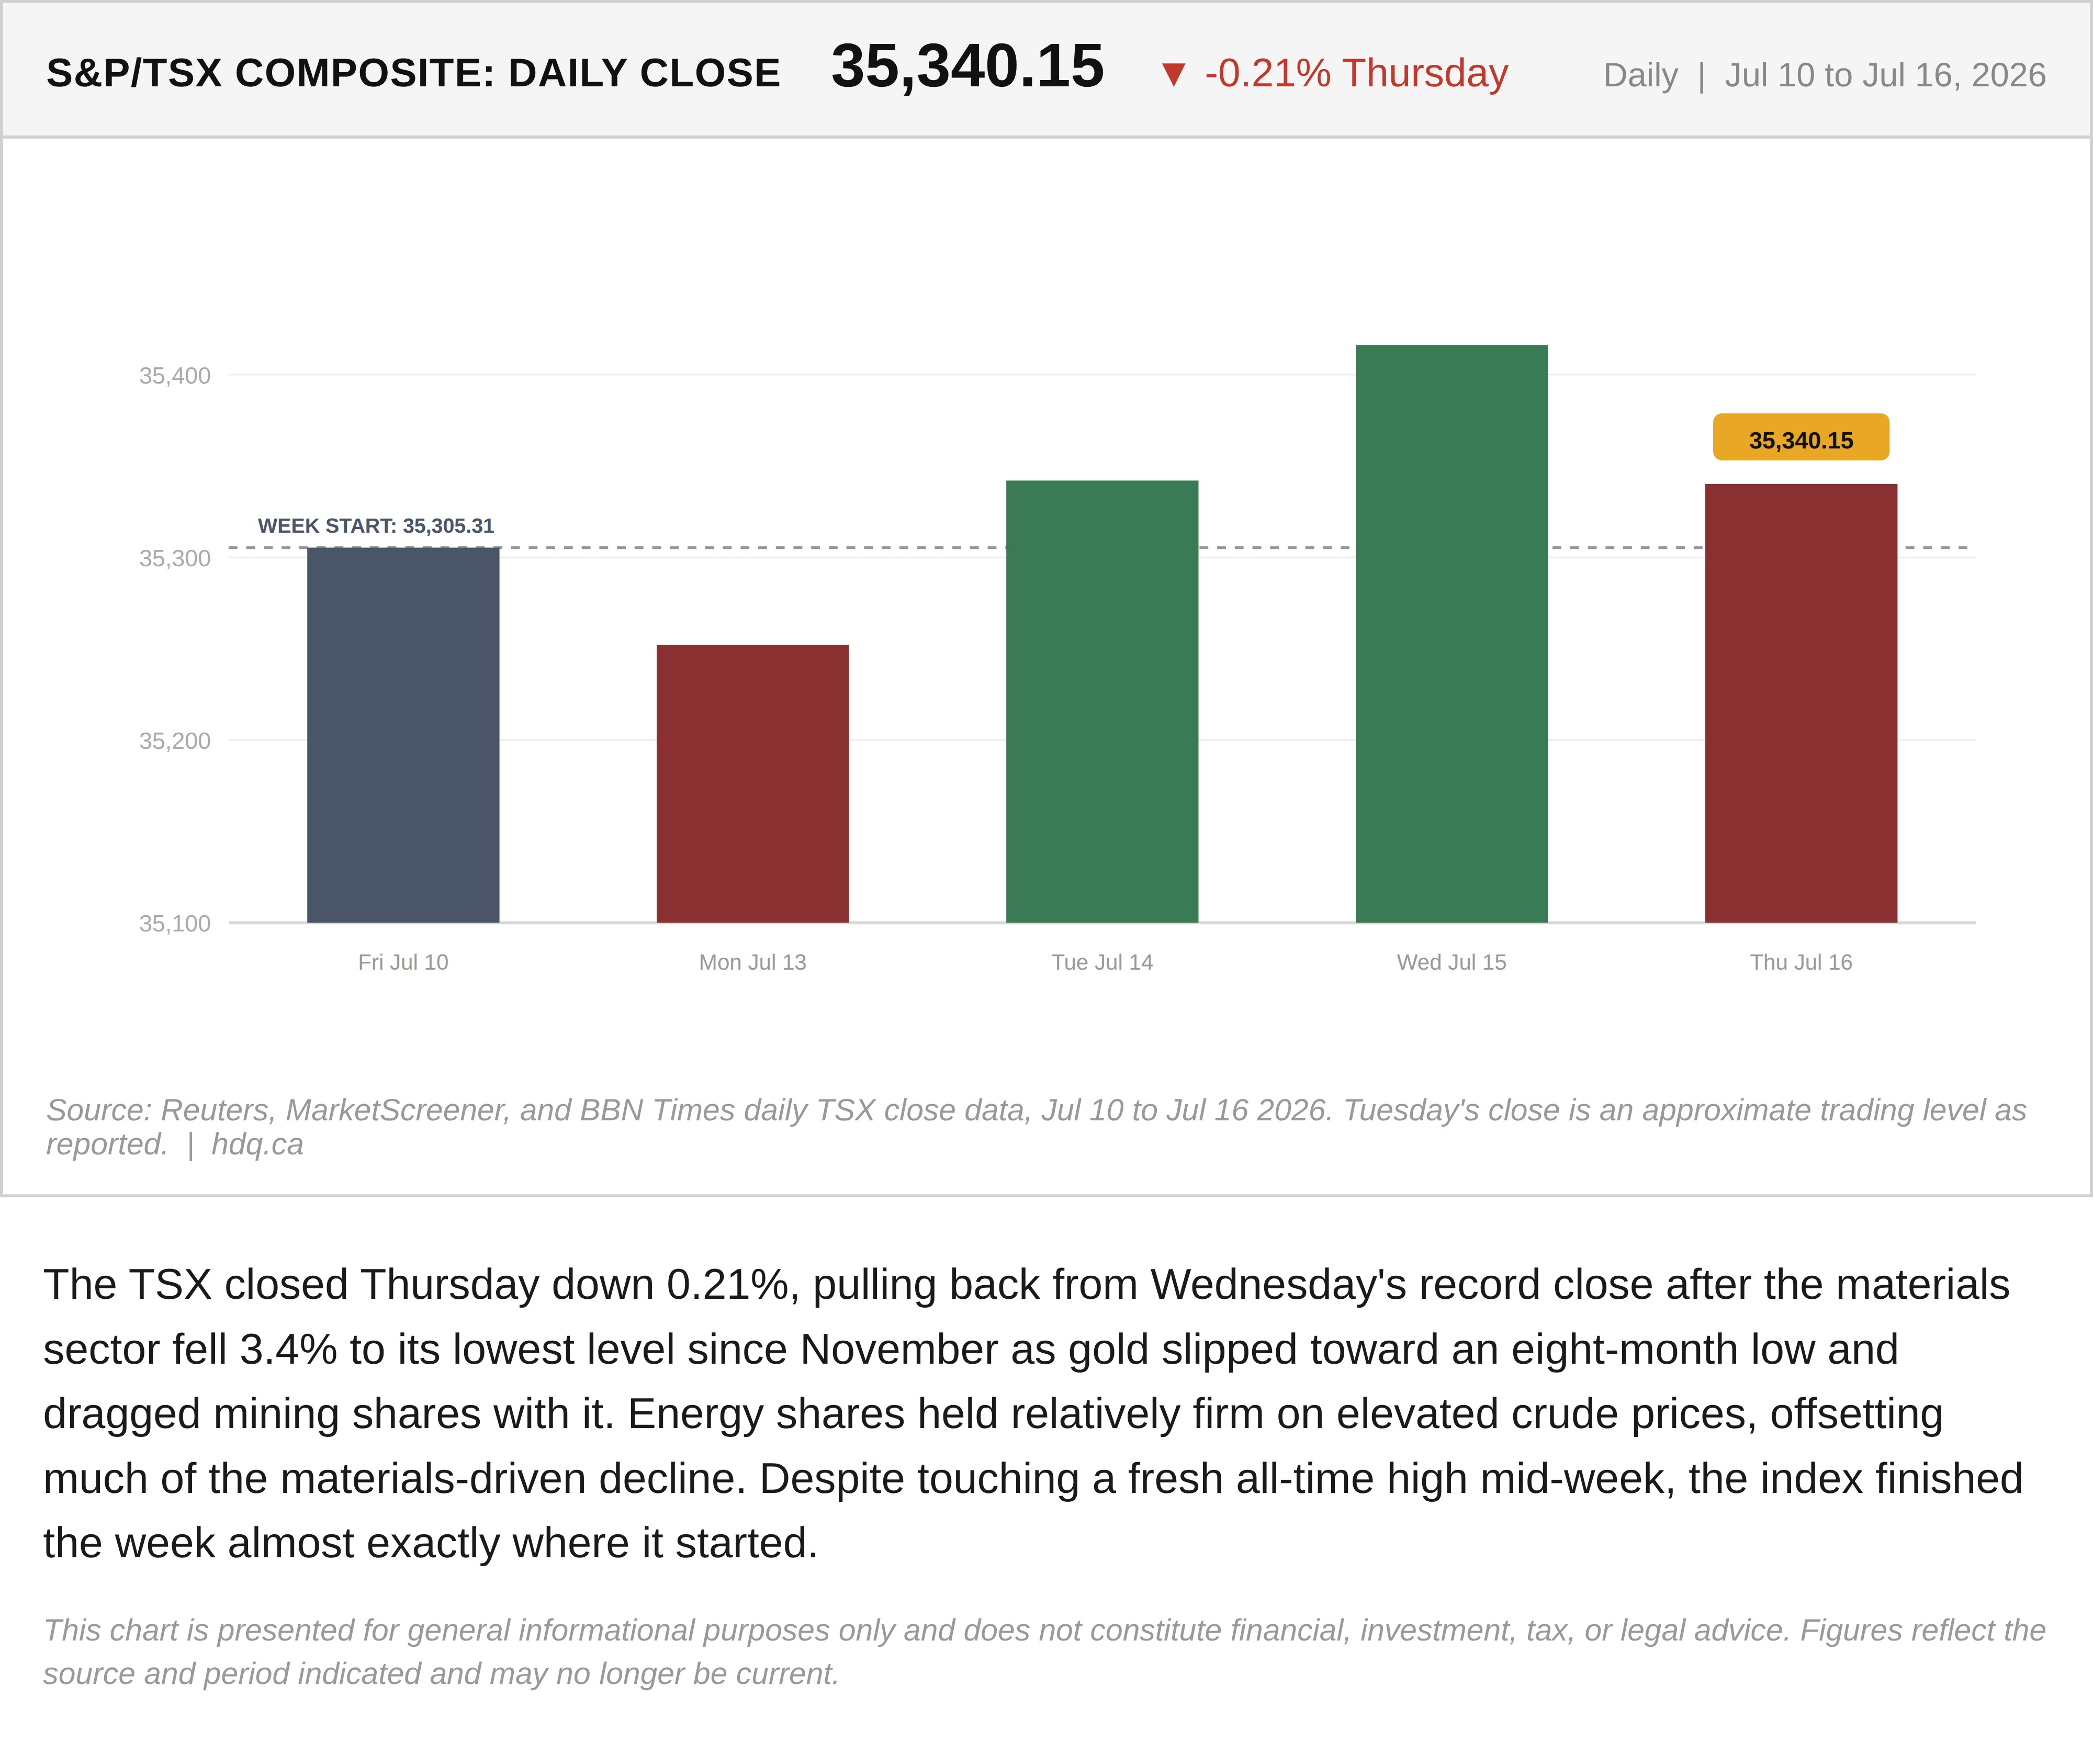
The TSX closed Thursday down 0.21%, pulling back from Wednesday's record close after the materials sector fell 3.4% to its lowest level since November as gold slipped toward an eight-month low and dragged mining shares with it. Energy shares held relatively firm on elevated crude prices, offsetting much of the materials-driven decline. Despite touching a fresh all-time high mid-week, the index finished the week almost exactly where it started.
This chart is presented for general informational purposes only and does not constitute financial, investment, tax, or legal advice. Figures reflect the source and period indicated and may no longer be current.

Related charts
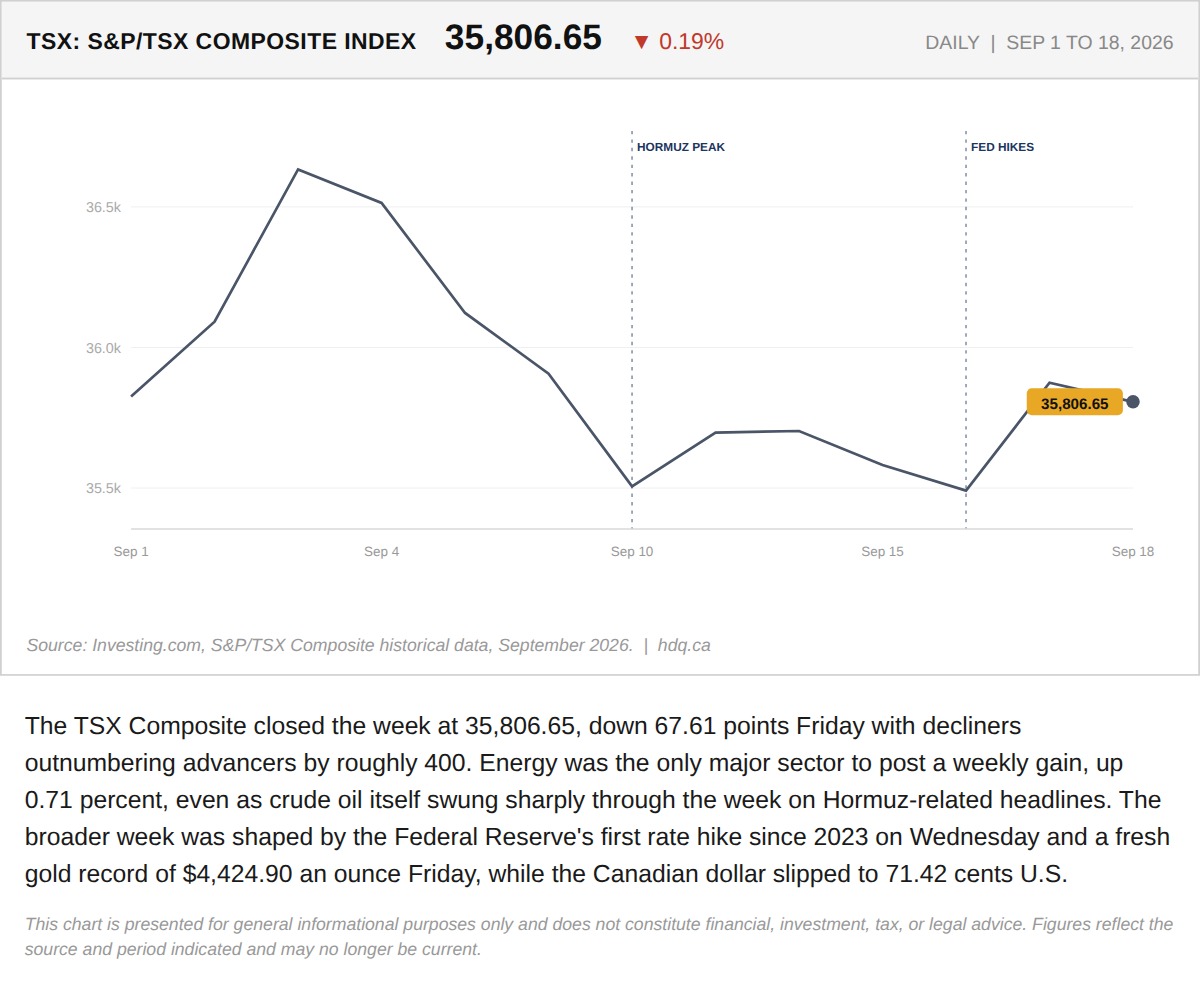
The TSX Composite closed the week at 35,806.65, down 67.61 points Friday with decliners outnumbering advancers by roughly 400.
The TSX Closed a Volatile Week at 35,806.65. Energy Was the Only Sector That Actually Held.
September 21, 2026
View chart & download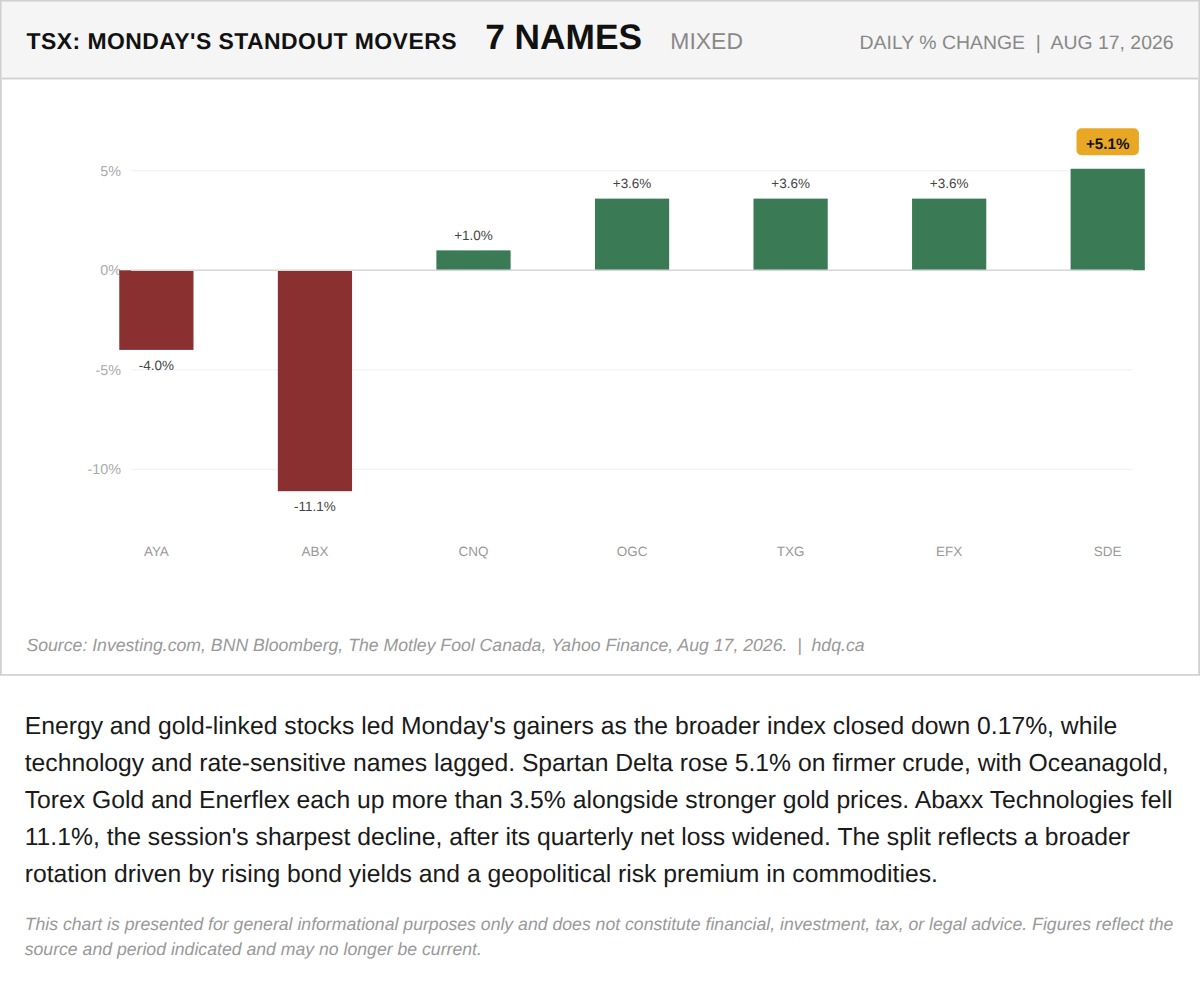
Energy and gold-linked stocks led Monday's gainers as the broader index closed down 0.17%, while technology and rate-sensitive names lagged.
Energy and Gold Names Lead Monday's TSX Movers
August 18, 2026
View chart & download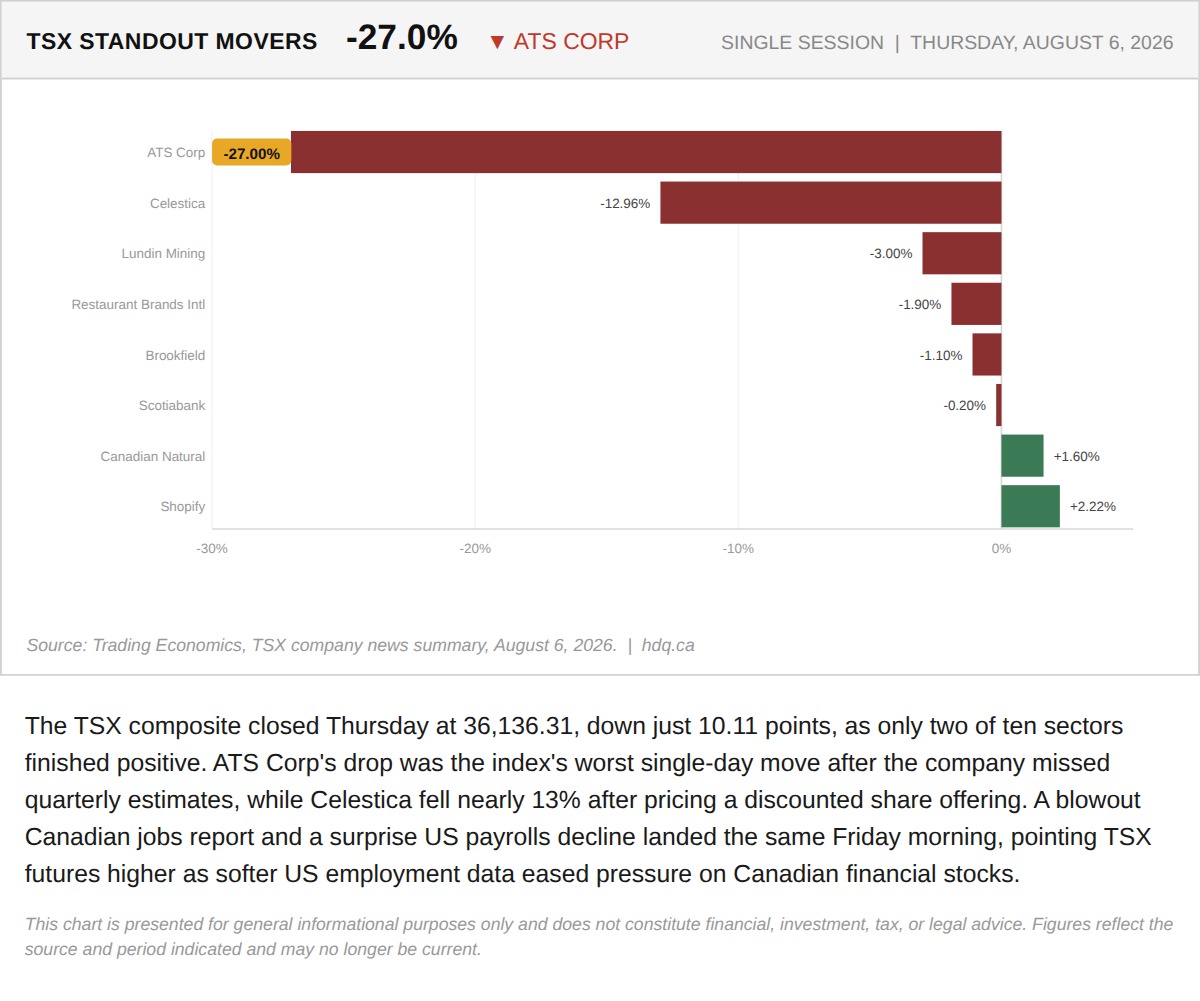
The TSX composite closed Thursday at 36,136.31, down just 10.11 points, as only two of ten sectors finished positive.
ATS Corp's 27% Plunge Masked a Quiet Day for the TSX Ahead of a Jobs-Driven Friday
August 7, 2026
View chart & download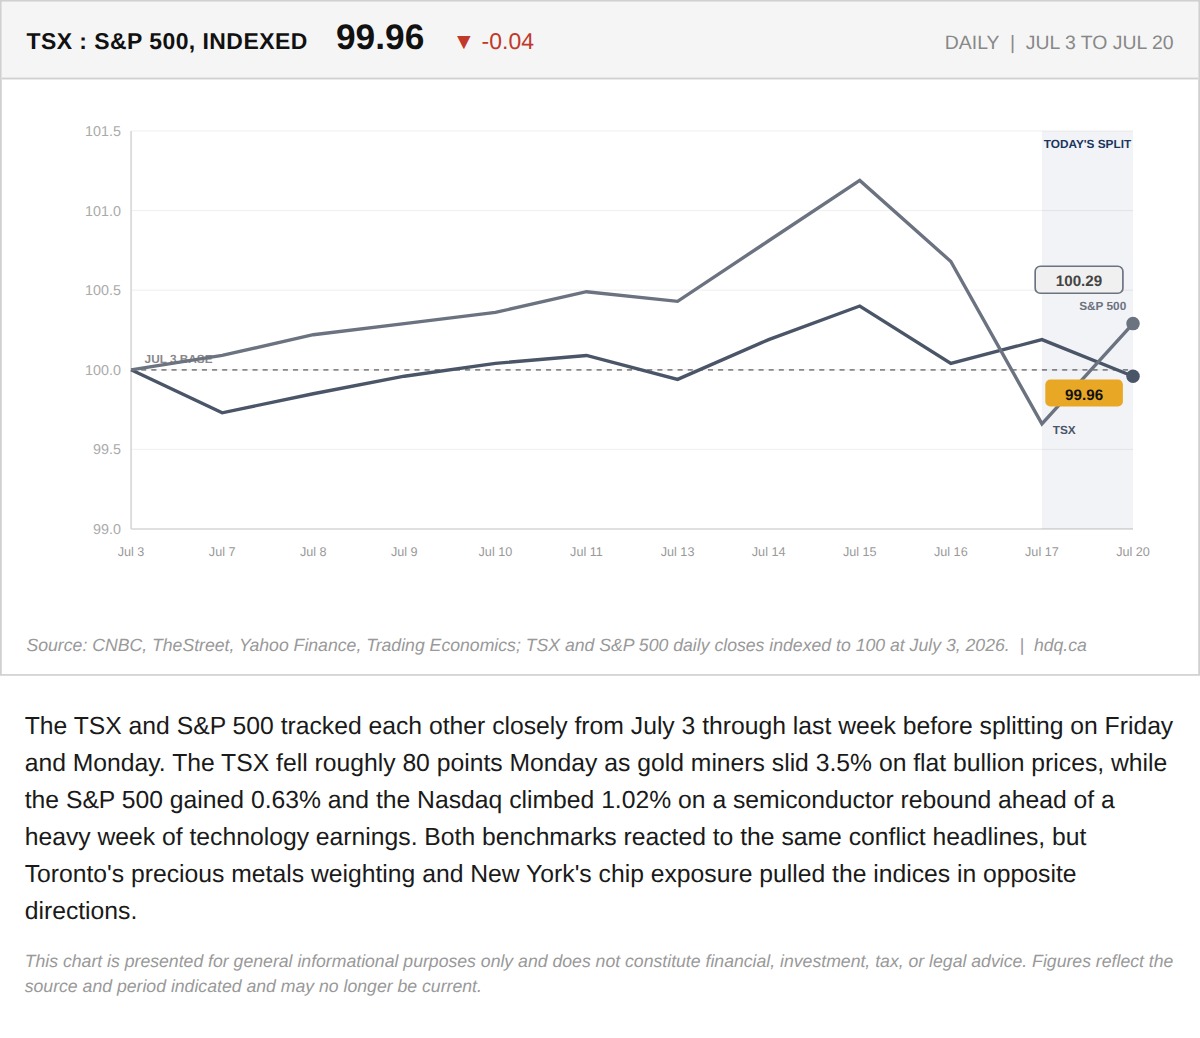
The TSX and S&P 500 tracked each other closely from July 3 through last week before splitting on Friday and Monday.
TSX Falls 80 Points as Gold Miners Slide 3.5%. The S&P 500 Rose 0.6% on the Exact Same Day.
July 20, 2026
View chart & download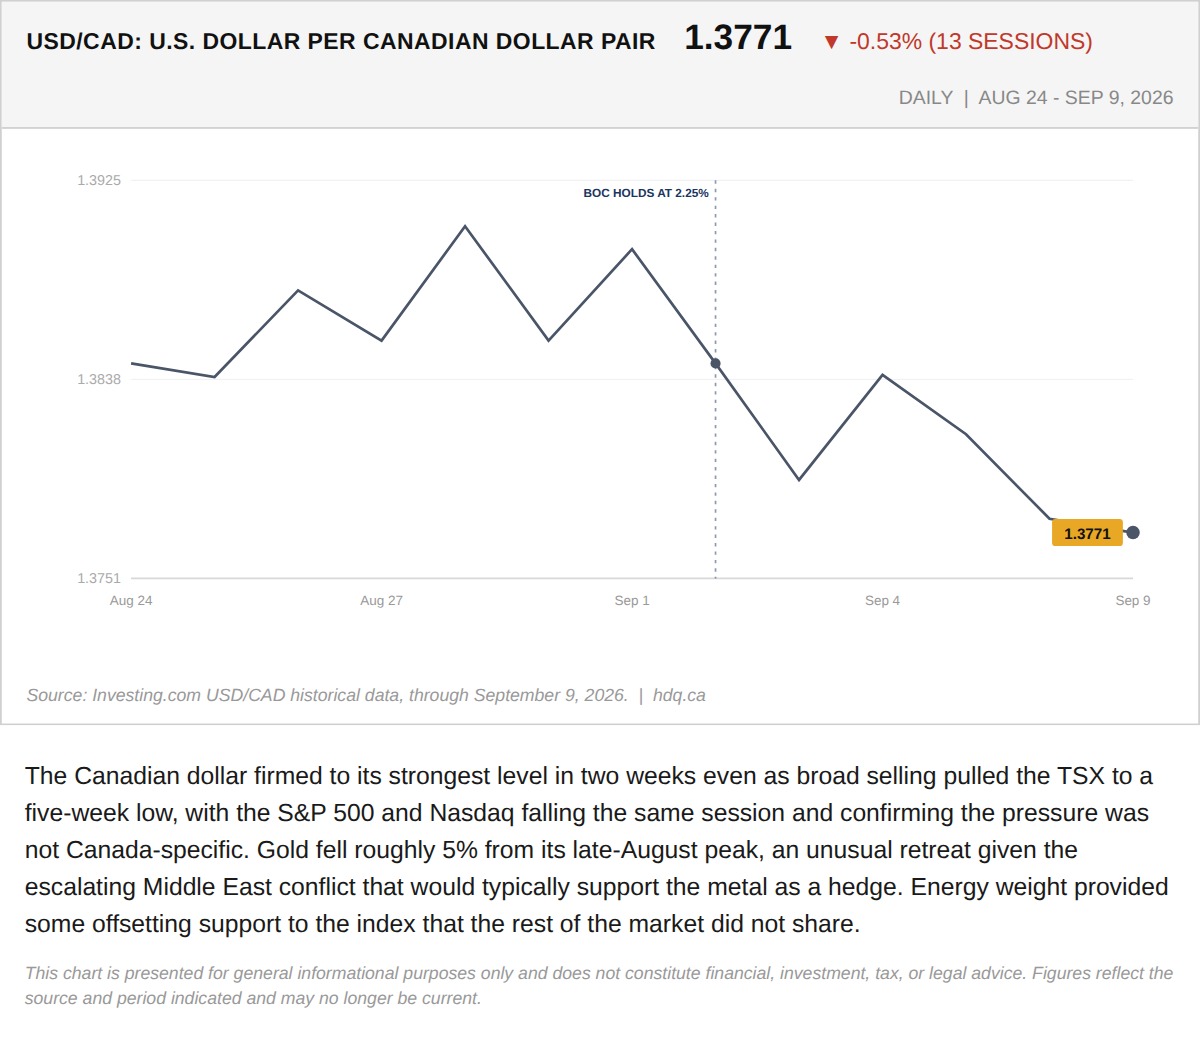
The Canadian dollar firmed to its strongest level in two weeks even as broad selling pulled the TSX to a five-week low, with the S&P 500…
TSX Falls to a Five-Week Low as Broad Selling Outweighs the Oil Rally's Support
September 10, 2026
View chart & download
The S&P/TSX Composite closed July at 35,226, up 1.06% for the month, a modest headline figure that conceals sharp intra-month swings.
S&P/TSX Composite closes July up 1.06% after a volatile month
July 31, 2026
View chart & download