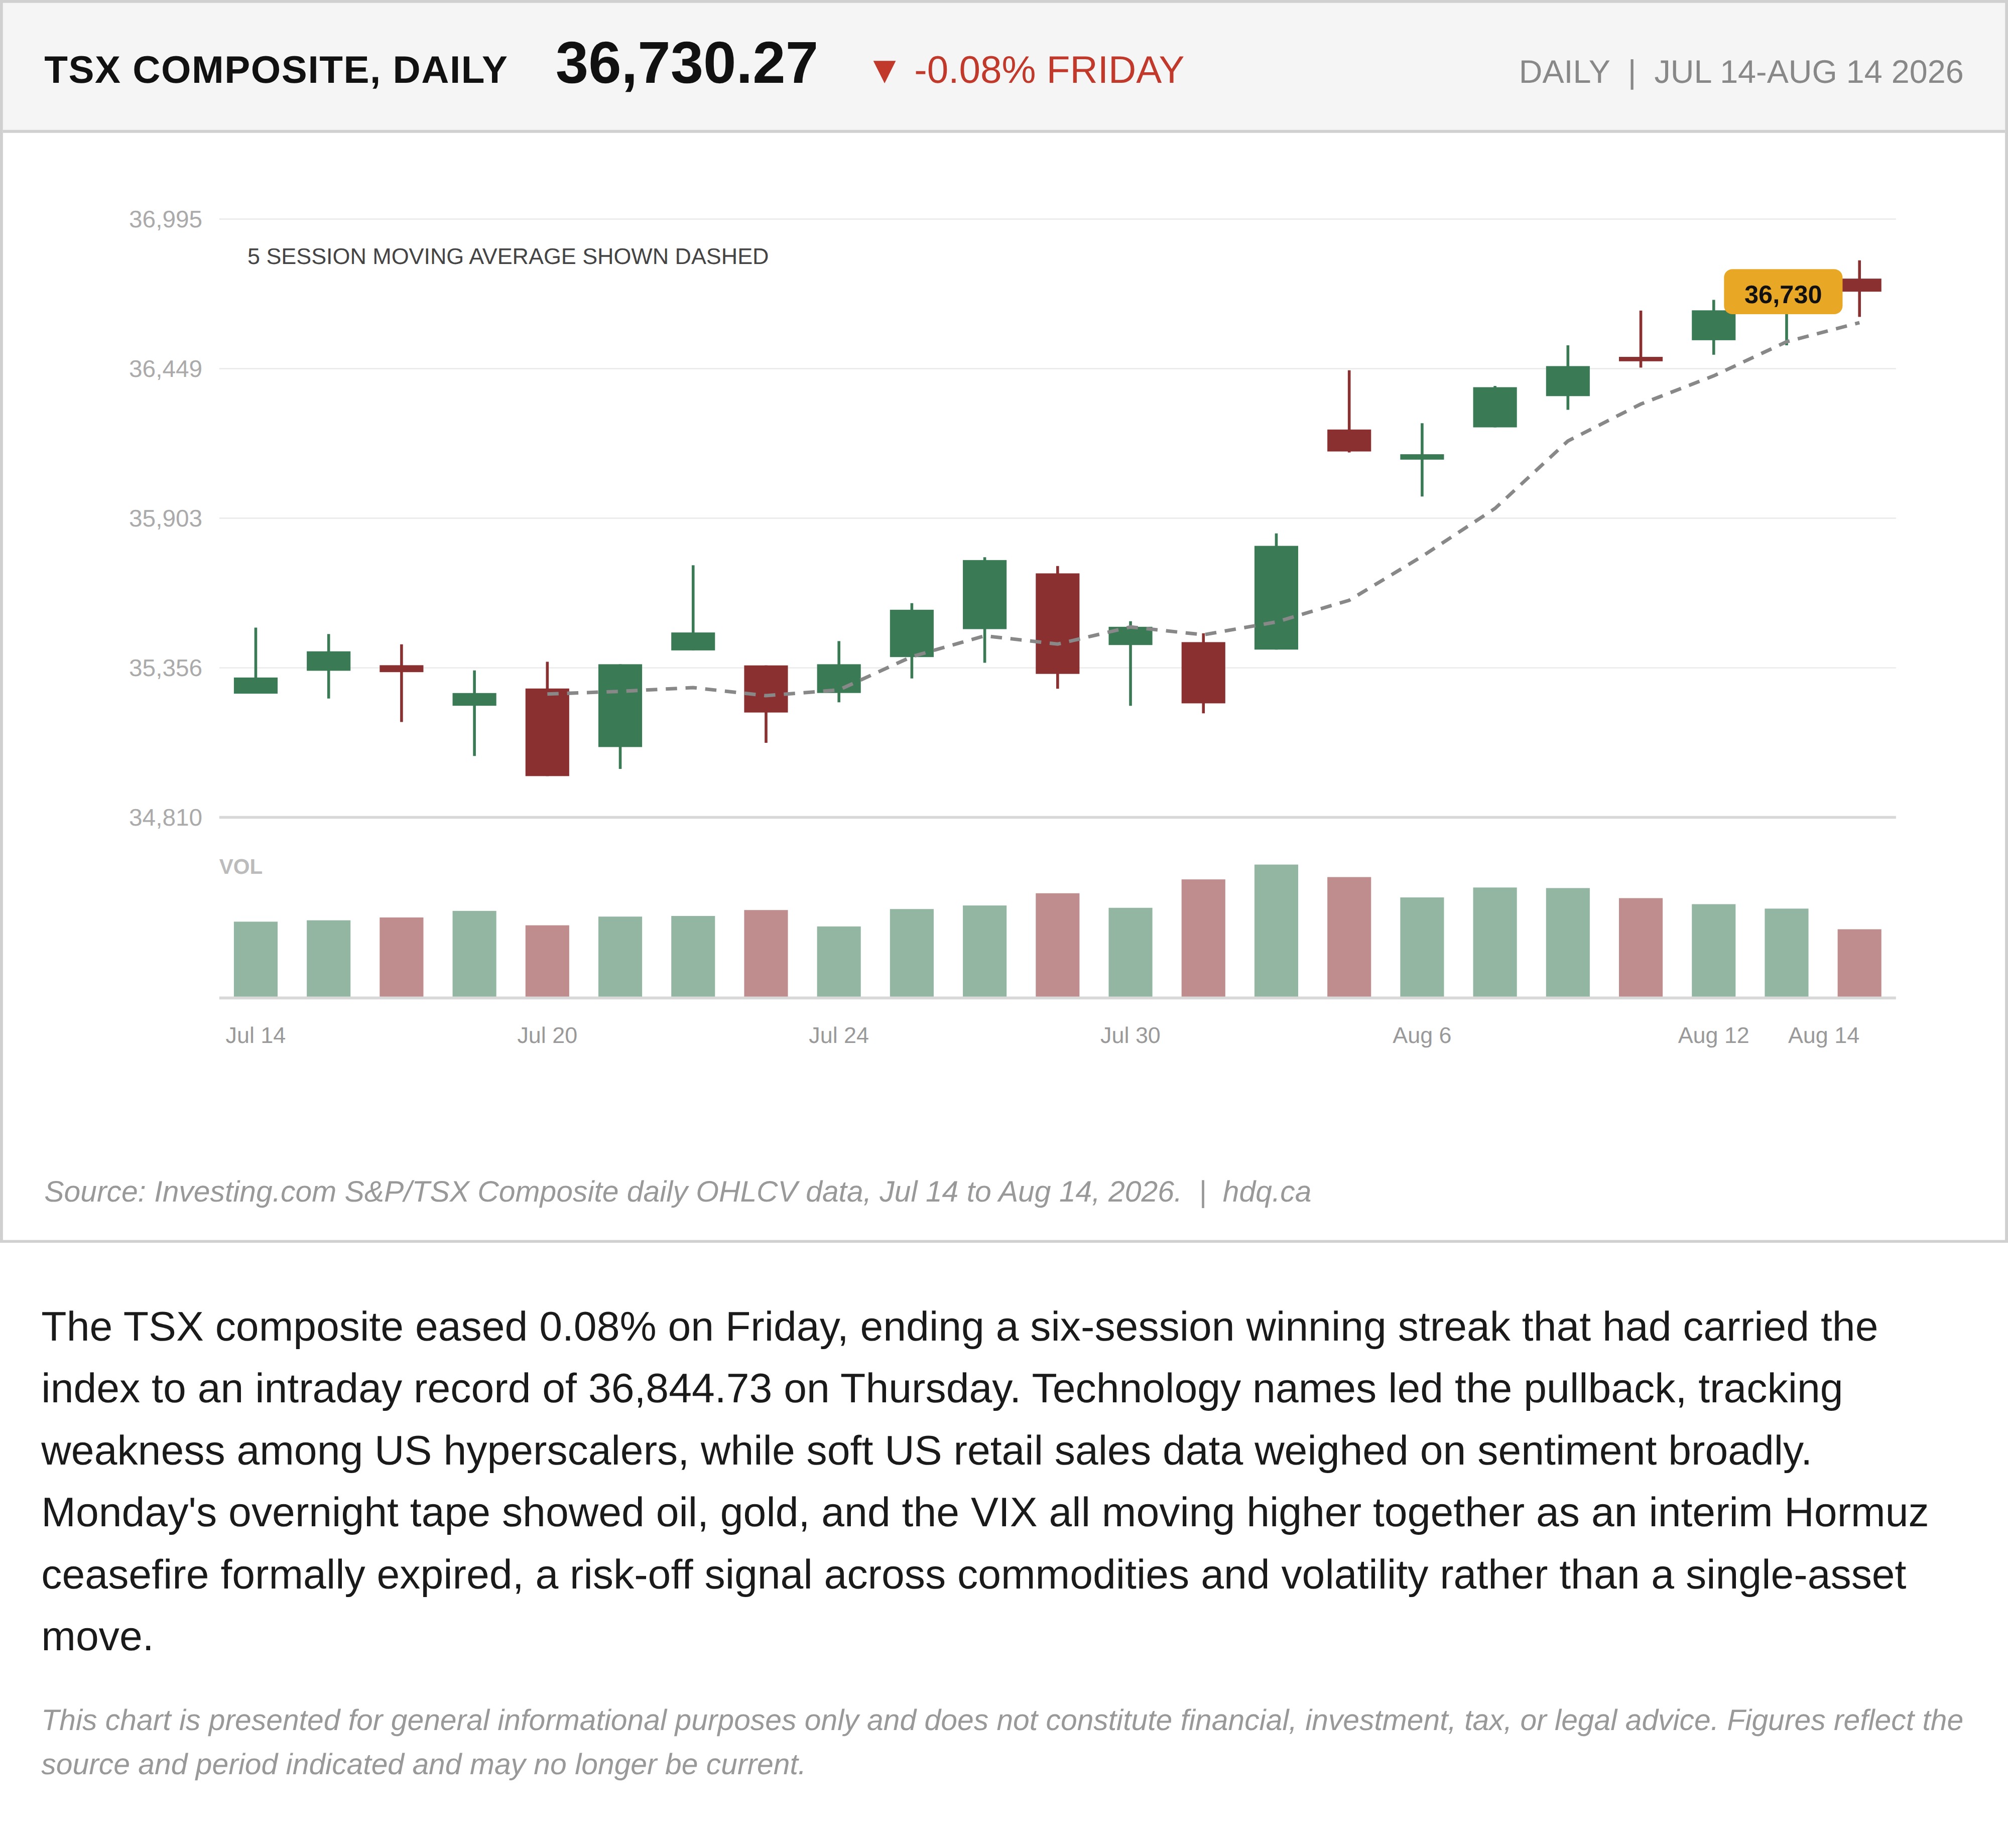
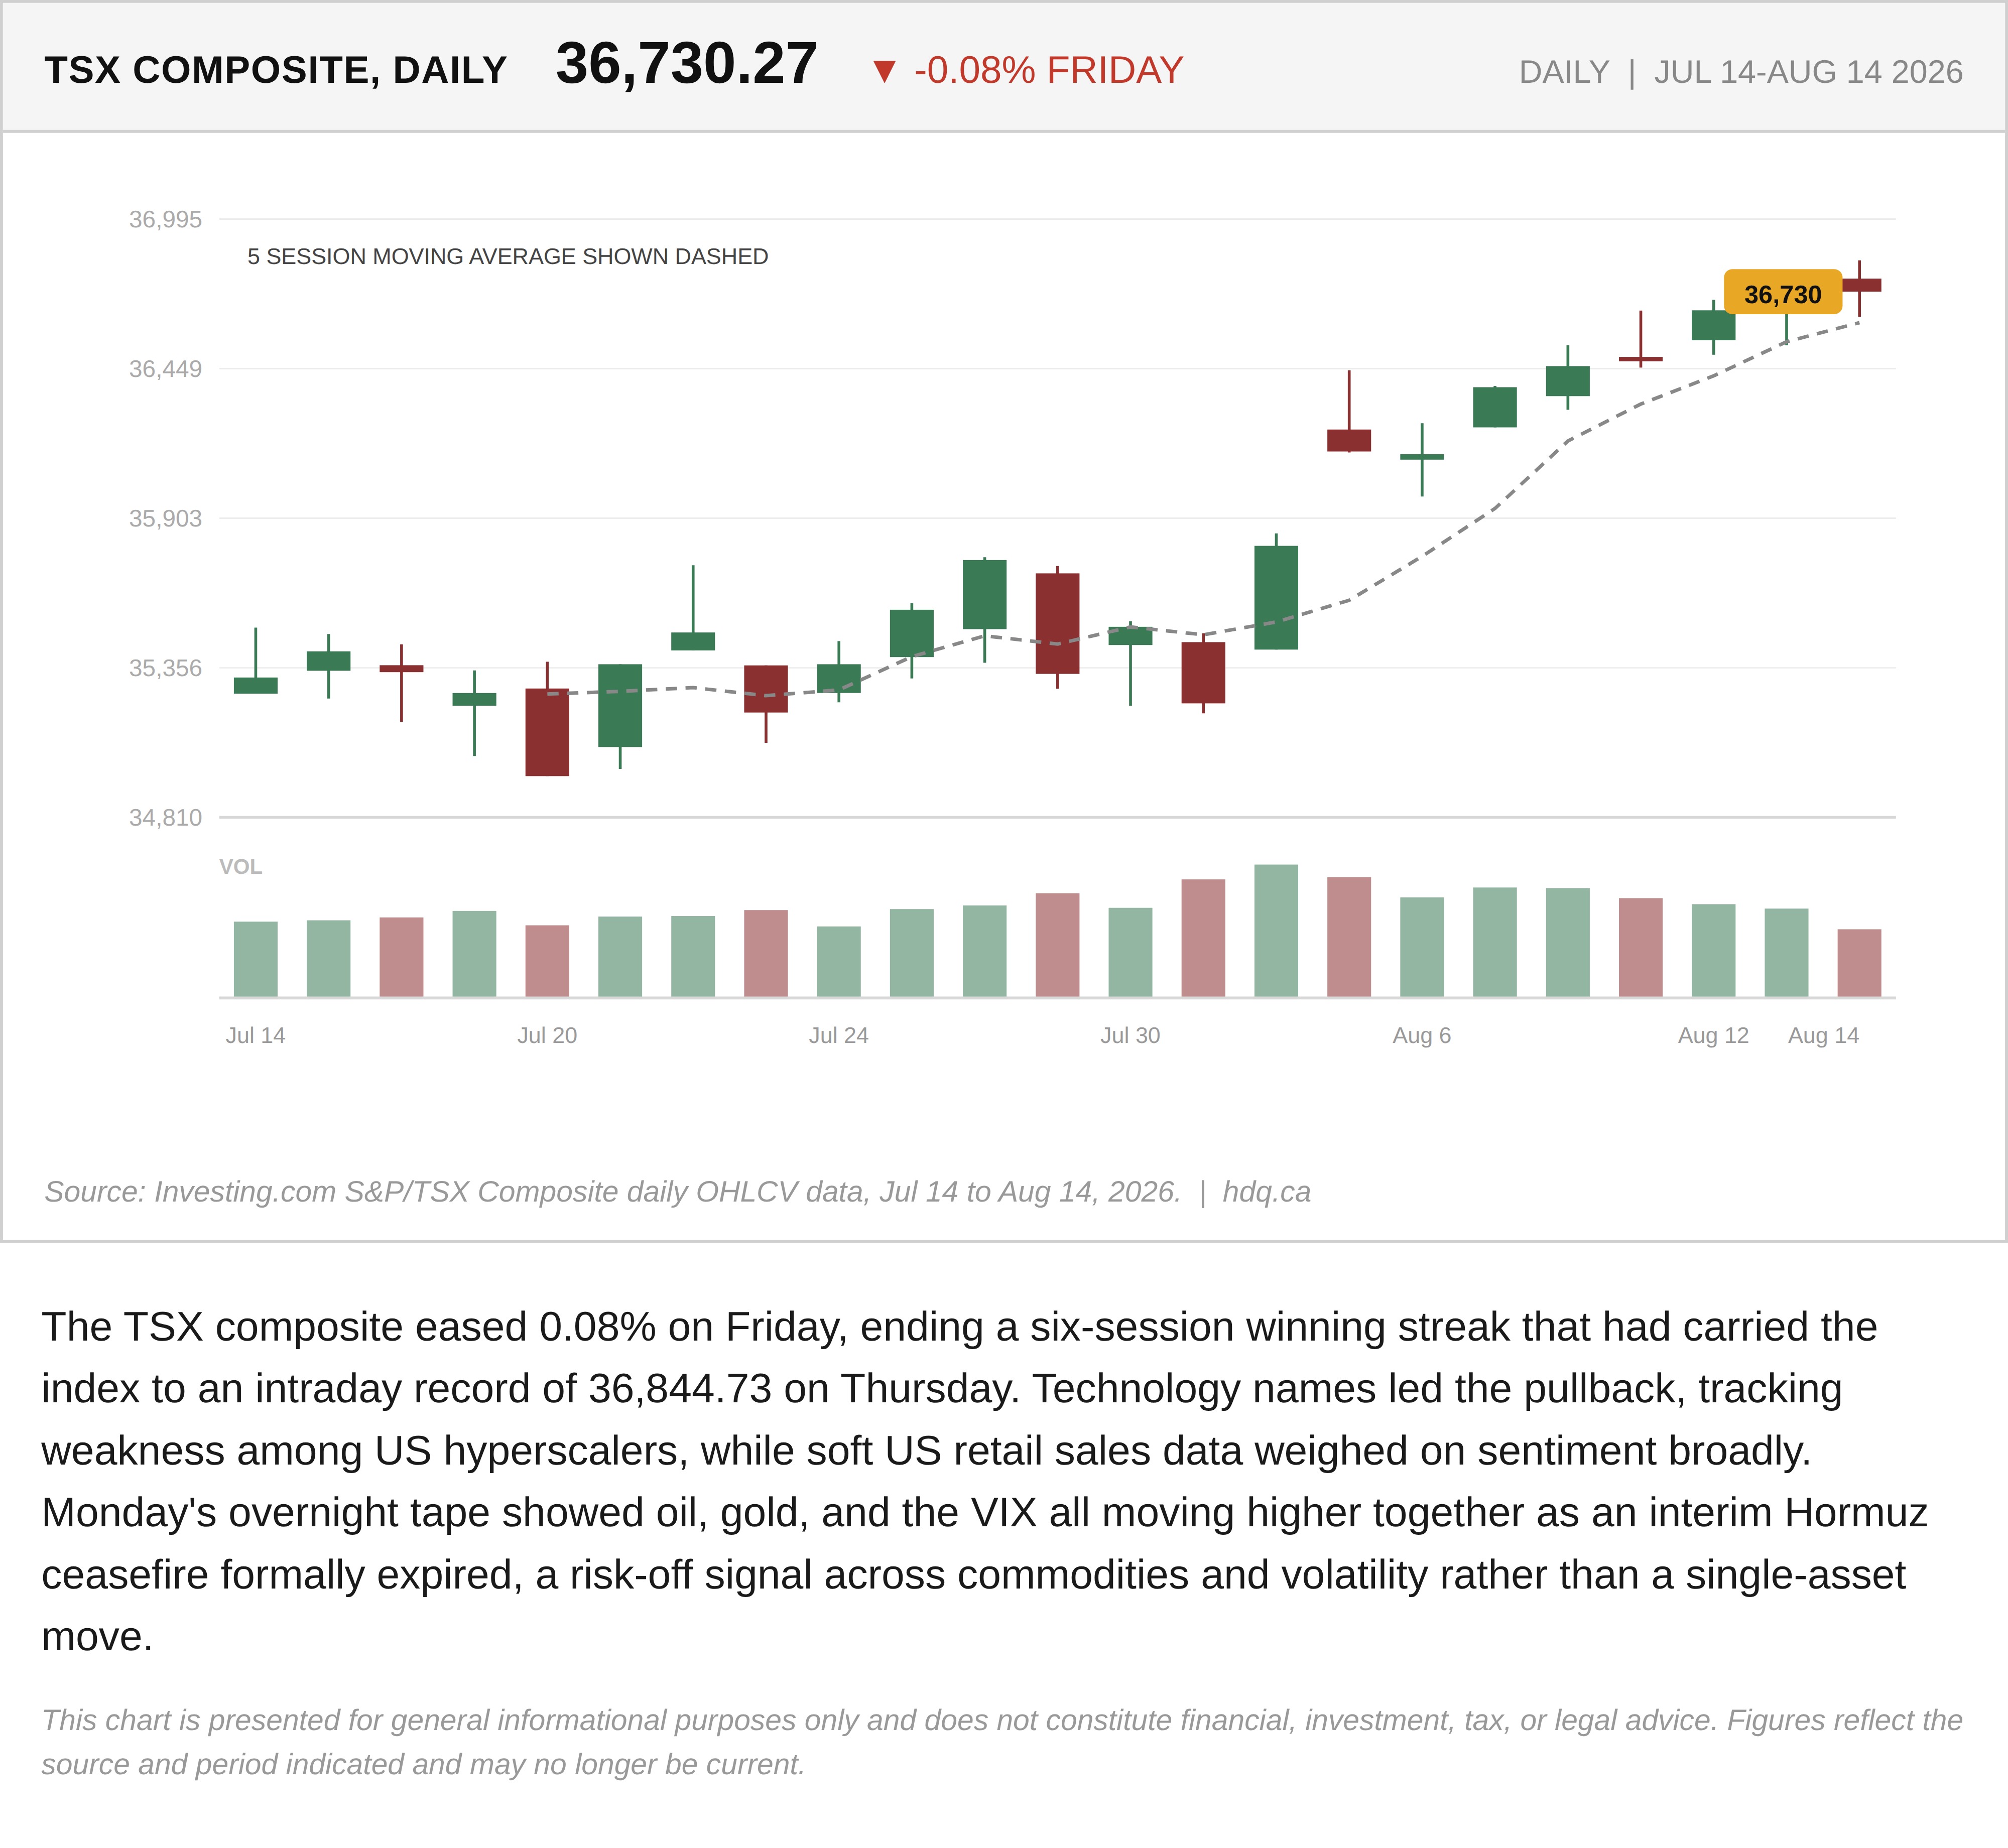
The TSX composite eased 0.08% on Friday, ending a six-session winning streak that had carried the index to an intraday record of 36,844.73 on Thursday. Technology names led the pullback, tracking weakness among US hyperscalers, while soft US retail sales data weighed on sentiment broadly. Monday's overnight tape showed oil, gold, and the VIX all moving higher together as an interim Hormuz ceasefire formally expired, a risk-off signal across commodities and volatility rather than a single-asset move.
This chart is presented for general informational purposes only and does not constitute financial, investment, tax, or legal advice. Figures reflect the source and period indicated and may no longer be current.
Related charts
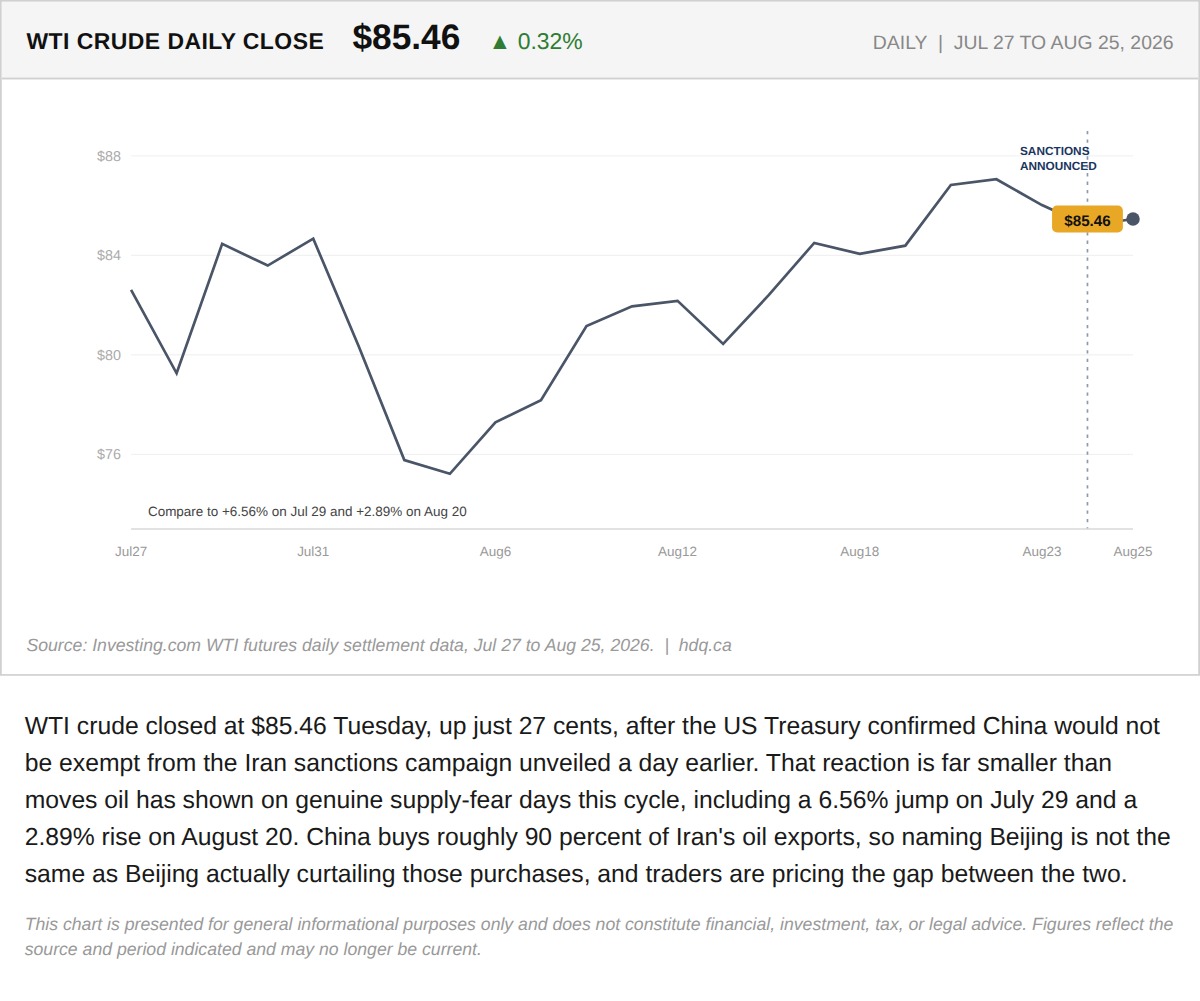
WTI crude closed at $85.46 Tuesday, up just 27 cents, after the US Treasury confirmed China would not be exempt from the Iran sanctions campaign unveiled a day earlier.
WTI Barely Moves After China Loses Its Iran Sanctions Exemption
August 25, 2026
View chart & download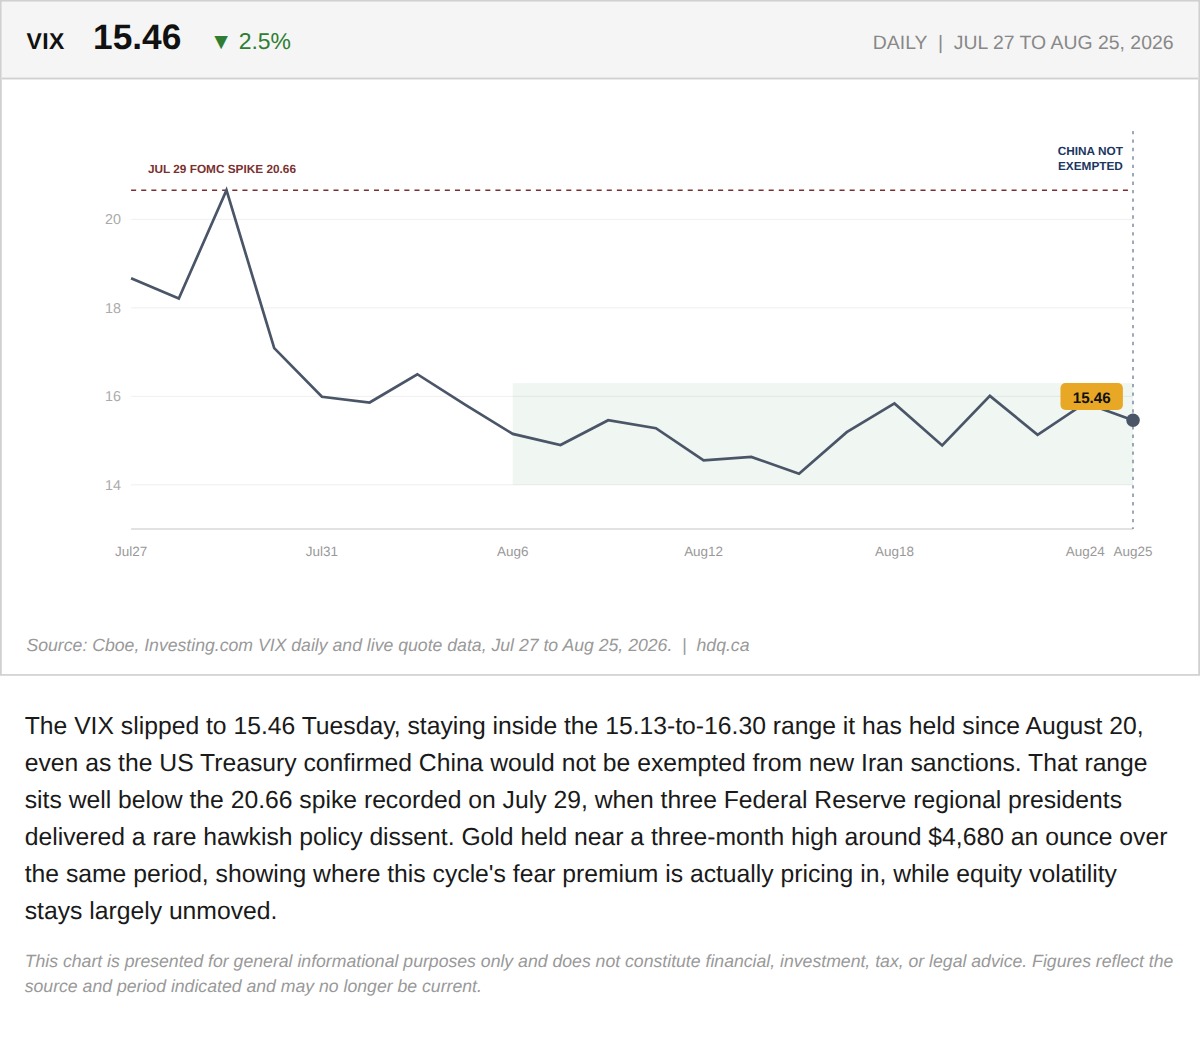
The VIX slipped to 15.46 Tuesday, staying inside the 15.13-to-16.30 range it has held since August 20, even as the US Treasury confirmed…
VIX Holds Below 16.3 Even as China's Iran Exemption Ends
August 25, 2026
View chart & download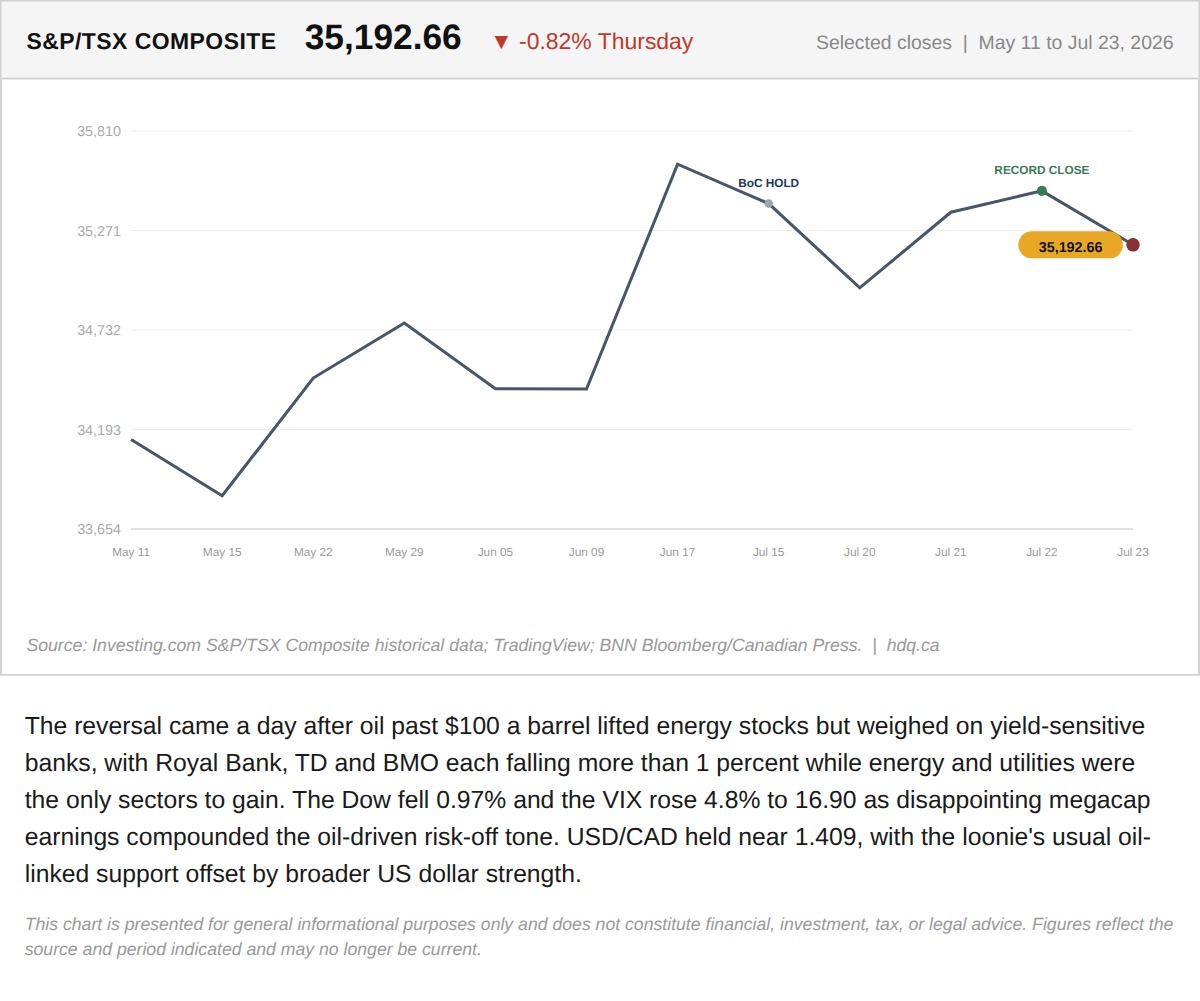
The reversal came a day after oil past $100 a barrel lifted energy stocks but weighed on yield-sensitive banks, with Royal Bank, TD and BMO…
Record High, Then a Bank-Led Reversal: Inside Thursday's TSX Split
July 24, 2026
View chart & download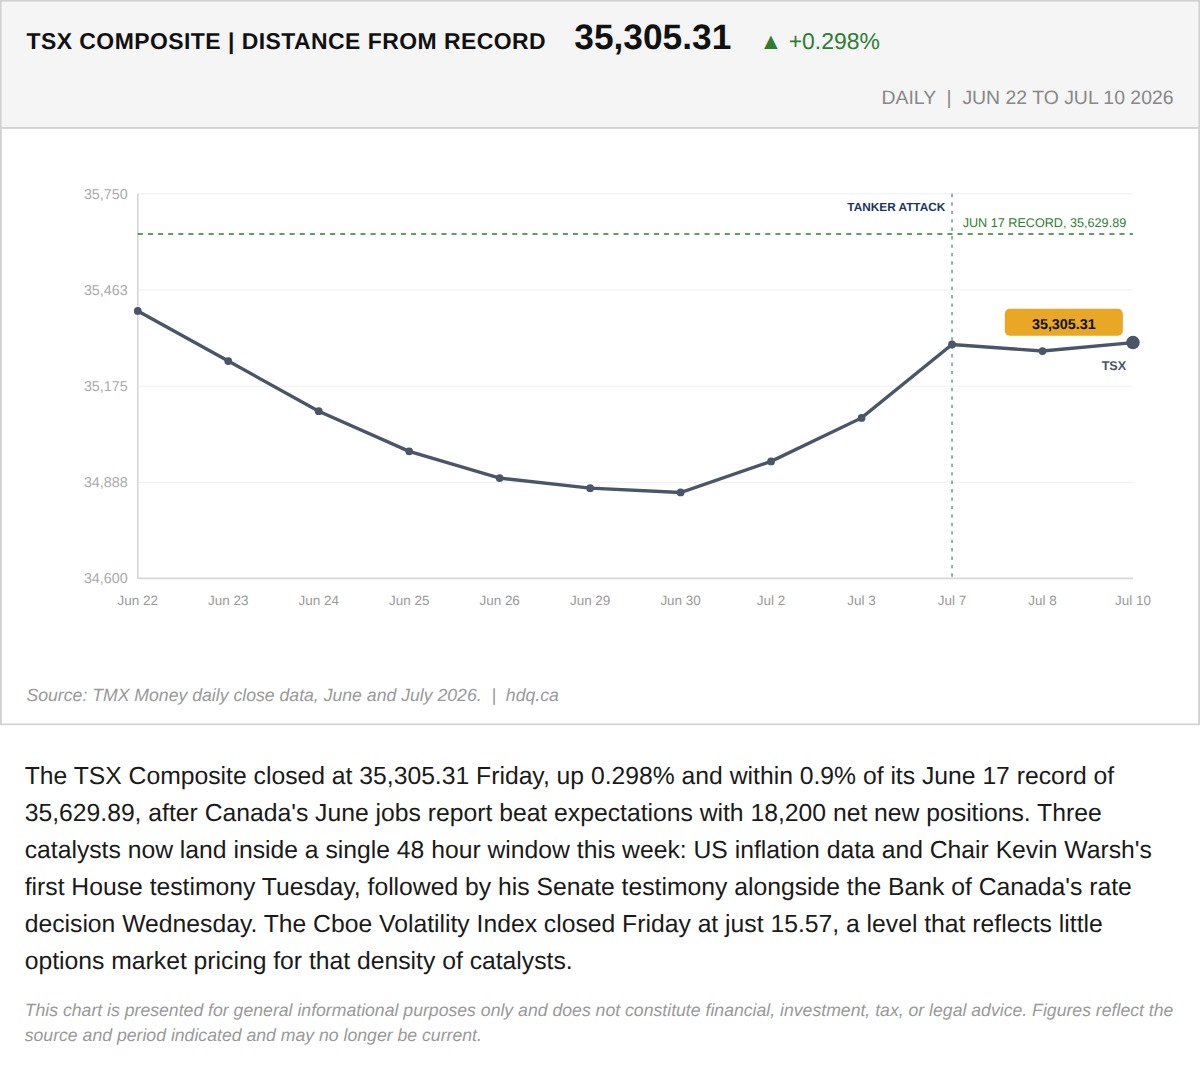
The TSX Composite closed at 35,305.31 Friday, up 0.298% and within 0.9% of its June 17 record of 35,629.89, after Canada's June jobs report…
324 Points From a Record, the TSX Heads Into Its Busiest 48 Hours of the Summer
July 13, 2026
View chart & download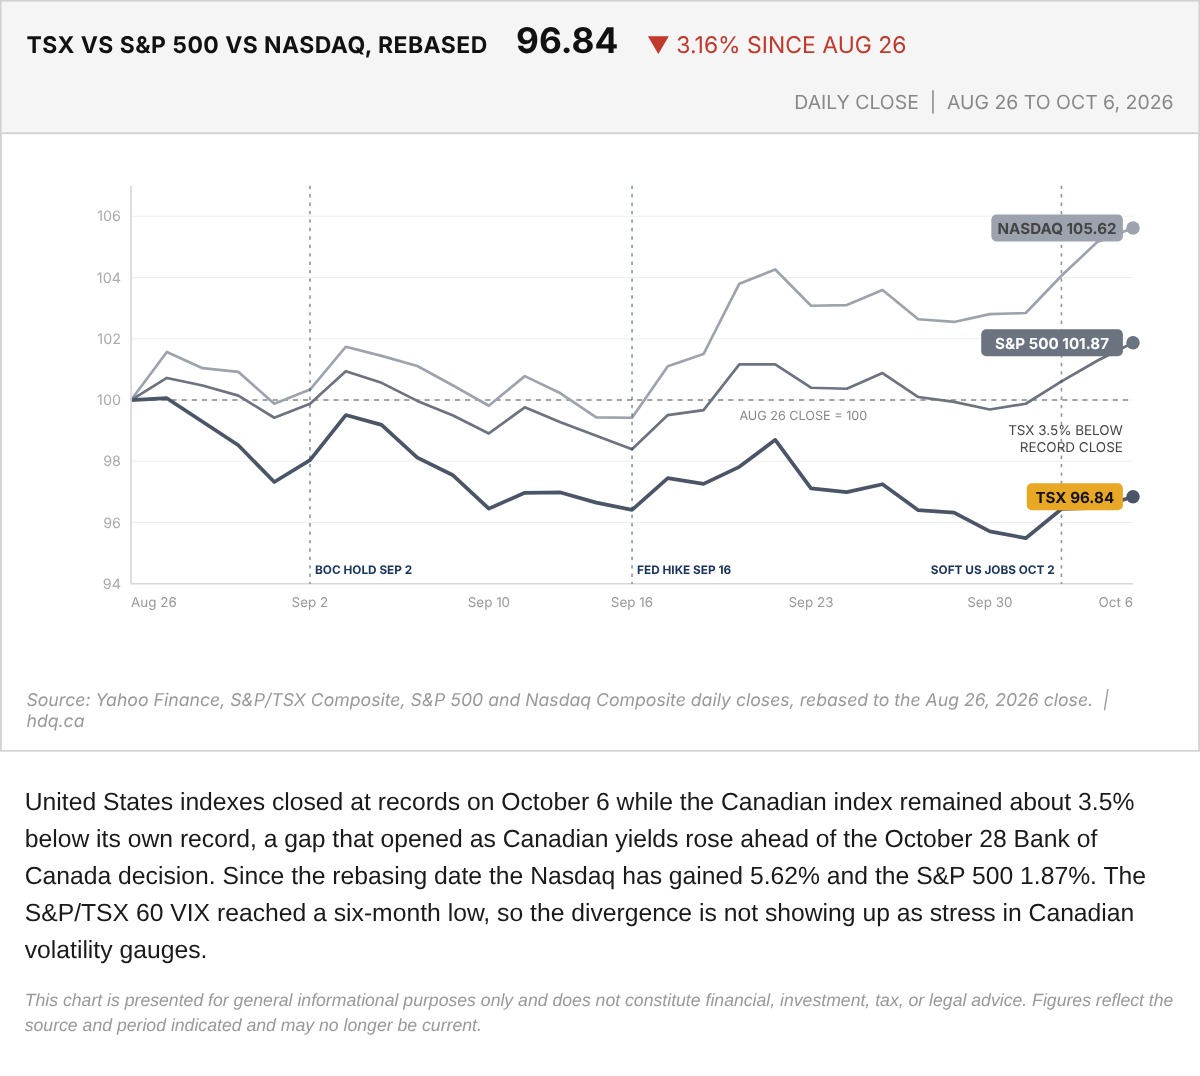
United States indexes closed at records on October 6 while the Canadian index remained about 3.5% below its own record, a gap that opened…
TSX, S&P 500 and Nasdaq Rebased to the August 26 Close
October 7, 2026
View chart & download
Brent was the only one of the three to finish above its starting level, while the index and gold both fell.
Brent, TSX and Gold Rebased to the August 31 Close
September 30, 2026
View chart & download