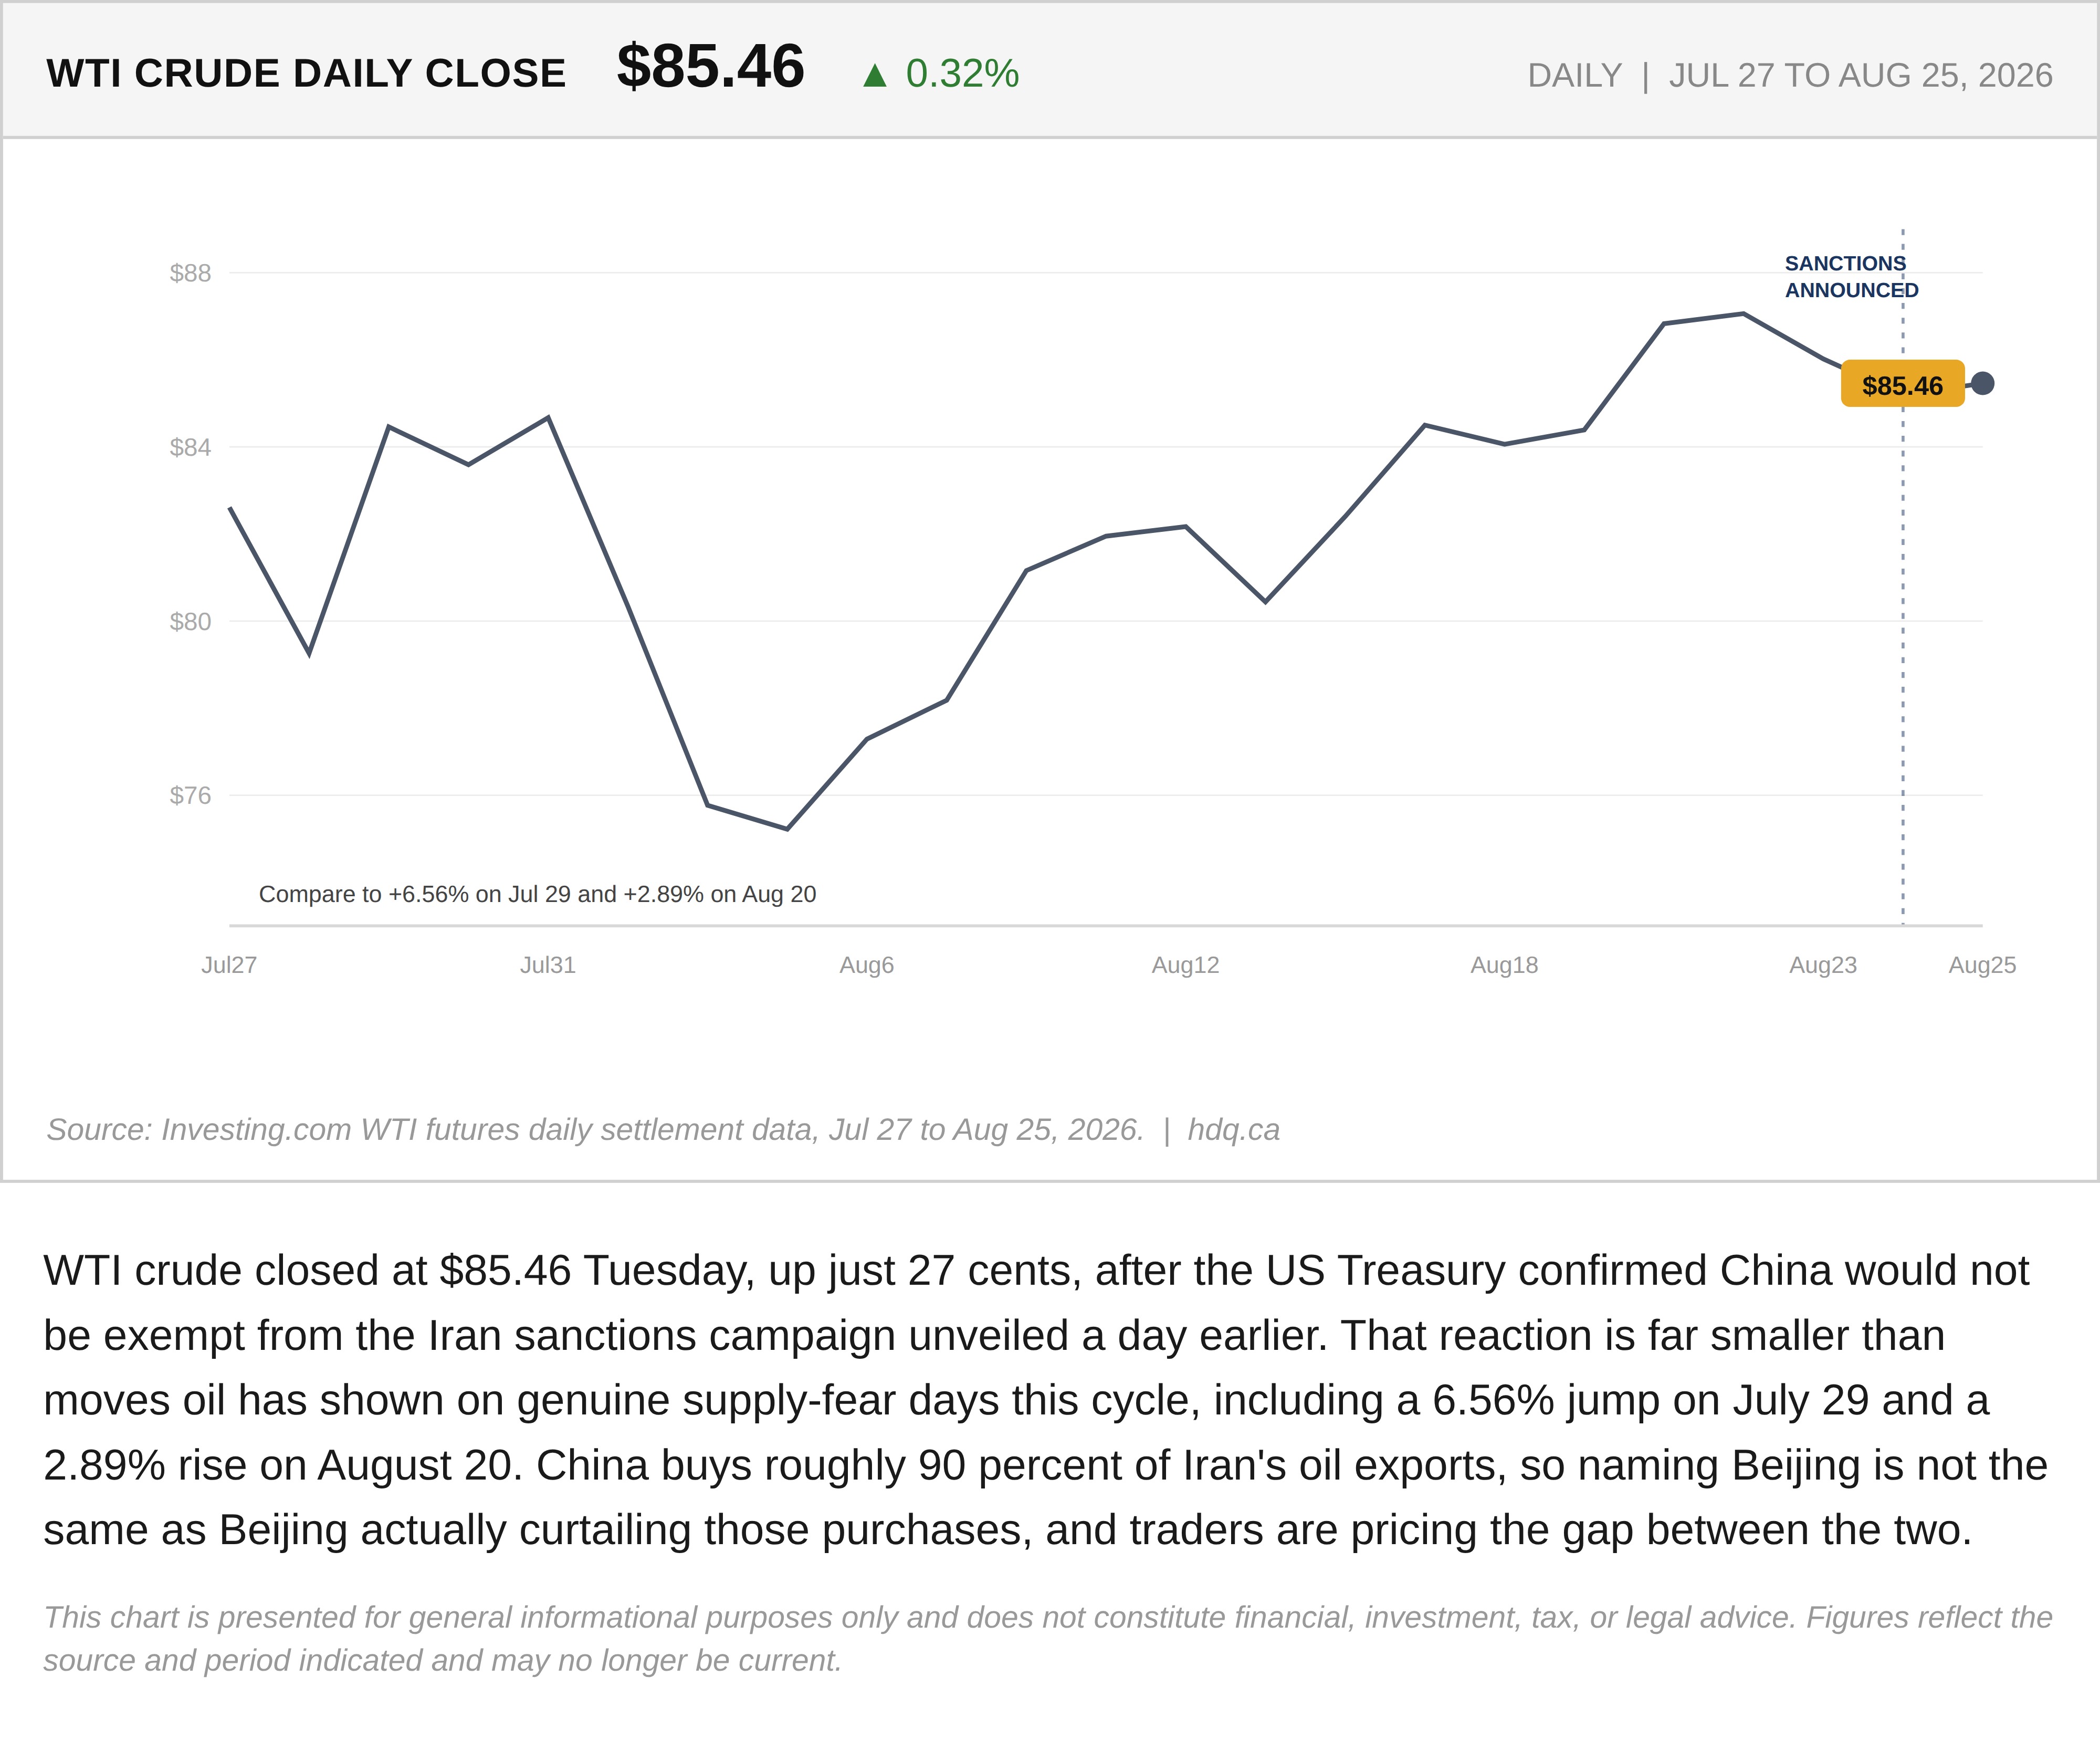
WTI crude closed at $85.46 Tuesday, up just 27 cents, after the US Treasury confirmed China would not be exempt from the Iran sanctions campaign unveiled a day earlier. That reaction is far smaller than moves oil has shown on genuine supply-fear days this cycle, including a 6.56% jump on July 29 and a 2.89% rise on August 20. China buys roughly 90 percent of Iran's oil exports, so naming Beijing is not the same as Beijing actually curtailing those purchases, and traders are pricing the gap between the two.
This chart is presented for general informational purposes only and does not constitute financial, investment, tax, or legal advice. Figures reflect the source and period indicated and may no longer be current.
Related charts
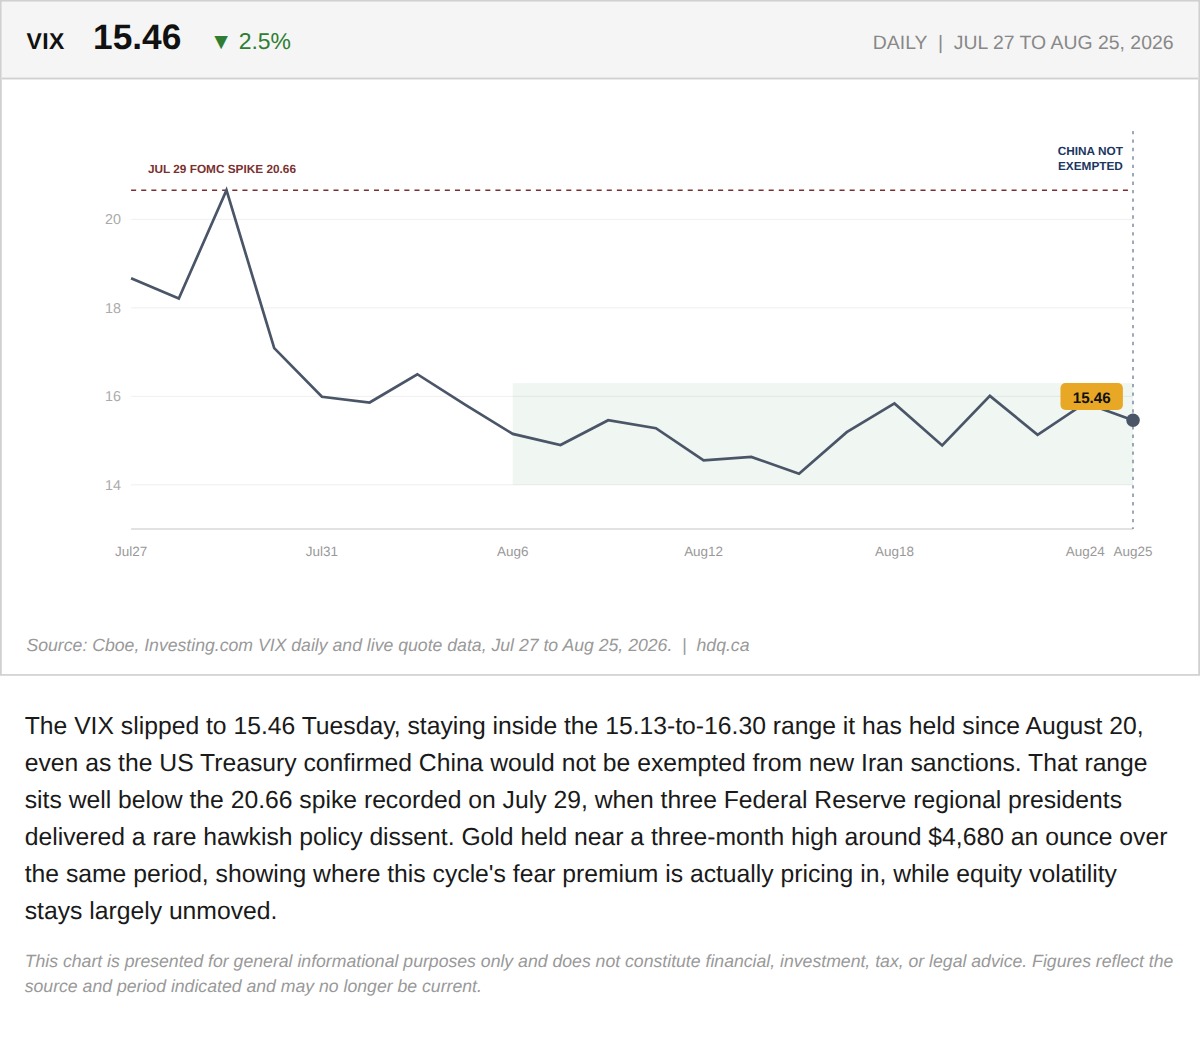
The VIX slipped to 15.46 Tuesday, staying inside the 15.13-to-16.30 range it has held since August 20, even as the US Treasury confirmed…
VIX Holds Below 16.3 Even as China's Iran Exemption Ends
August 25, 2026
View chart & download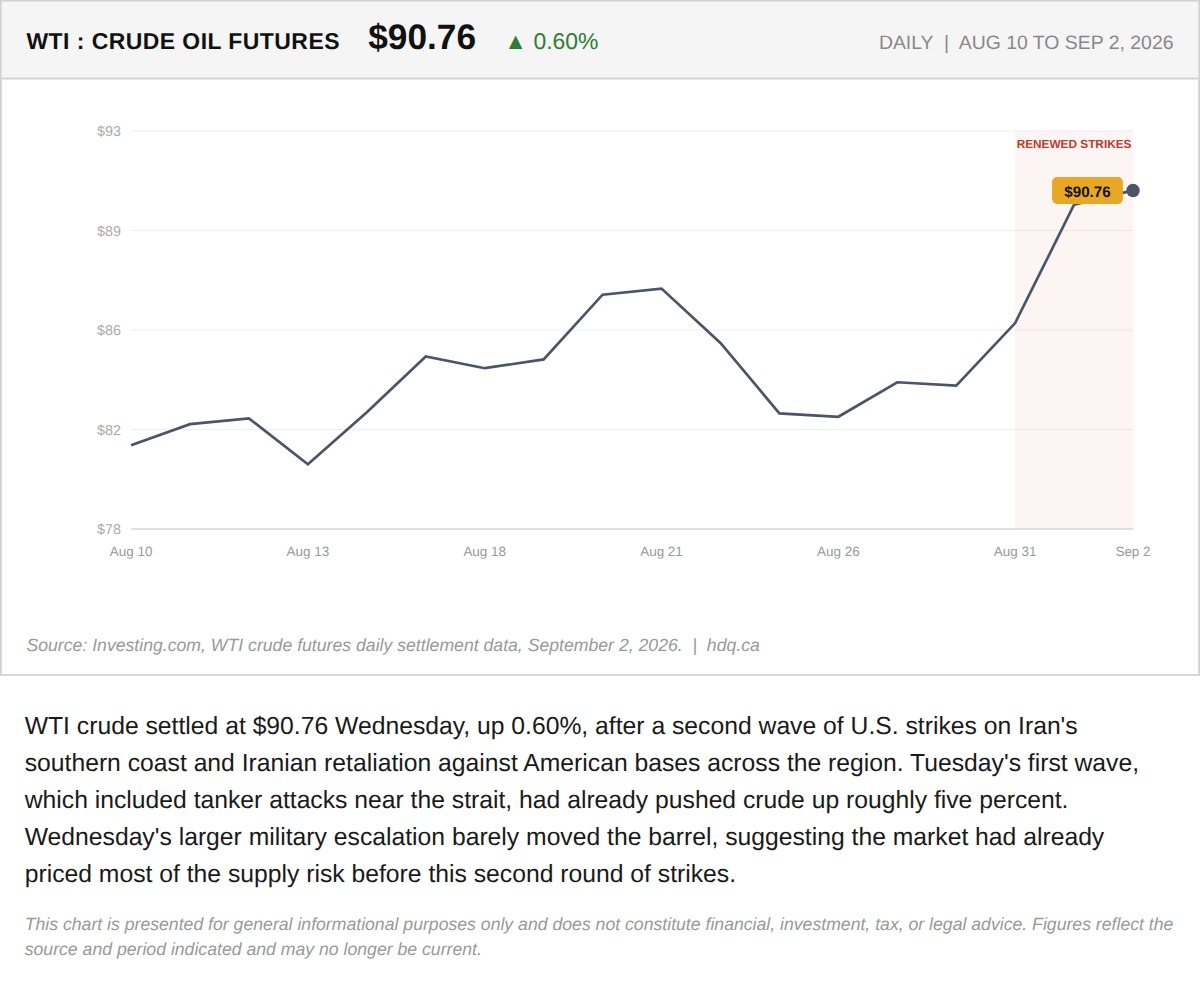
WTI crude settled at $90.76 Wednesday, up 0.60%, after a second wave of U.S.
WTI Crude Adds 0.60% as a Second Wave of Strikes Near Iran Barely Moves the Barrel
September 2, 2026
View chart & download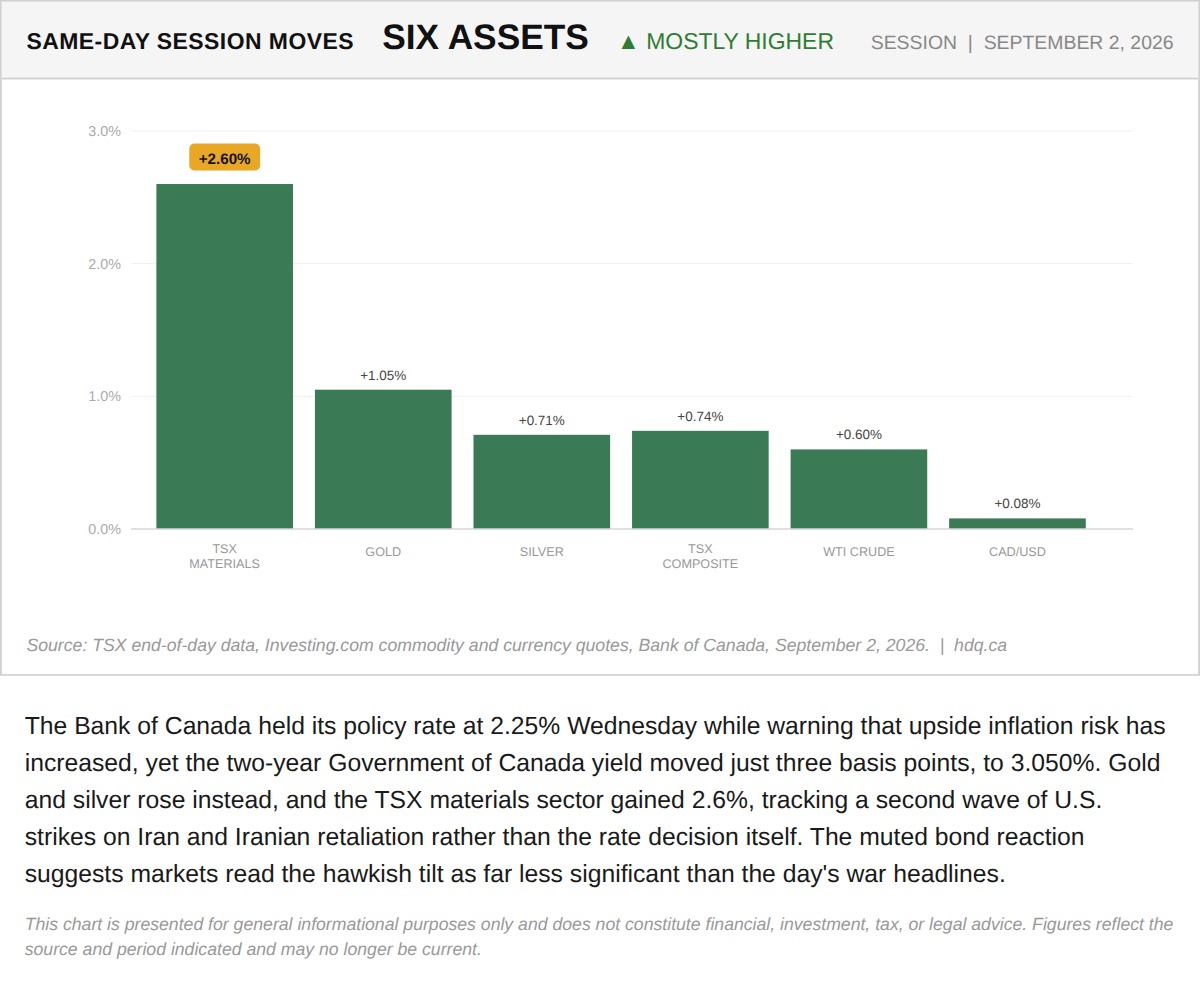
The Bank of Canada held its policy rate at 2.25% Wednesday while warning that upside inflation risk has increased, yet the two-year…
TSX Materials, Gold and Silver Lead a Broad Same-Day Rally Across Six Assets
September 2, 2026
View chart & download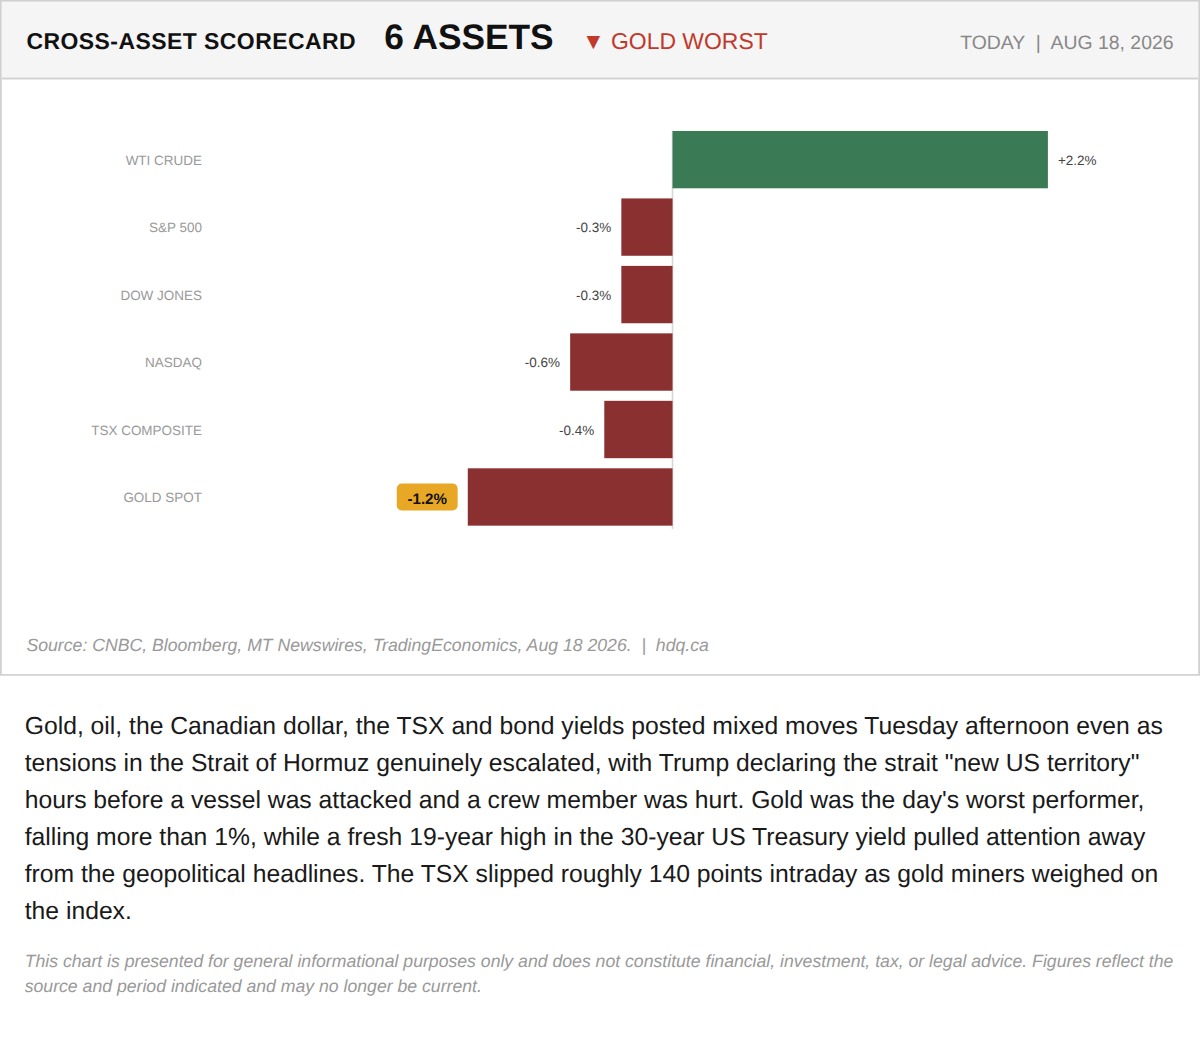
Gold, oil, the Canadian dollar, the TSX and bond yields posted mixed moves Tuesday afternoon even as tensions in the Strait of Hormuz…
Cross-Asset Scorecard as Hormuz Escalates
August 18, 2026
View chart & download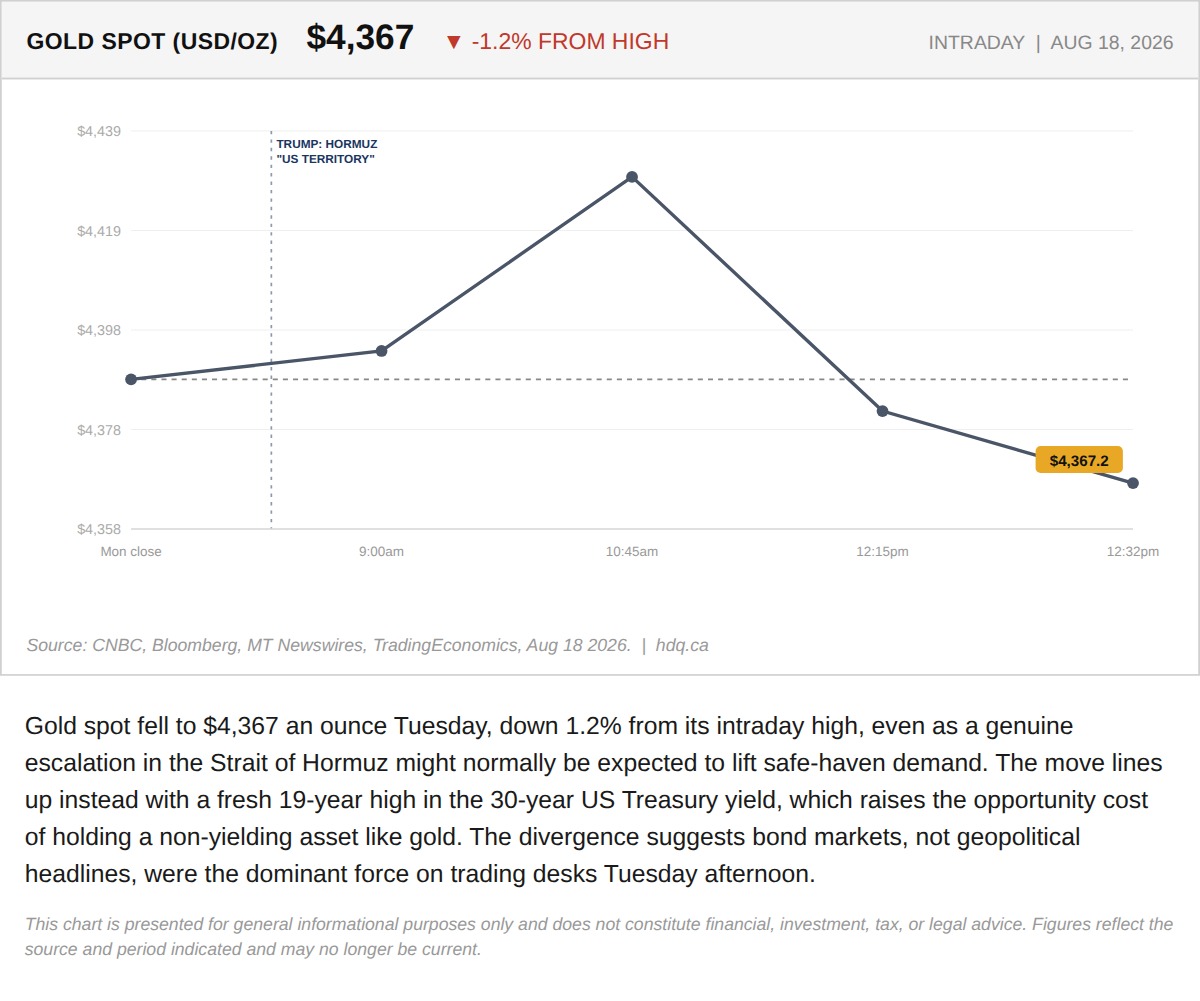
Gold spot fell to $4,367 an ounce Tuesday, down 1.2% from its intraday high, even as a genuine escalation in the Strait of Hormuz might…
Gold Falls as Treasury Yields Hit a 19-Year High
August 18, 2026
View chart & download
The S&P/TSX Composite closed July at 35,226, up 1.06% for the month, a modest headline figure that conceals sharp intra-month swings.
S&P/TSX Composite closes July up 1.06% after a volatile month
July 31, 2026
View chart & download