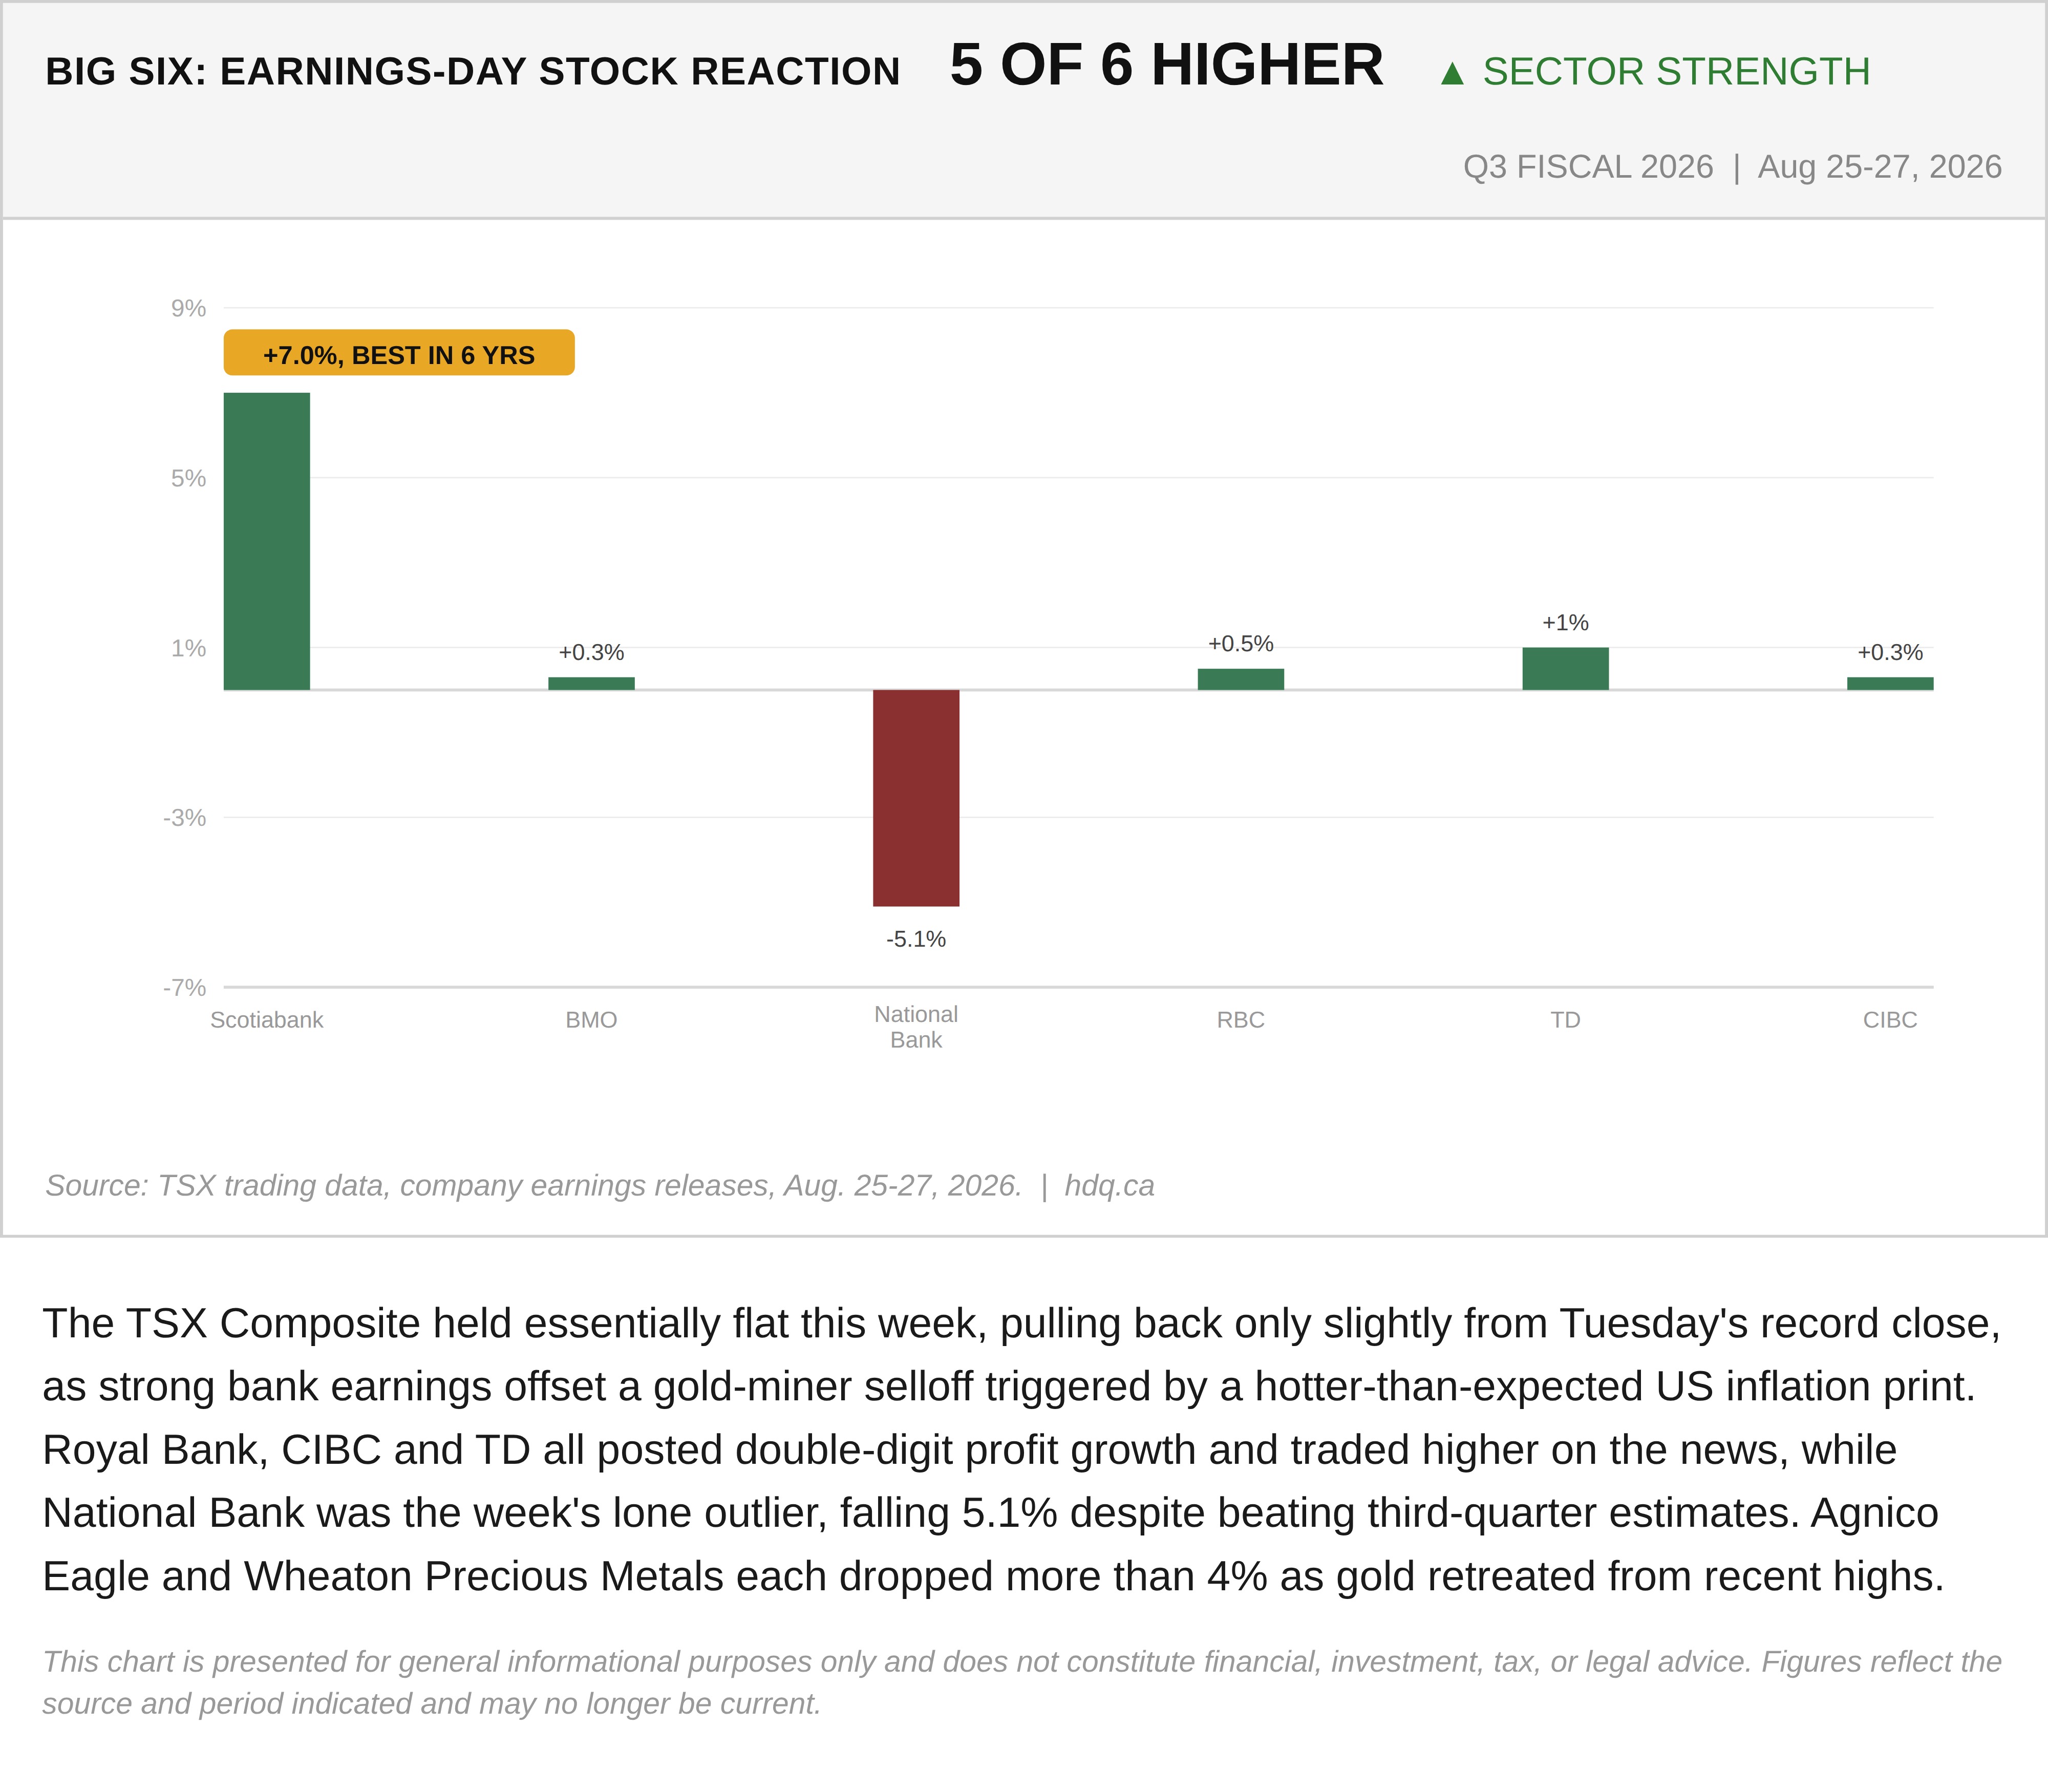
The TSX Composite held essentially flat this week, pulling back only slightly from Tuesday's record close, as strong bank earnings offset a gold-miner selloff triggered by a hotter-than-expected US inflation print. Royal Bank, CIBC and TD all posted double-digit profit growth and traded higher on the news, while National Bank was the week's lone outlier, falling 5.1% despite beating third-quarter estimates. Agnico Eagle and Wheaton Precious Metals each dropped more than 4% as gold retreated from recent highs.
This chart is presented for general informational purposes only and does not constitute financial, investment, tax, or legal advice. Figures reflect the source and period indicated and may no longer be current.
Related charts
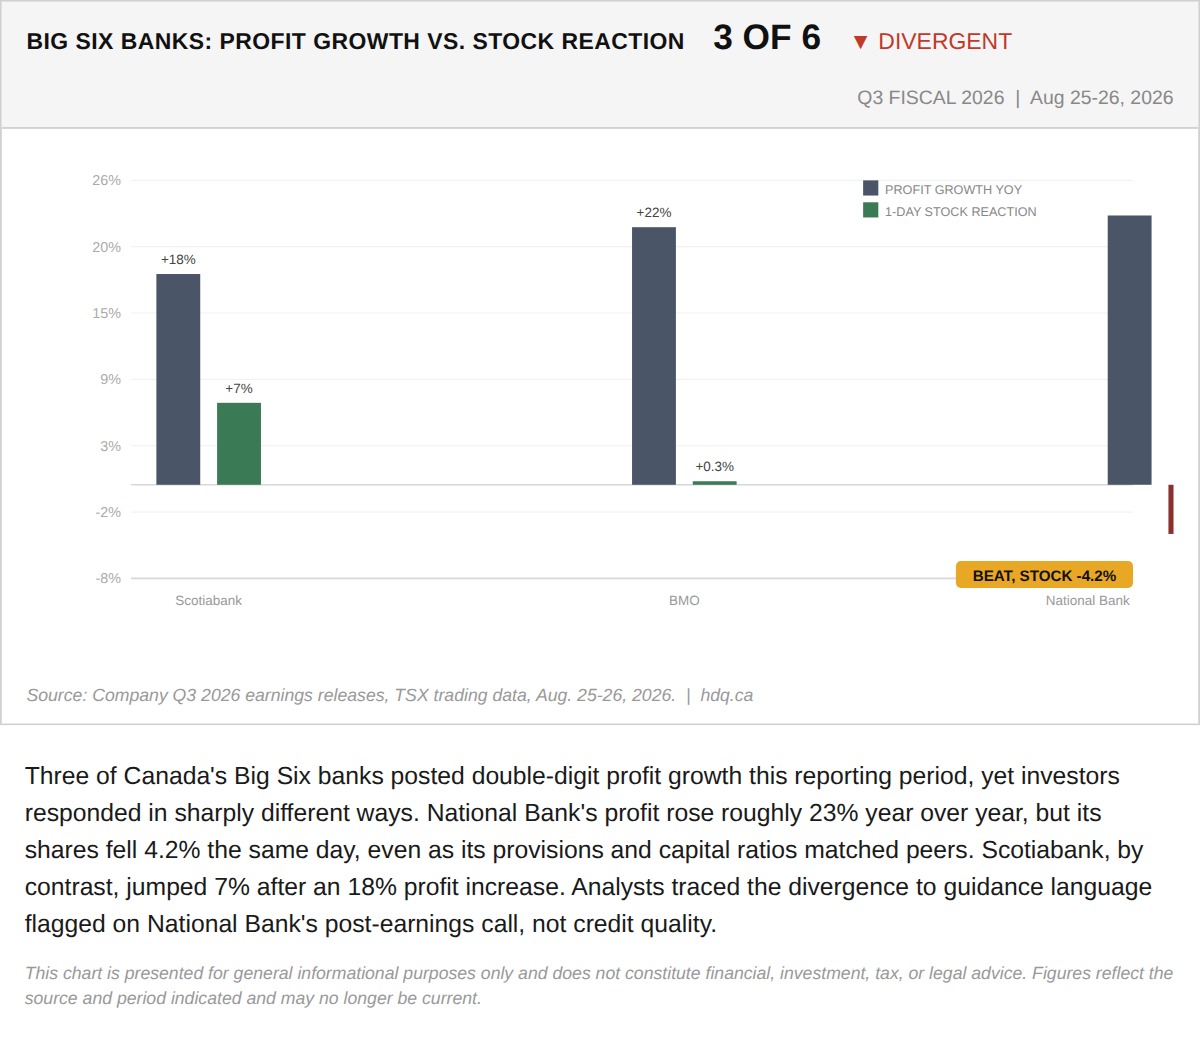
Three of Canada's Big Six banks posted double-digit profit growth this reporting period, yet investors responded in sharply different ways.
The Beat Isn't the Story: Why National Bank Fell on a 23% Profit Jump
August 27, 2026
View chart & download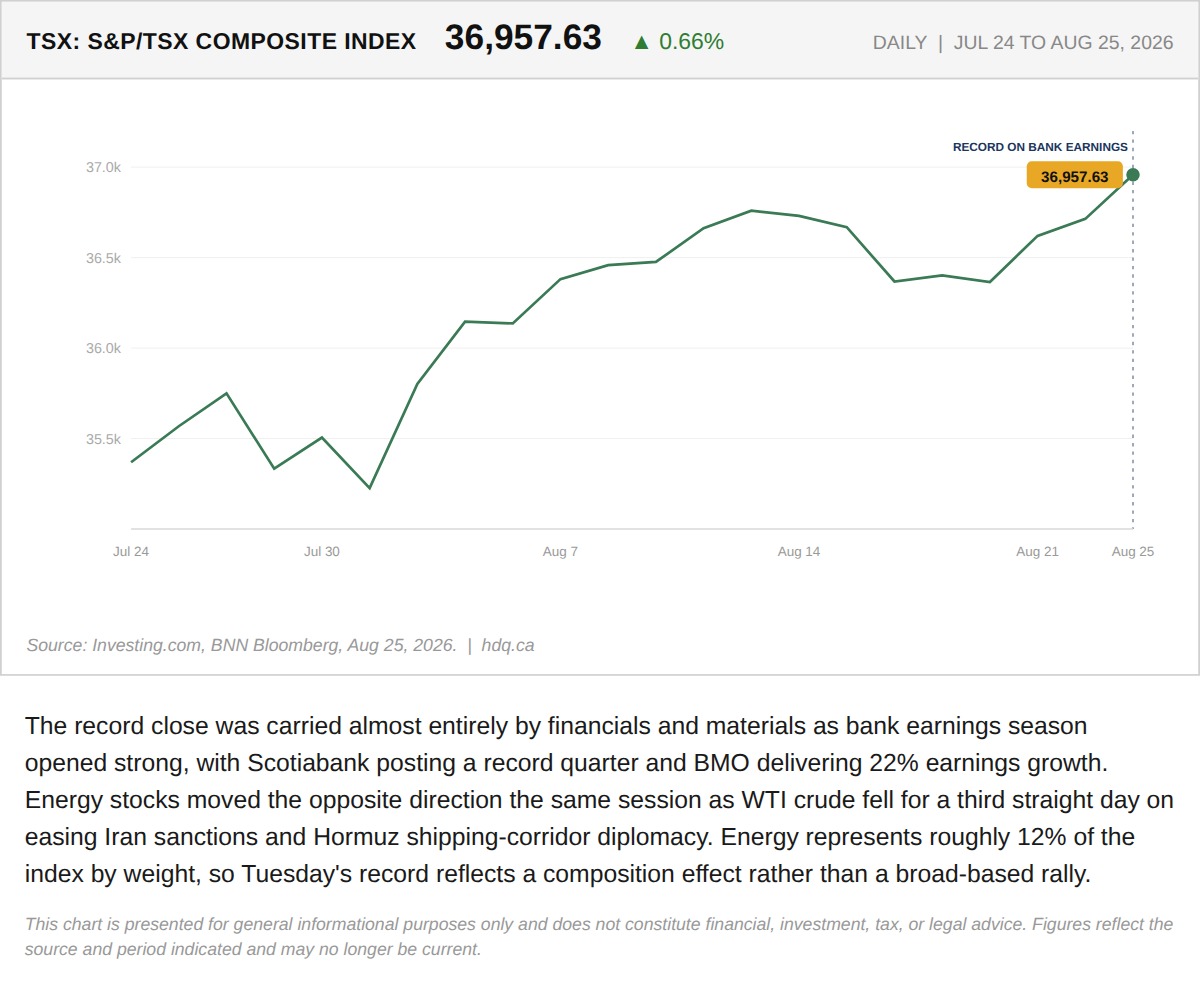
The record close was carried almost entirely by financials and materials as bank earnings season opened strong, with Scotiabank posting a…
The TSX Hit a Record High Tuesday. Only Two Sectors Actually Showed Up.
August 26, 2026
View chart & download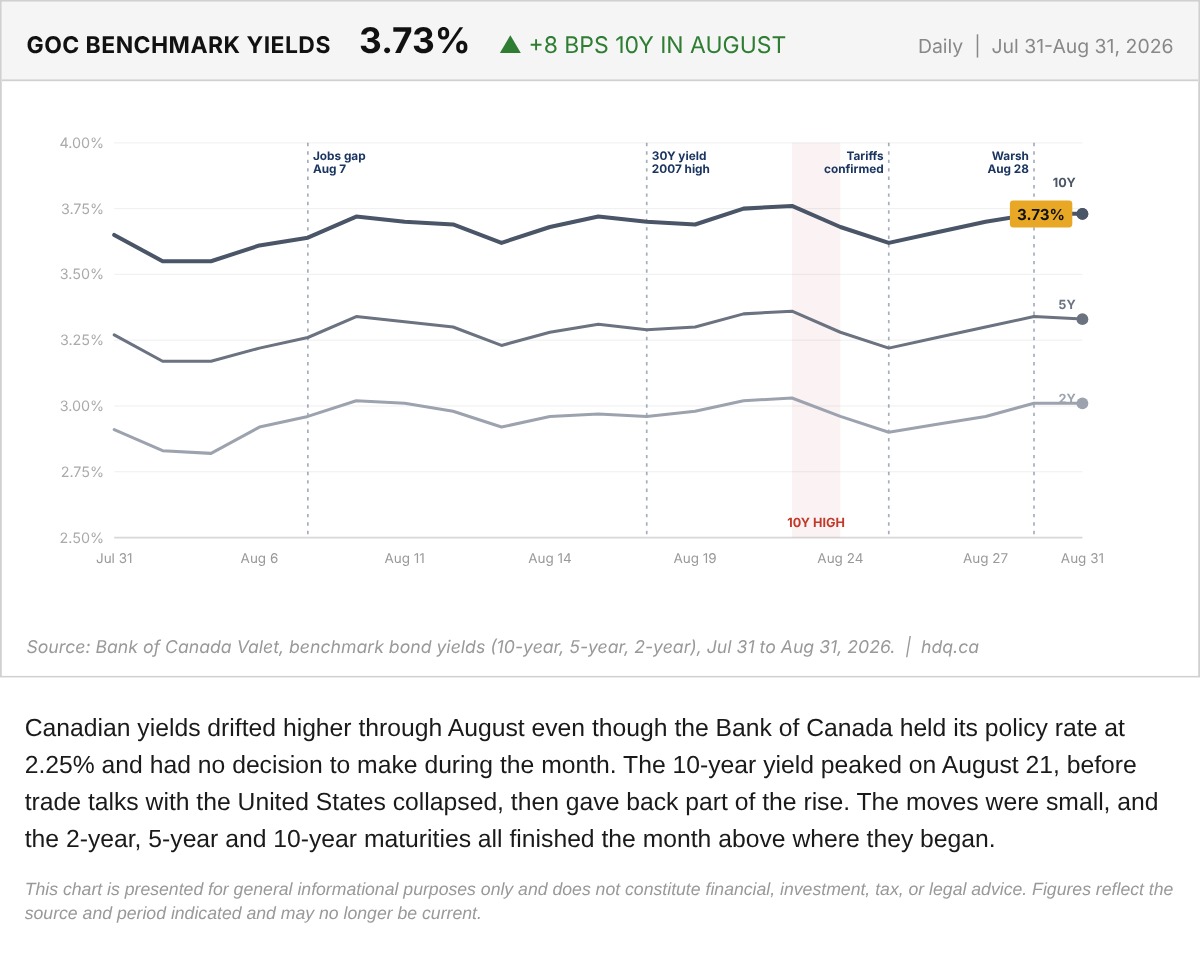
Canadian yields drifted higher through August even though the Bank of Canada held its policy rate at 2.25% and had no decision to make during the month.
Government of Canada Benchmark Yields, August 2026
August 31, 2026
View chart & download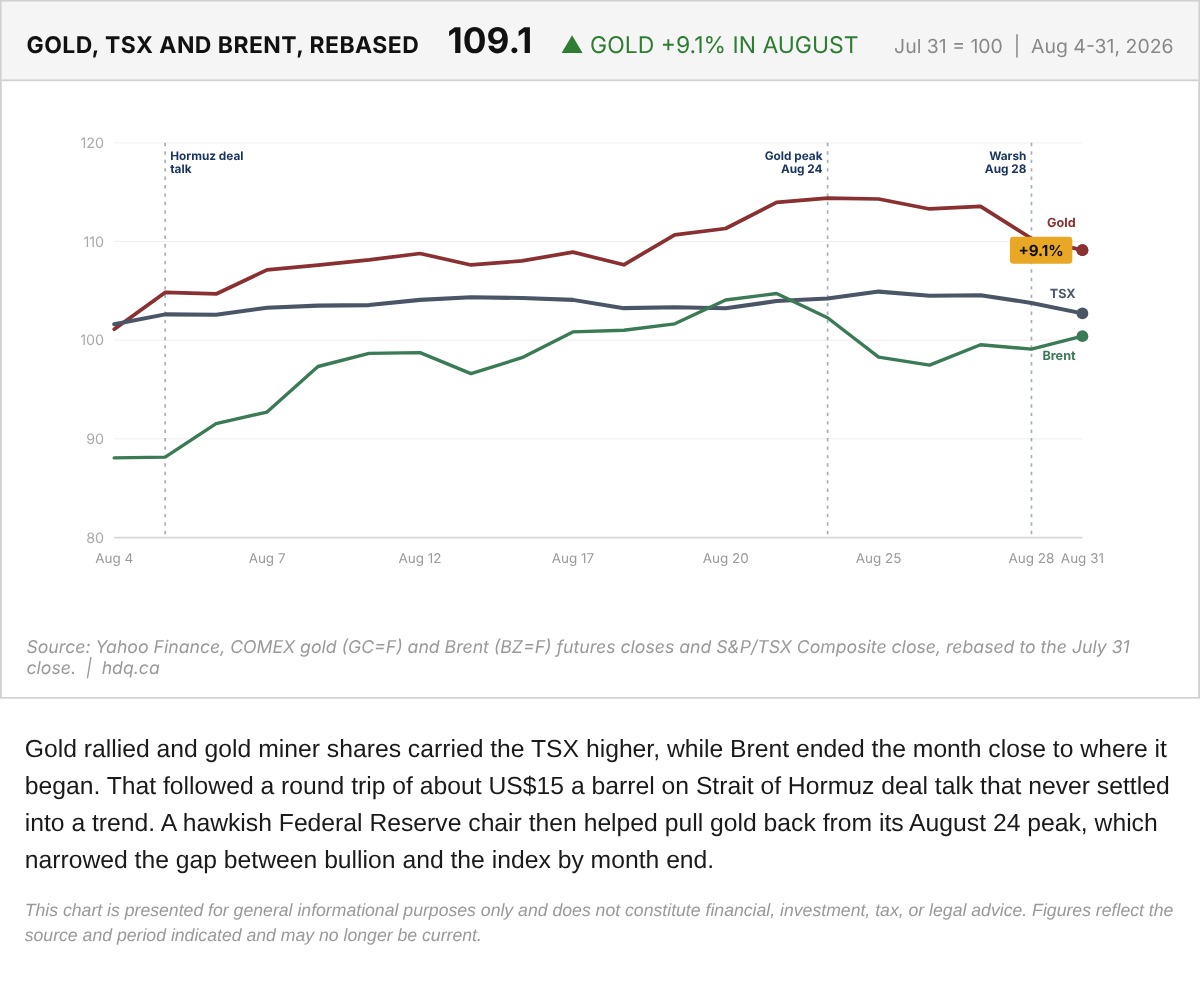
Gold rallied and gold miner shares carried the TSX higher, while Brent ended the month close to where it began.
Gold, TSX and Brent Rebased to the July 31 Close
August 31, 2026
View chart & download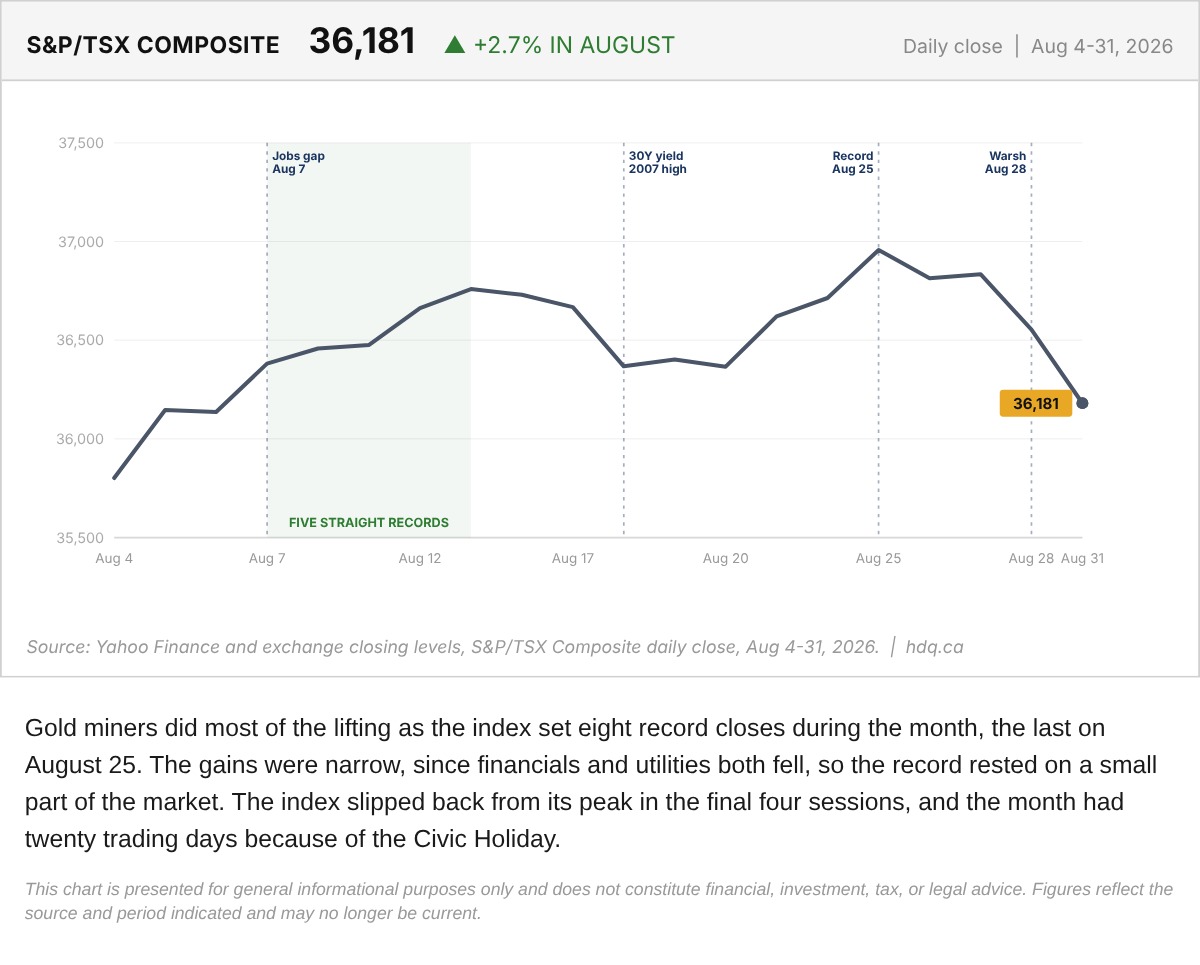
Gold miners did most of the lifting as the index set eight record closes during the month, the last on August 25.
S&P/TSX Composite Daily Close Through August 2026
August 31, 2026
View chart & download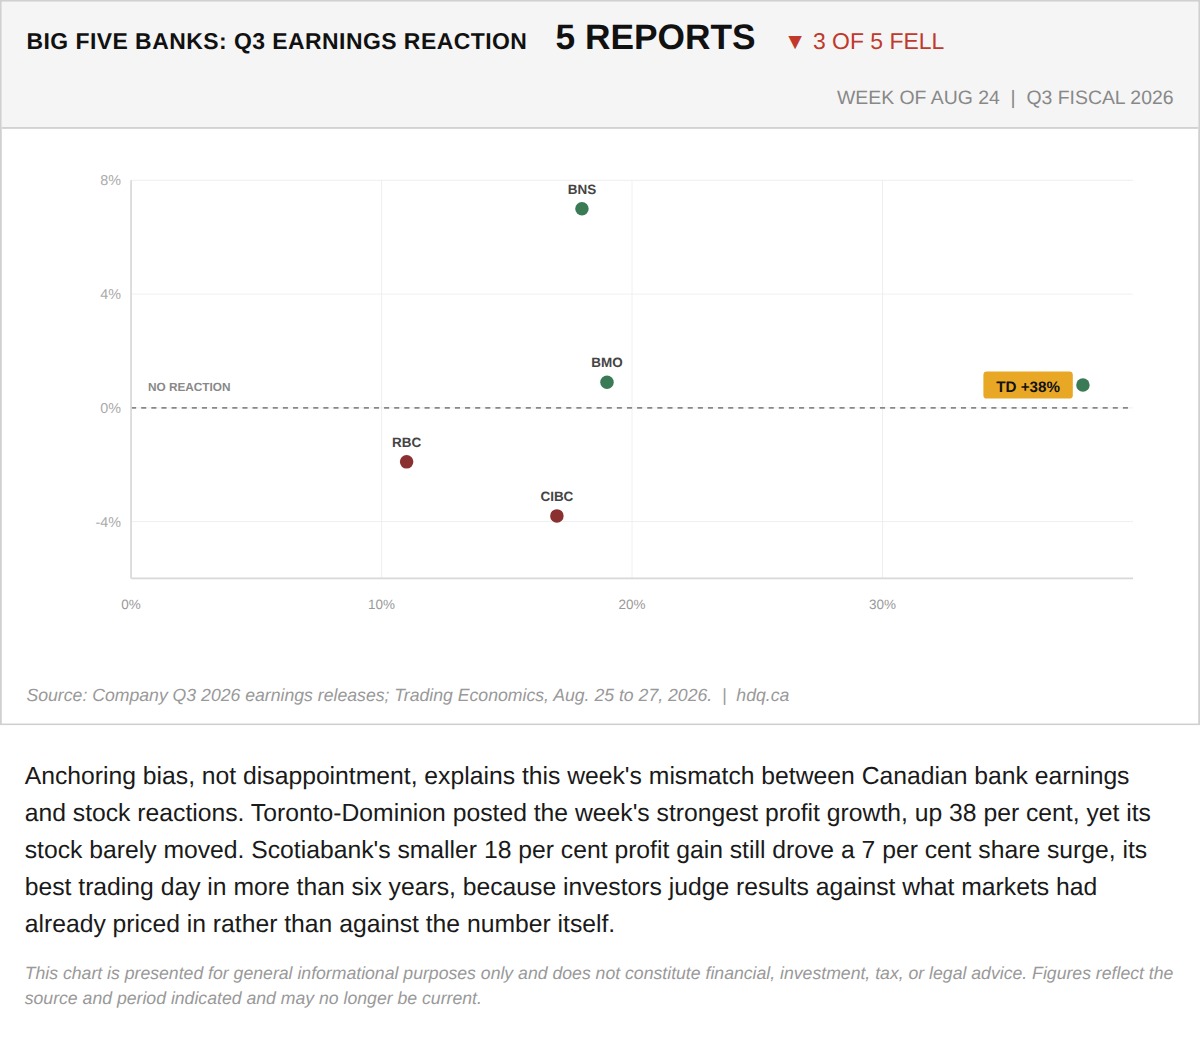
Anchoring bias, not disappointment, explains this week's mismatch between Canadian bank earnings and stock reactions.
Why TD's 38% Profit Jump Moved the Stock Less Than Scotiabank's 18%
August 28, 2026
View chart & download