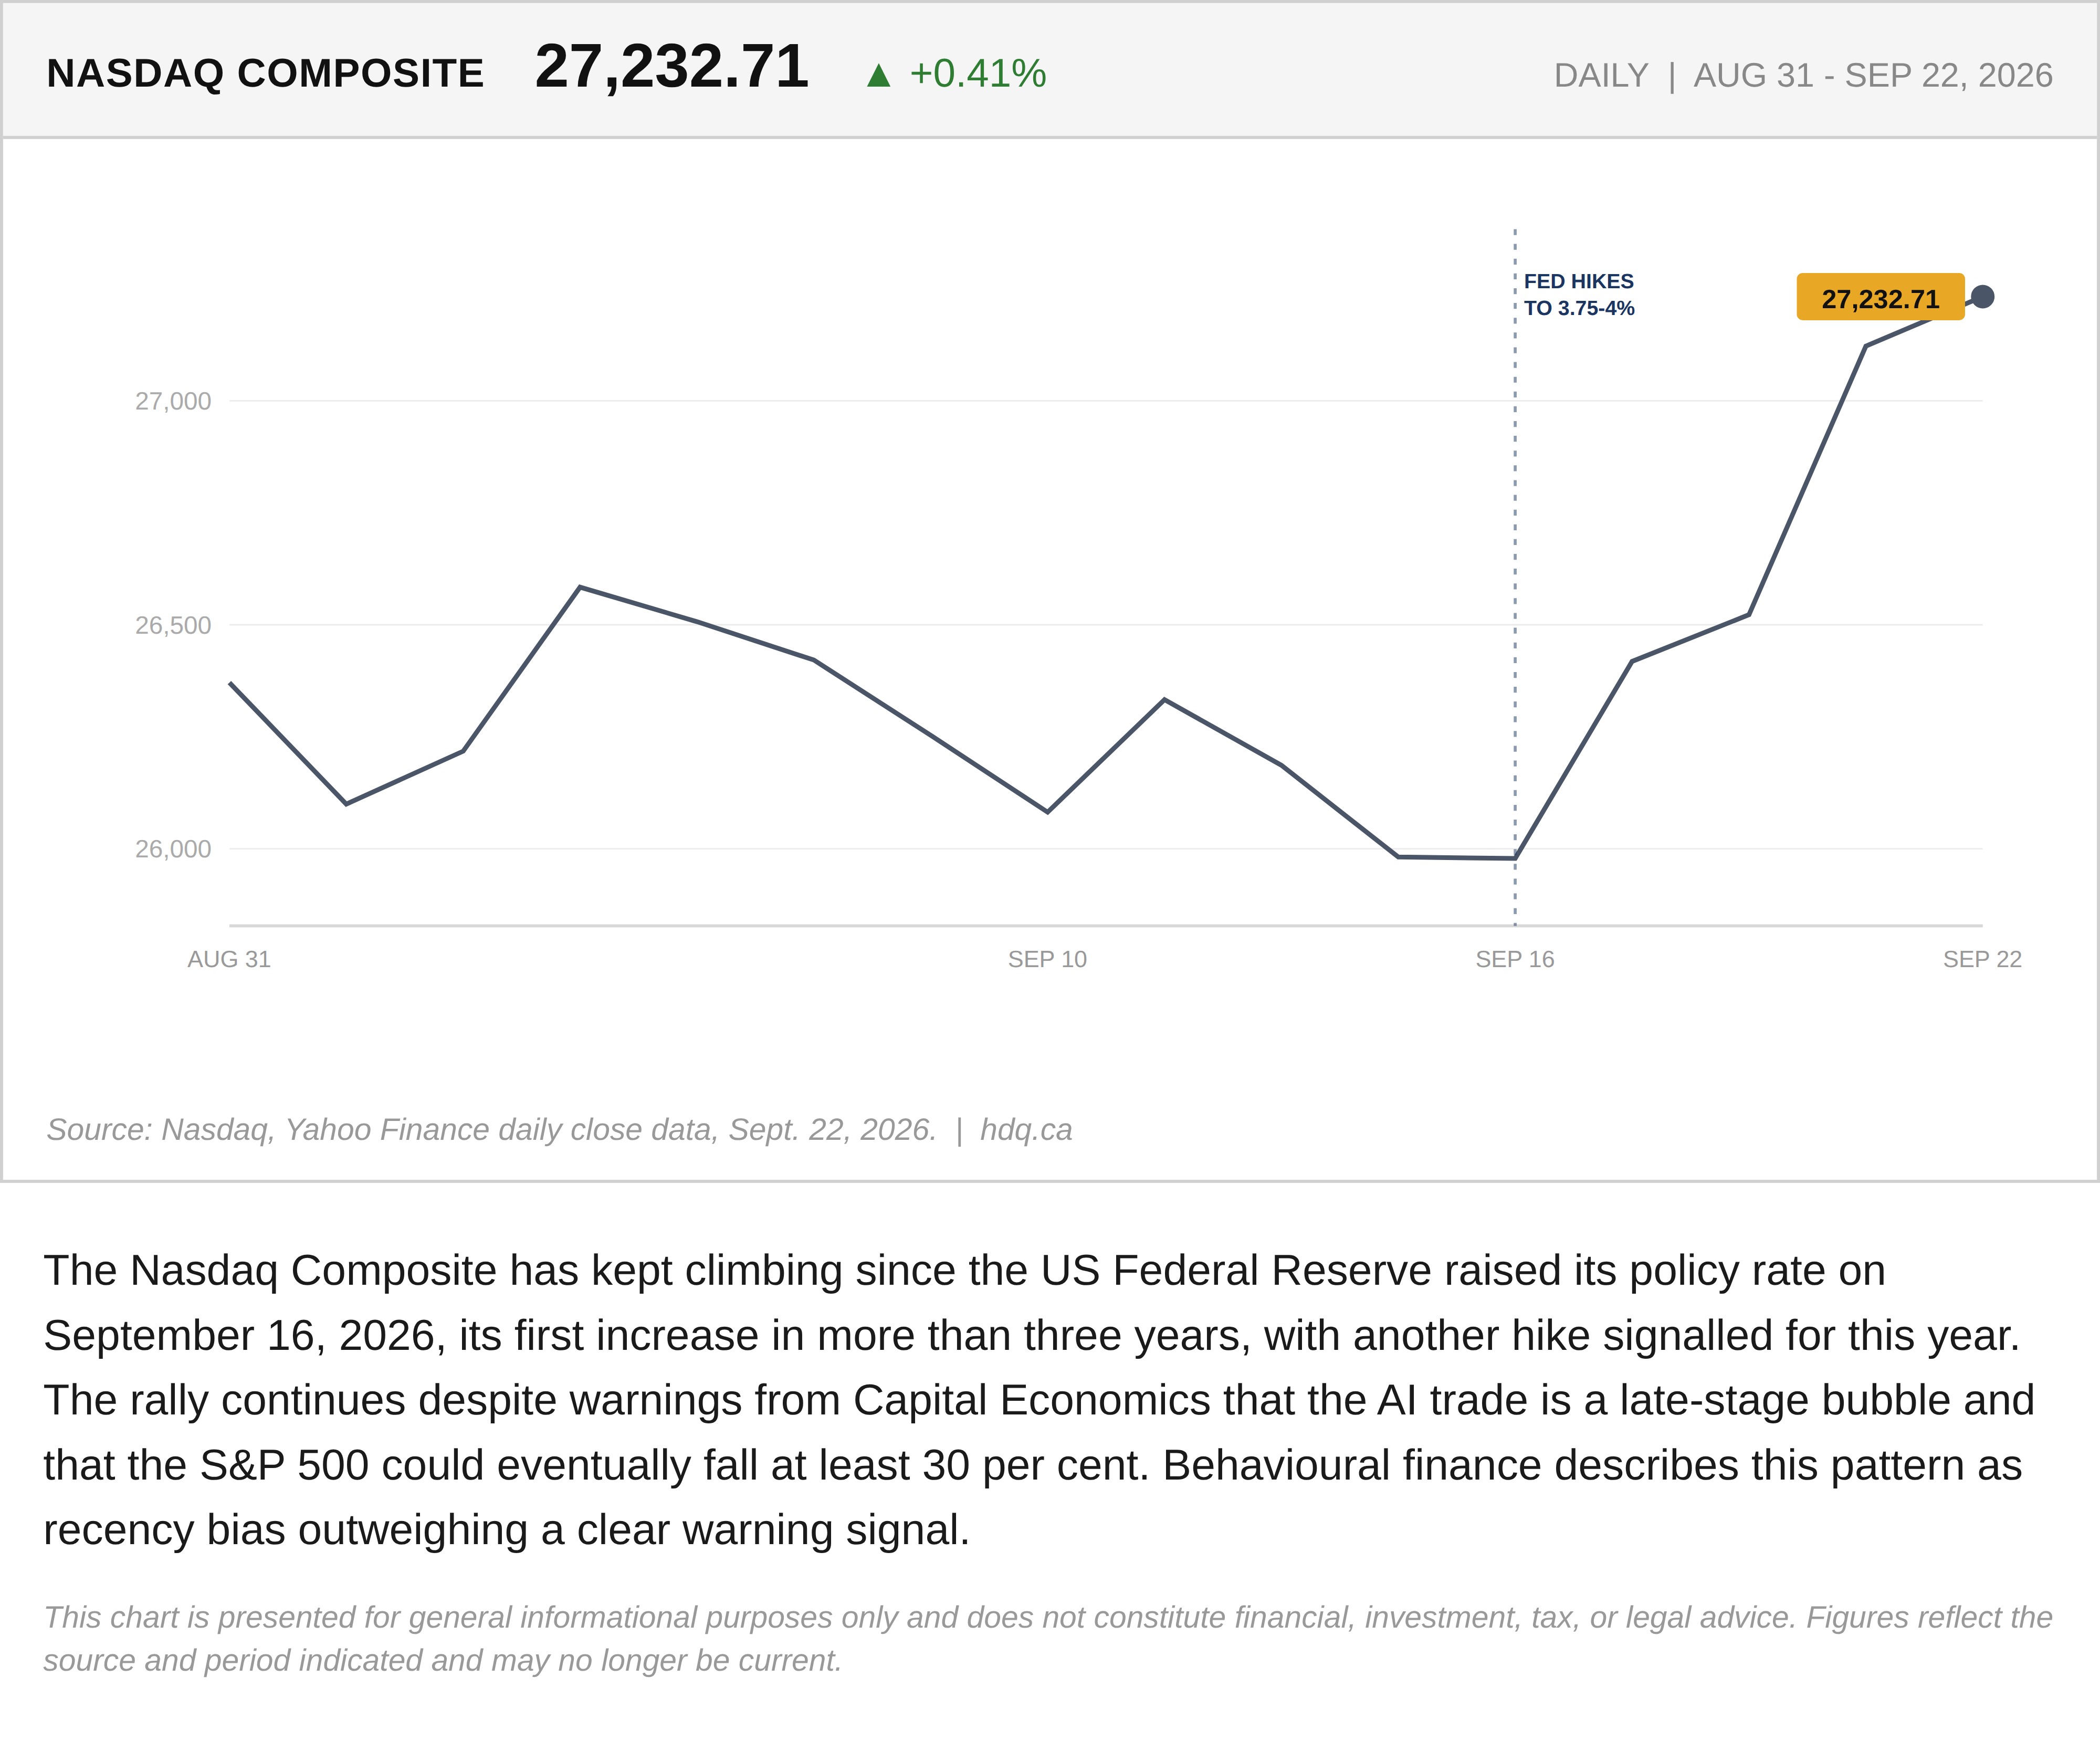
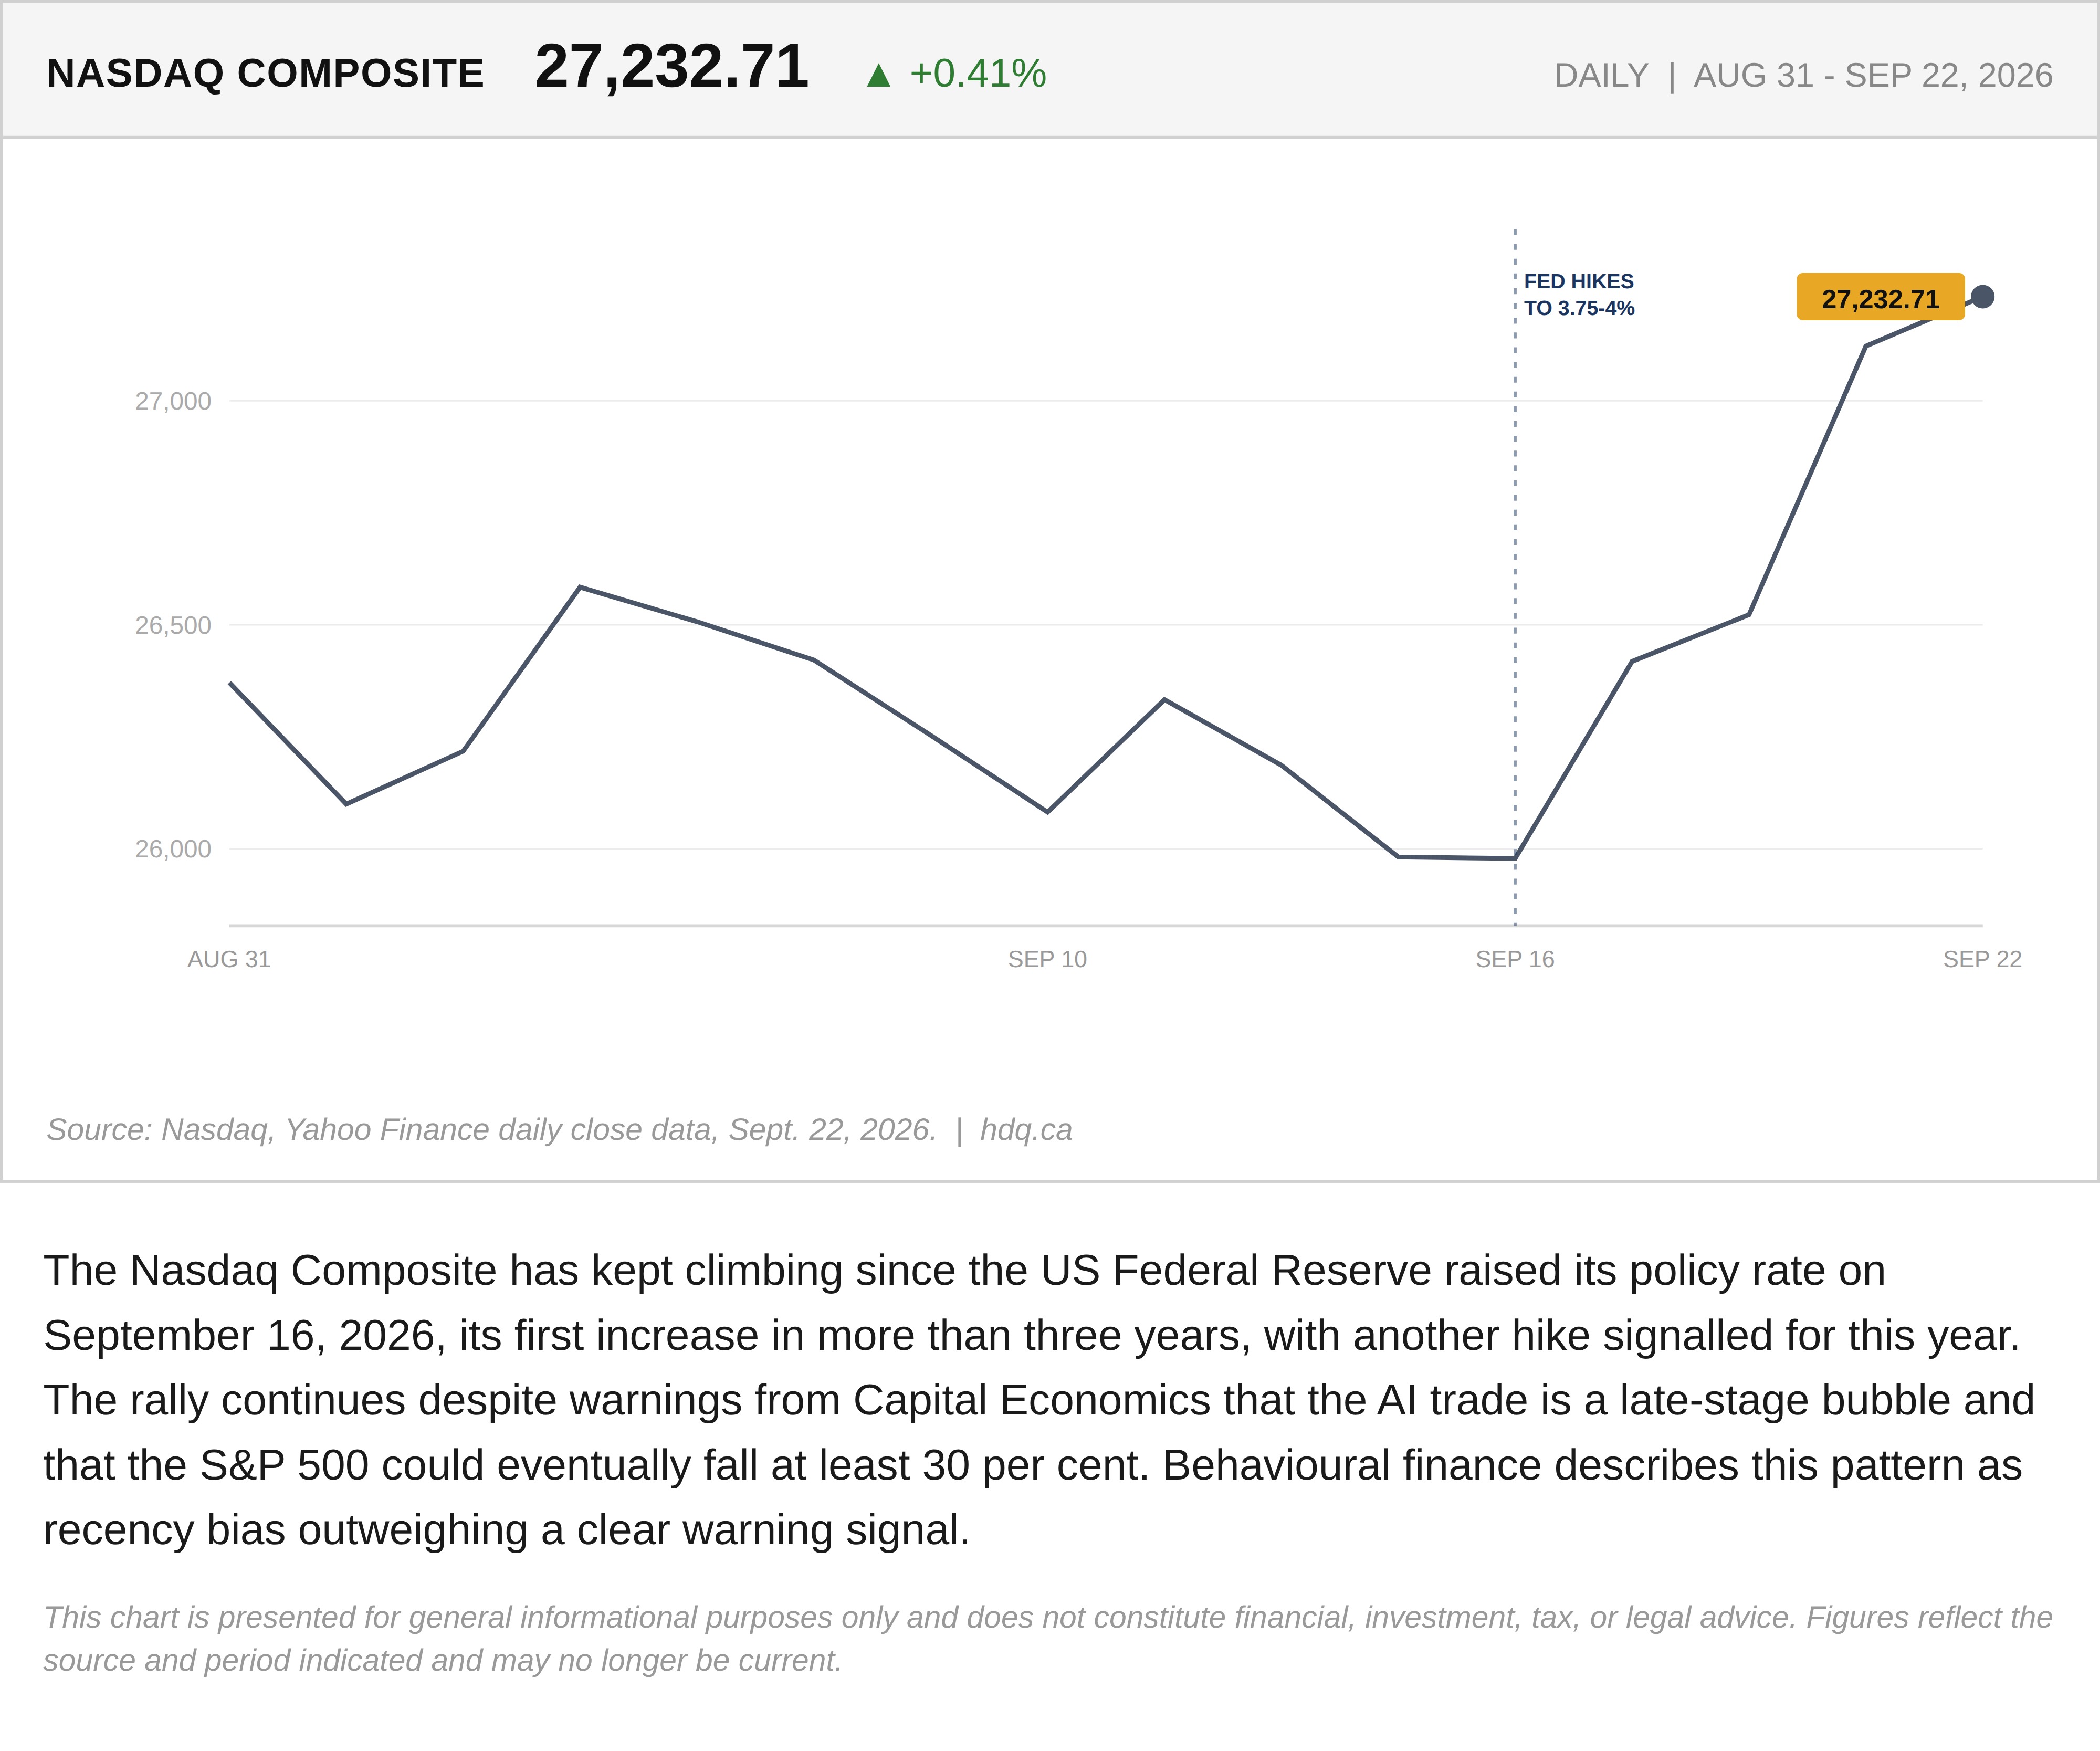
The Nasdaq Composite has kept climbing since the US Federal Reserve raised its policy rate on September 16, 2026, its first increase in more than three years, with another hike signalled for this year. The rally continues despite warnings from Capital Economics that the AI trade is a late-stage bubble and that the S&P 500 could eventually fall at least 30 per cent. Behavioural finance describes this pattern as recency bias outweighing a clear warning signal.
This chart is presented for general informational purposes only and does not constitute financial, investment, tax, or legal advice. Figures reflect the source and period indicated and may no longer be current.
Related charts
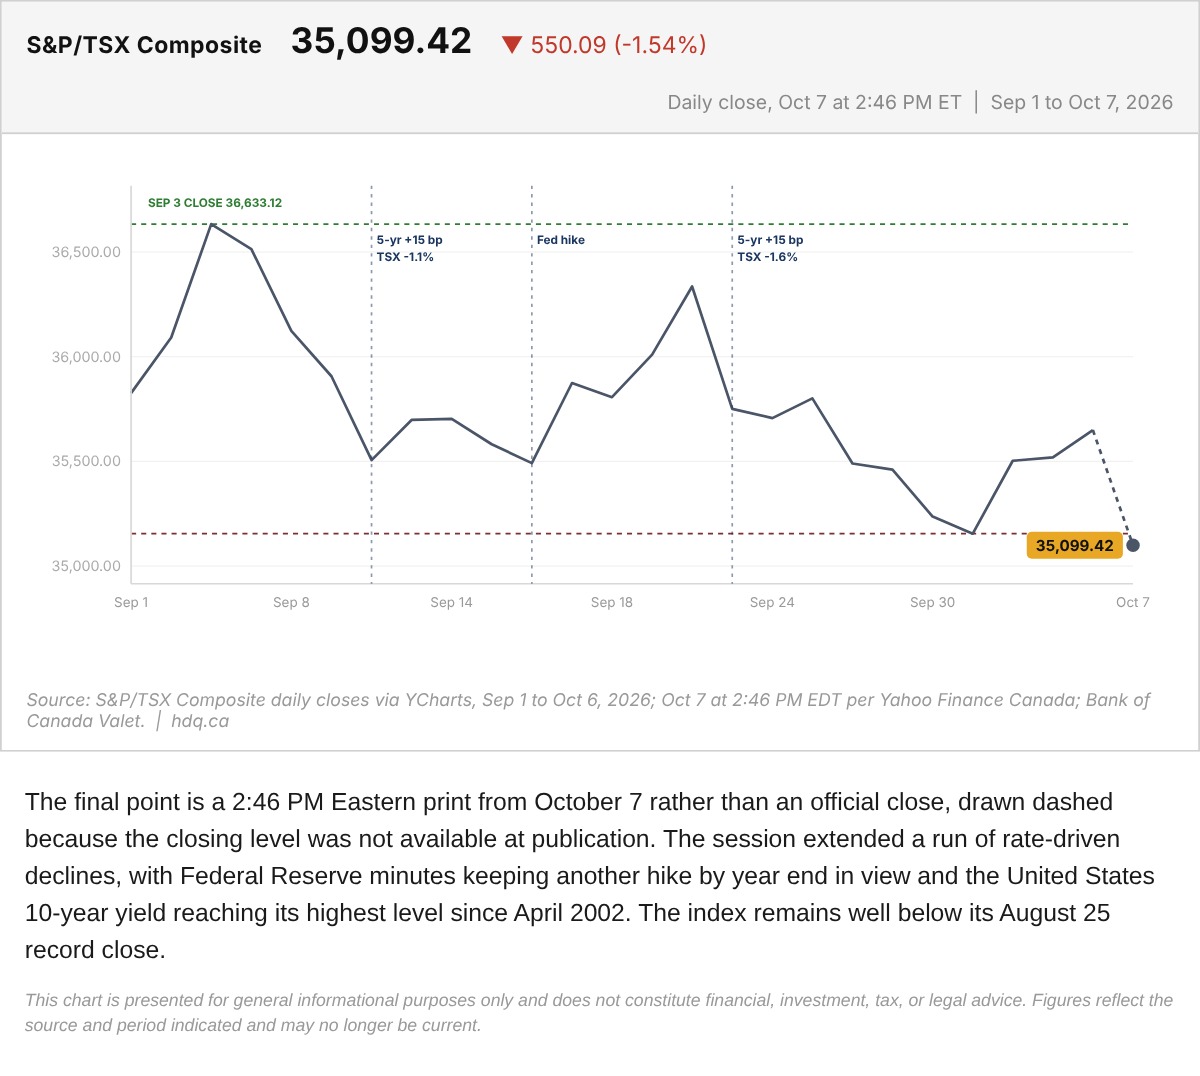
The final point is a 2:46 PM Eastern print from October 7 rather than an official close, drawn dashed because the closing level was not available at publication.
S&P/TSX Composite With the October 7 Midday Print
October 7, 2026
View chart & download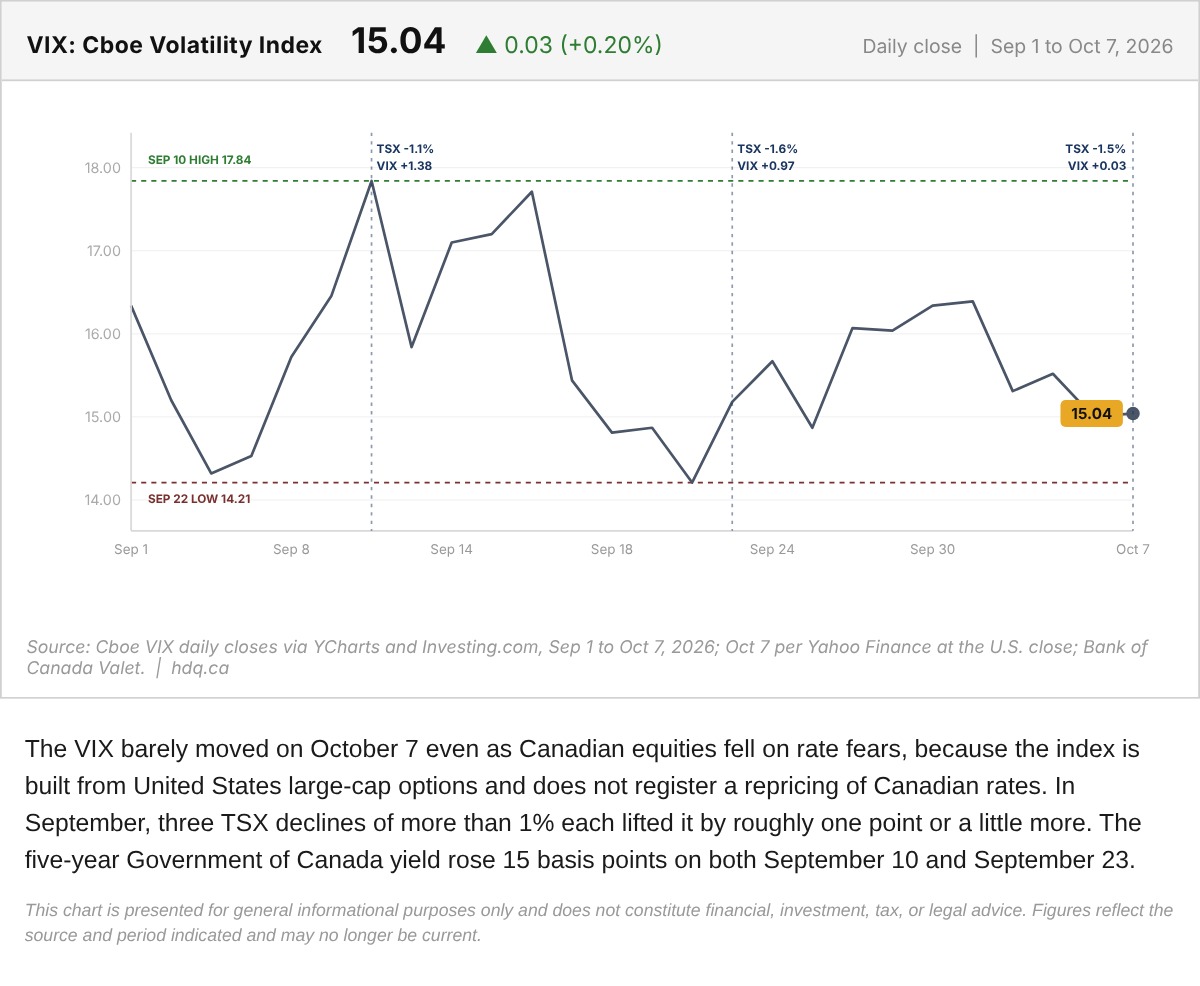
The VIX barely moved on October 7 even as Canadian equities fell on rate fears, because the index is built from United States large-cap…
VIX Daily Close on the Day Rate Fear Hit the TSX
October 7, 2026
View chart & download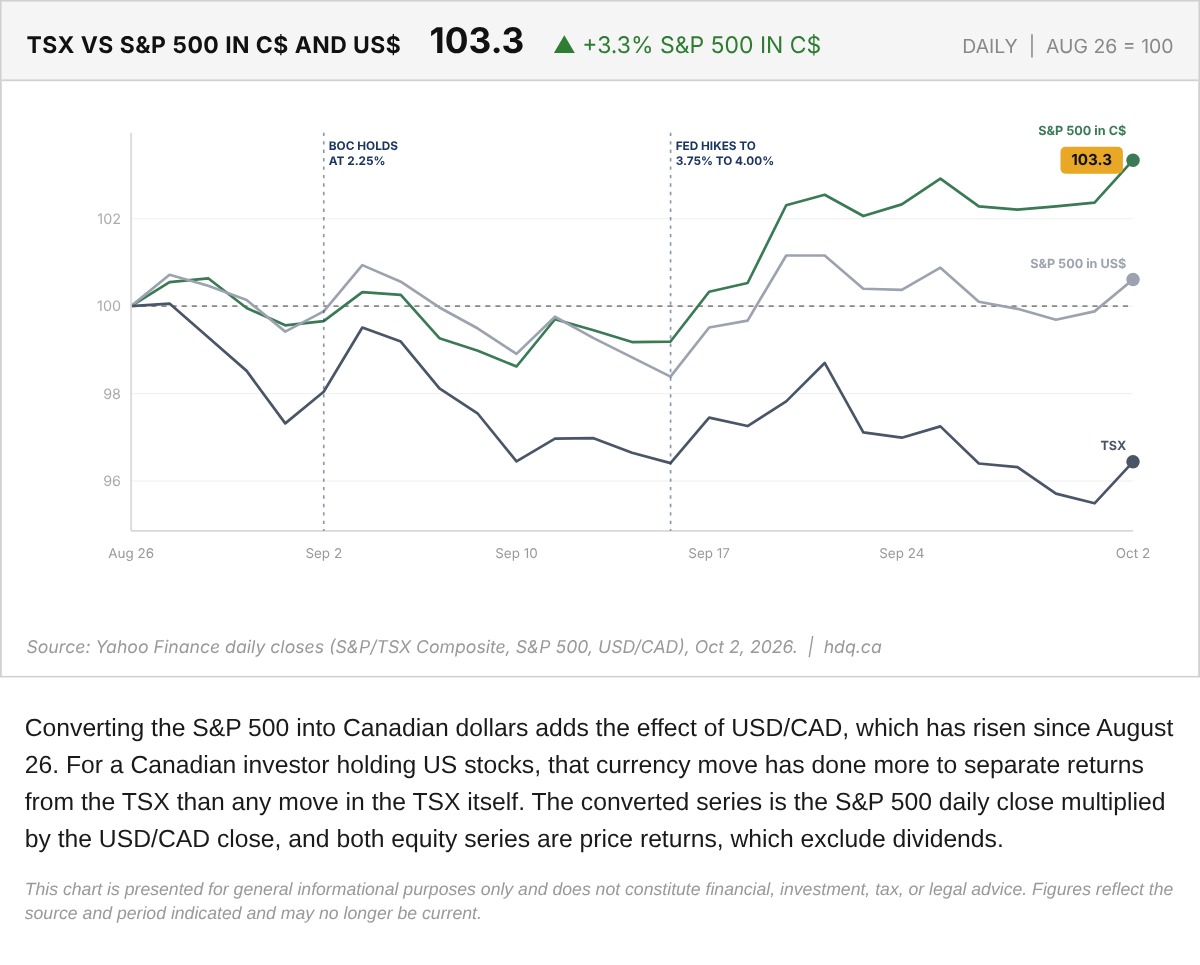
Converting the S&P 500 into Canadian dollars adds the effect of USD/CAD, which has risen since August 26.
TSX Versus S&P 500 in Canadian and US Dollars, Indexed to August 26, 2026
October 2, 2026
View chart & download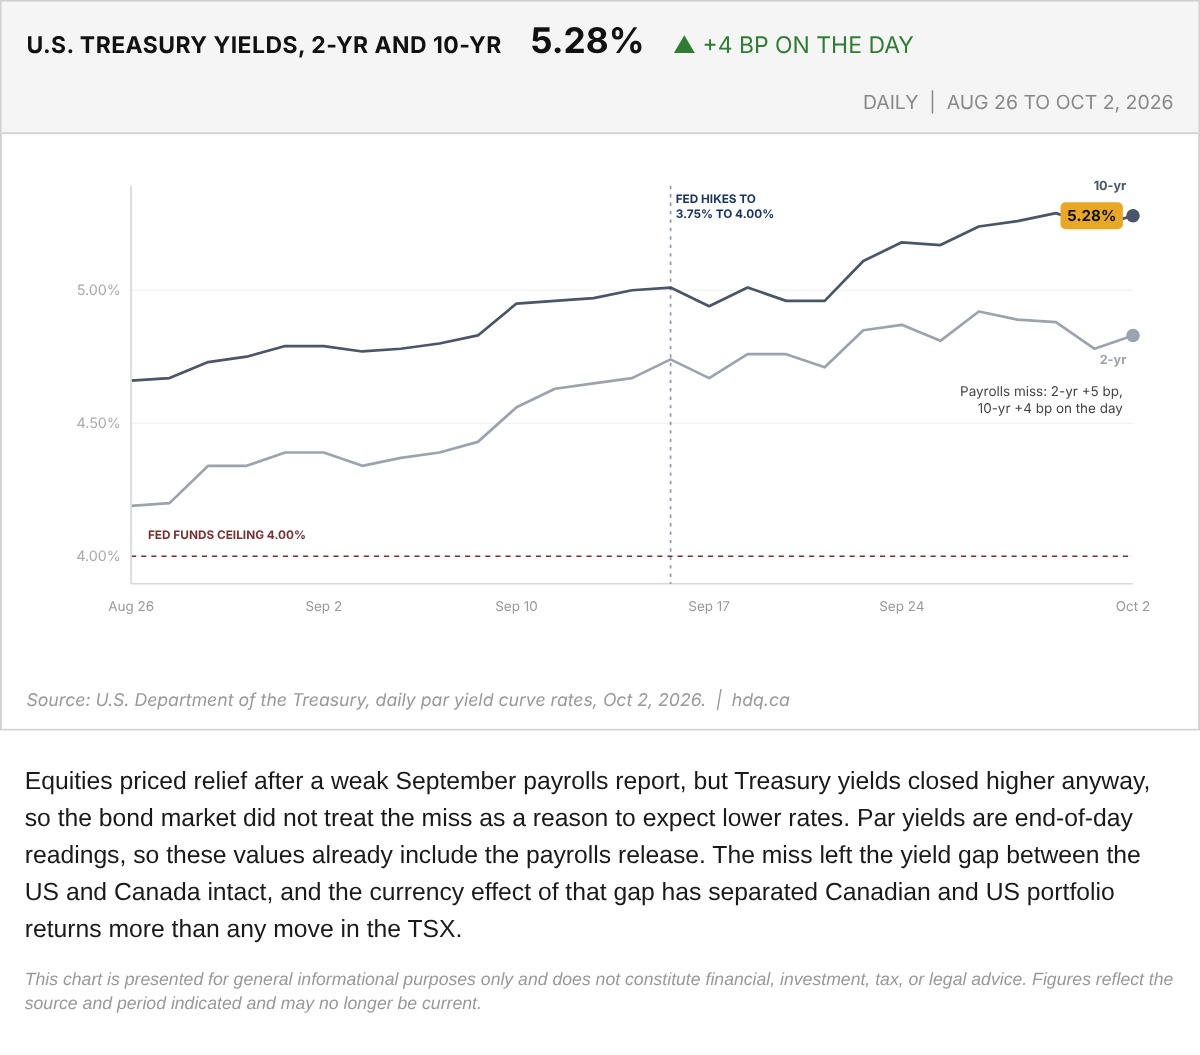
Equities priced relief after a weak September payrolls report, but Treasury yields closed higher anyway, so the bond market did not treat the miss as a reason to expect lower rates.
US Treasury Par Yields: 2-Year and 10-Year, August 26 to October 2, 2026
October 2, 2026
View chart & download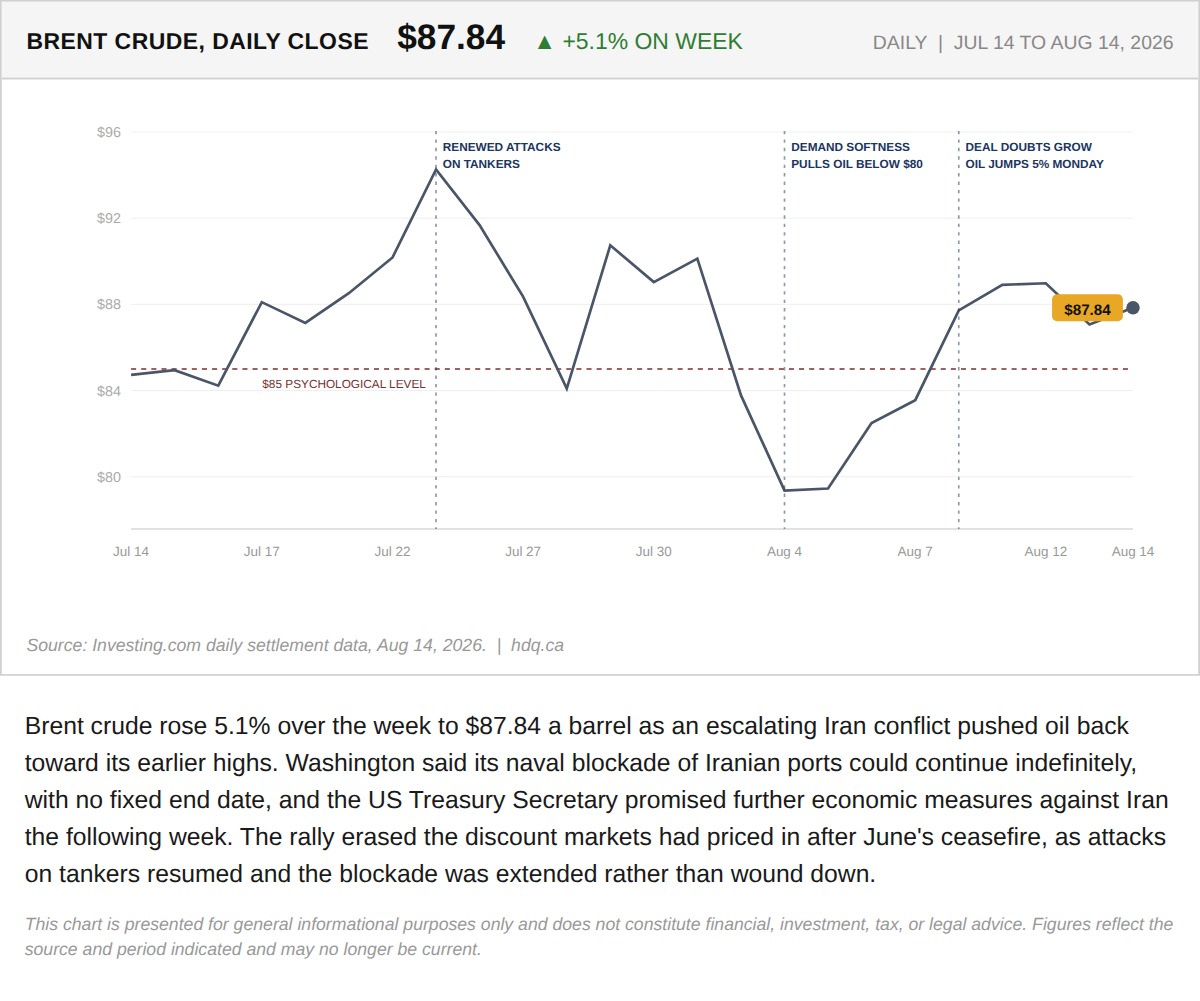
Brent crude rose 5.1% over the week to $87.84 a barrel as an escalating Iran conflict pushed oil back toward its earlier highs.
The TSX and Gold Both Set Records This Week. That Should Not Happen Together.
August 15, 2026
View chart & download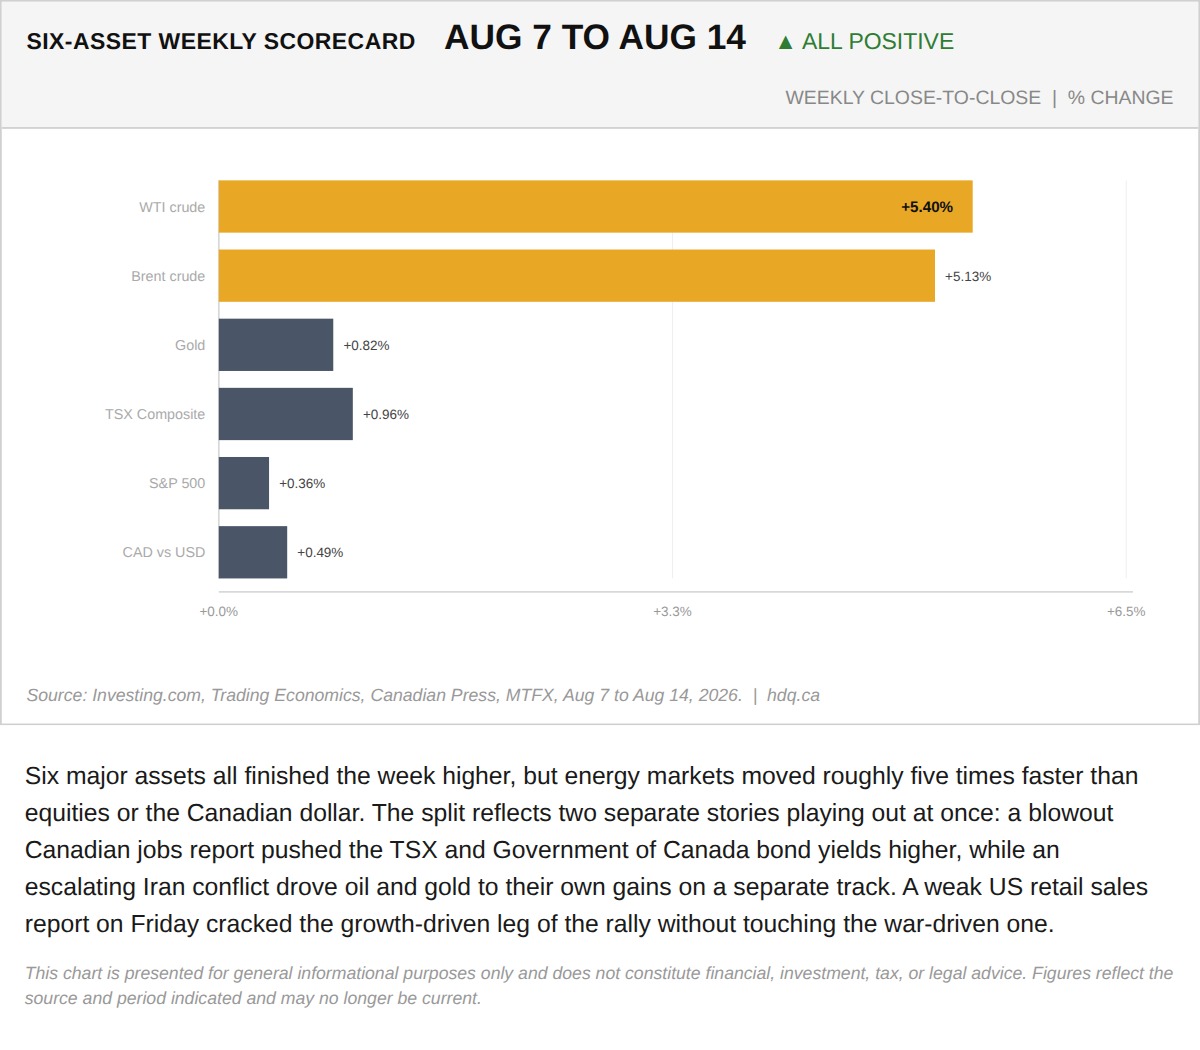
Six major assets all finished the week higher, but energy markets moved roughly five times faster than equities or the Canadian dollar.
The TSX and Gold Both Set Records This Week. That Should Not Happen Together.
August 15, 2026
View chart & download