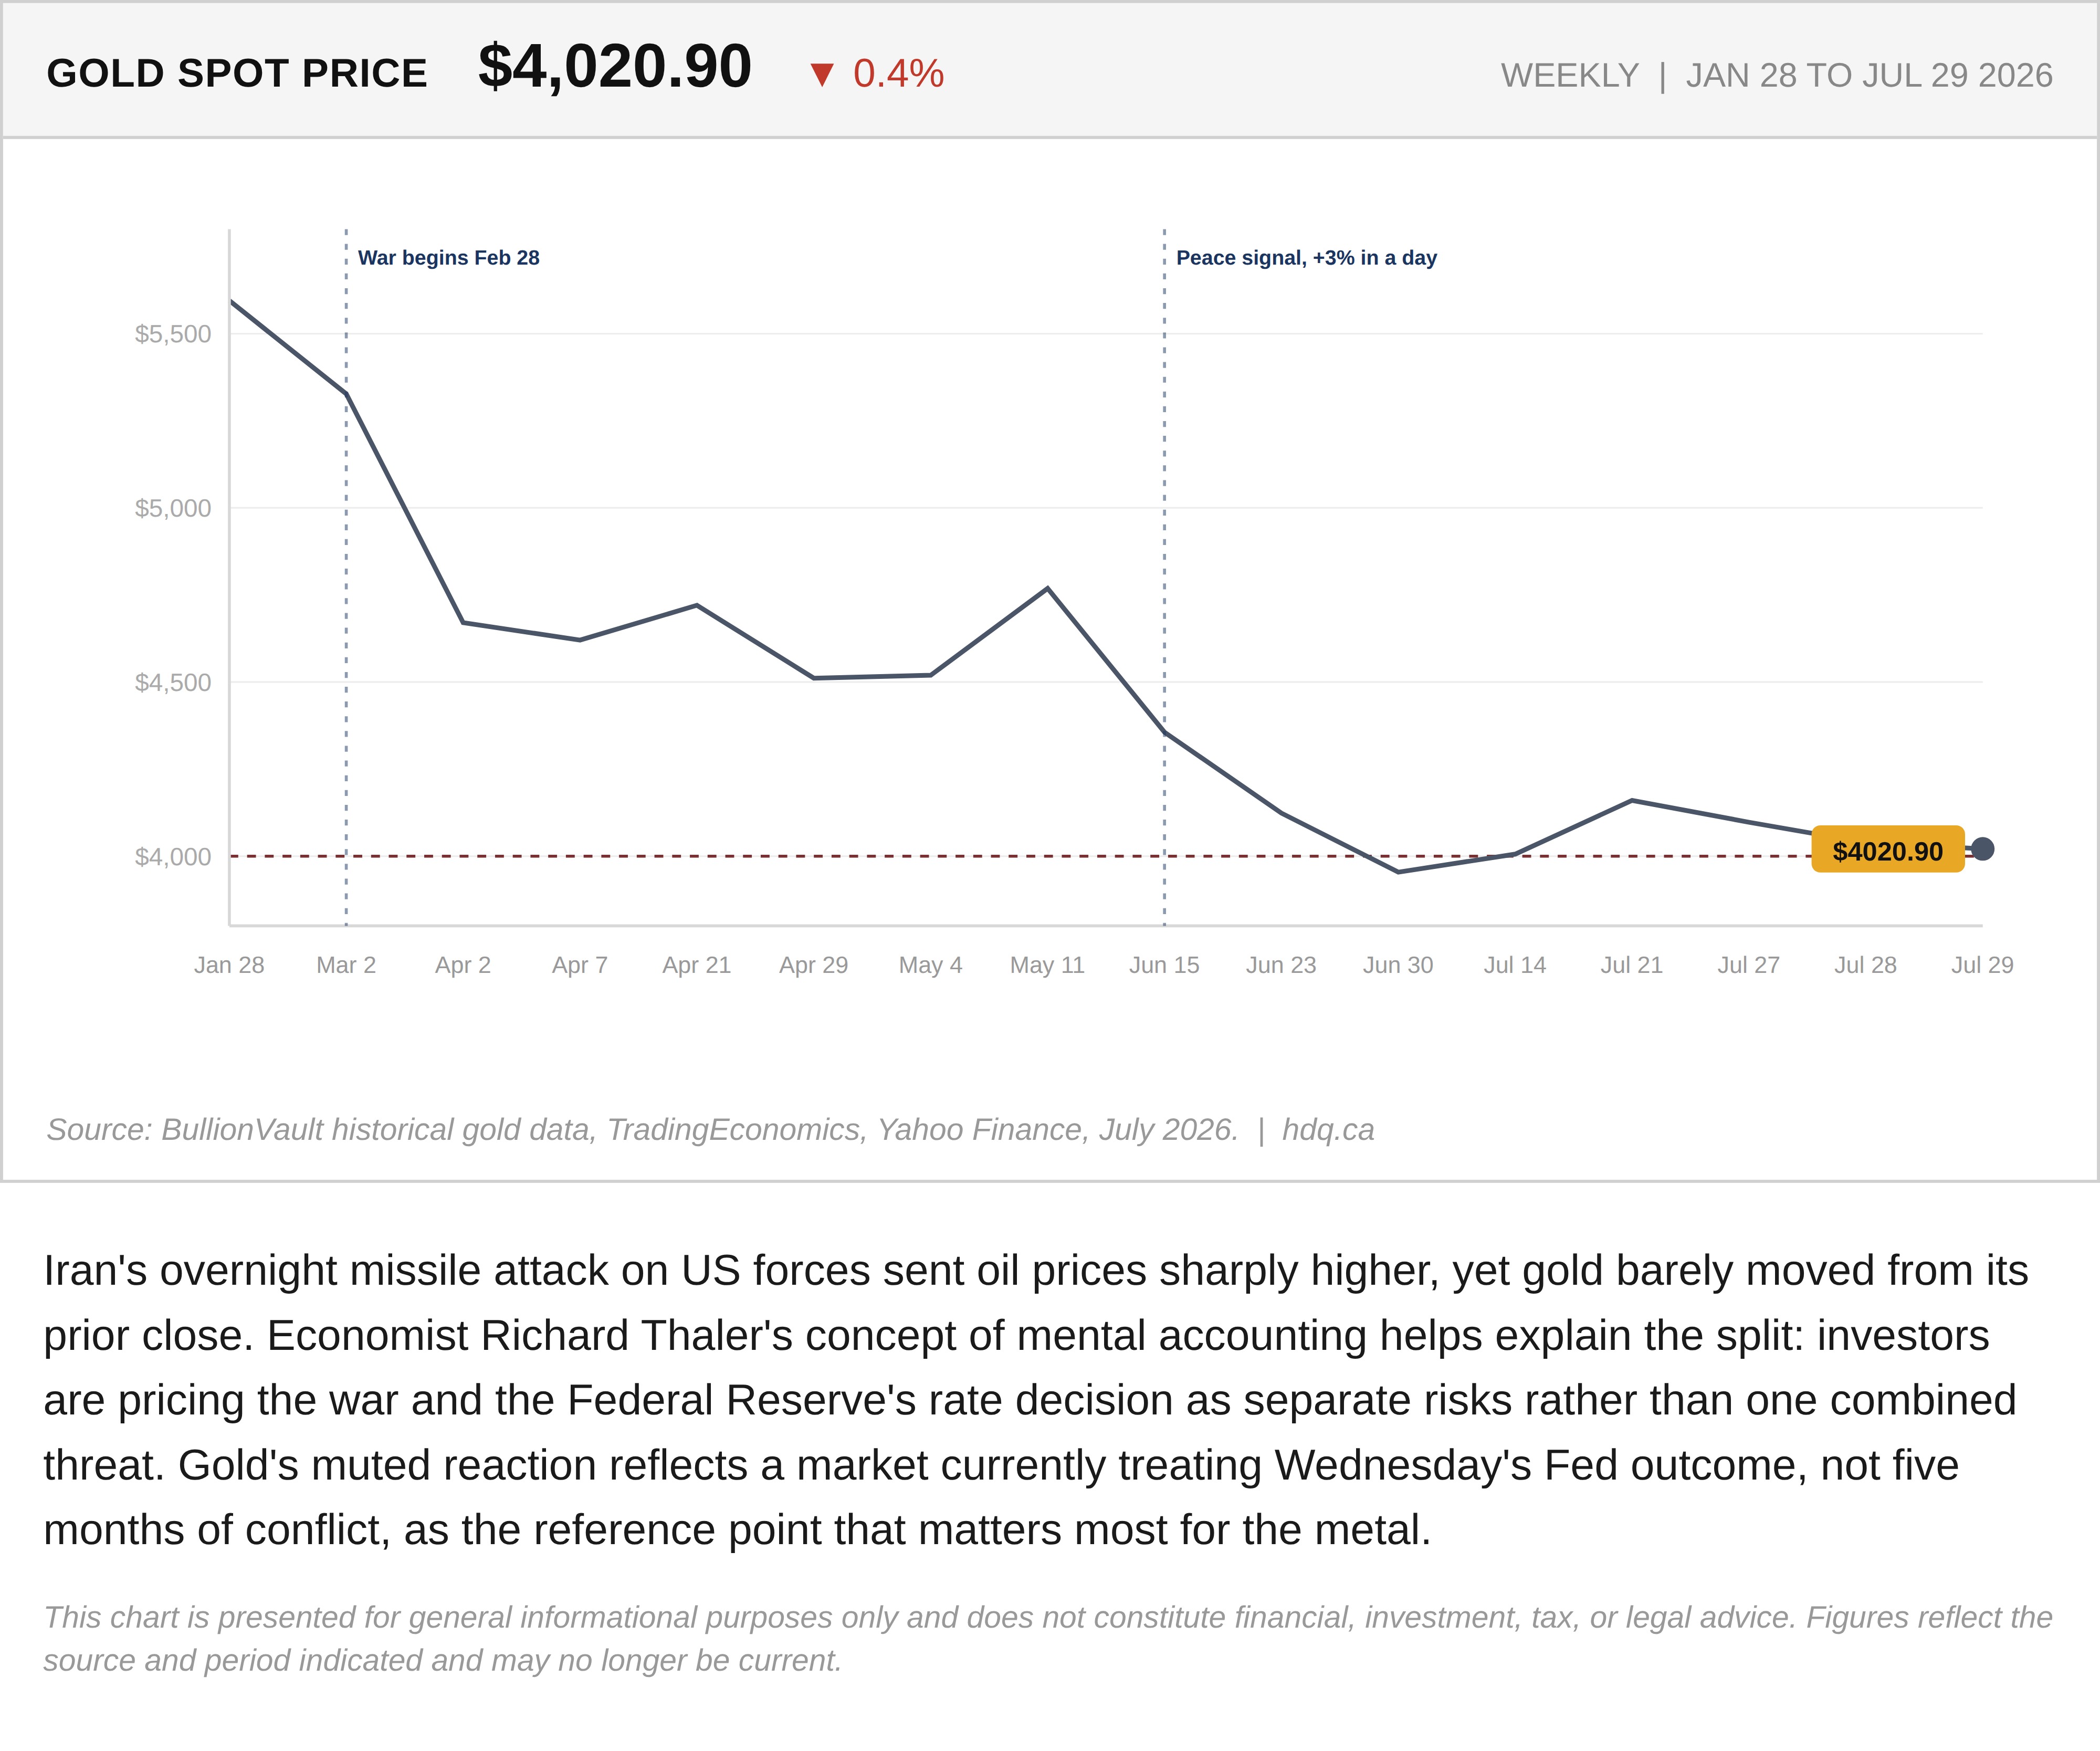
Iran's overnight missile attack on US forces sent oil prices sharply higher, yet gold barely moved from its prior close. Economist Richard Thaler's concept of mental accounting helps explain the split: investors are pricing the war and the Federal Reserve's rate decision as separate risks rather than one combined threat. Gold's muted reaction reflects a market currently treating Wednesday's Fed outcome, not five months of conflict, as the reference point that matters most for the metal.
This chart is presented for general informational purposes only and does not constitute financial, investment, tax, or legal advice. Figures reflect the source and period indicated and may no longer be current.
Related charts
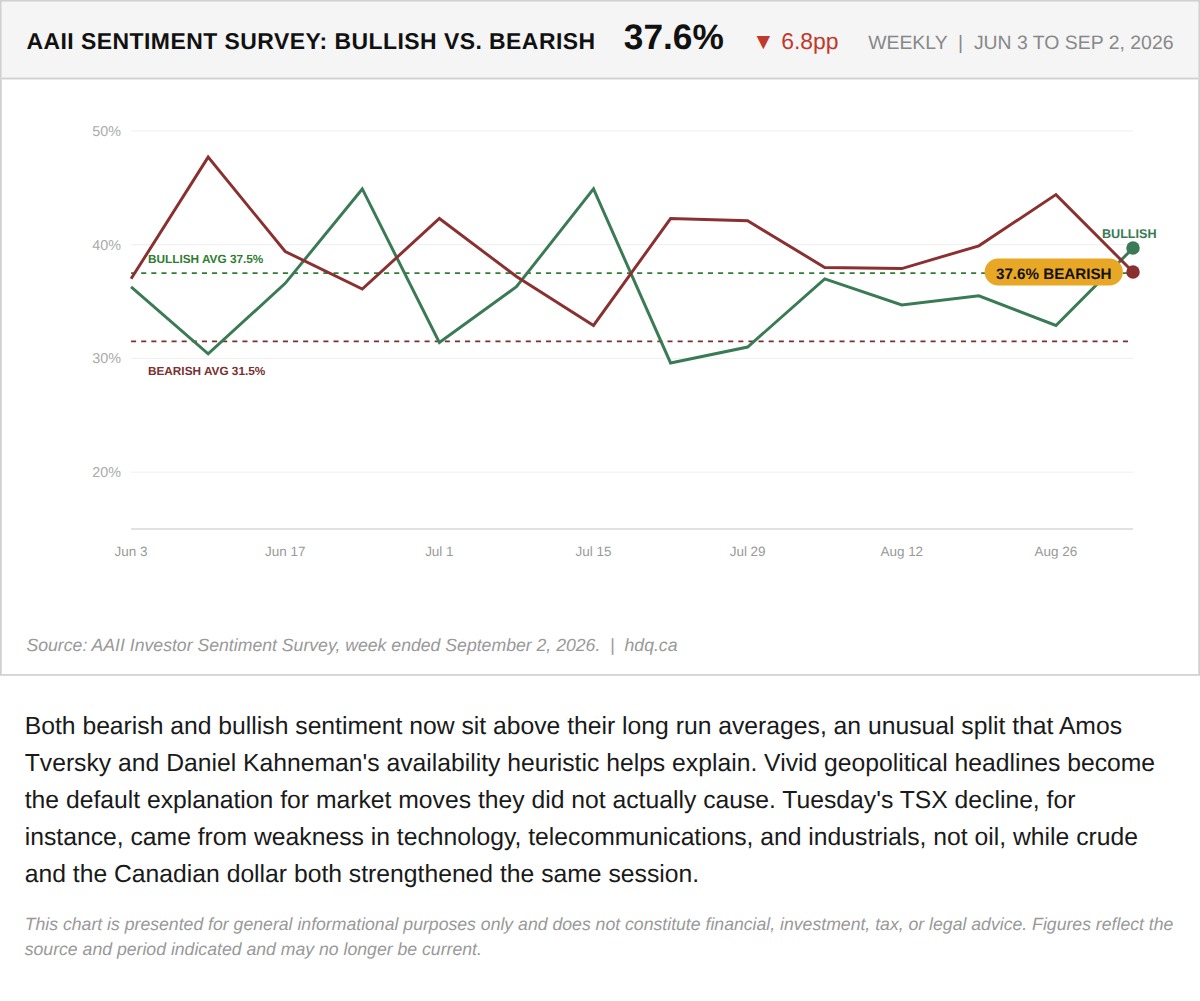
Both bearish and bullish sentiment now sit above their long run averages, an unusual split that Amos Tversky and Daniel Kahneman's availability heuristic helps explain.
Investors Are More Bearish and More Bullish Than Usual, and Tuesday's TSX Move Shows Why
September 9, 2026
View chart & download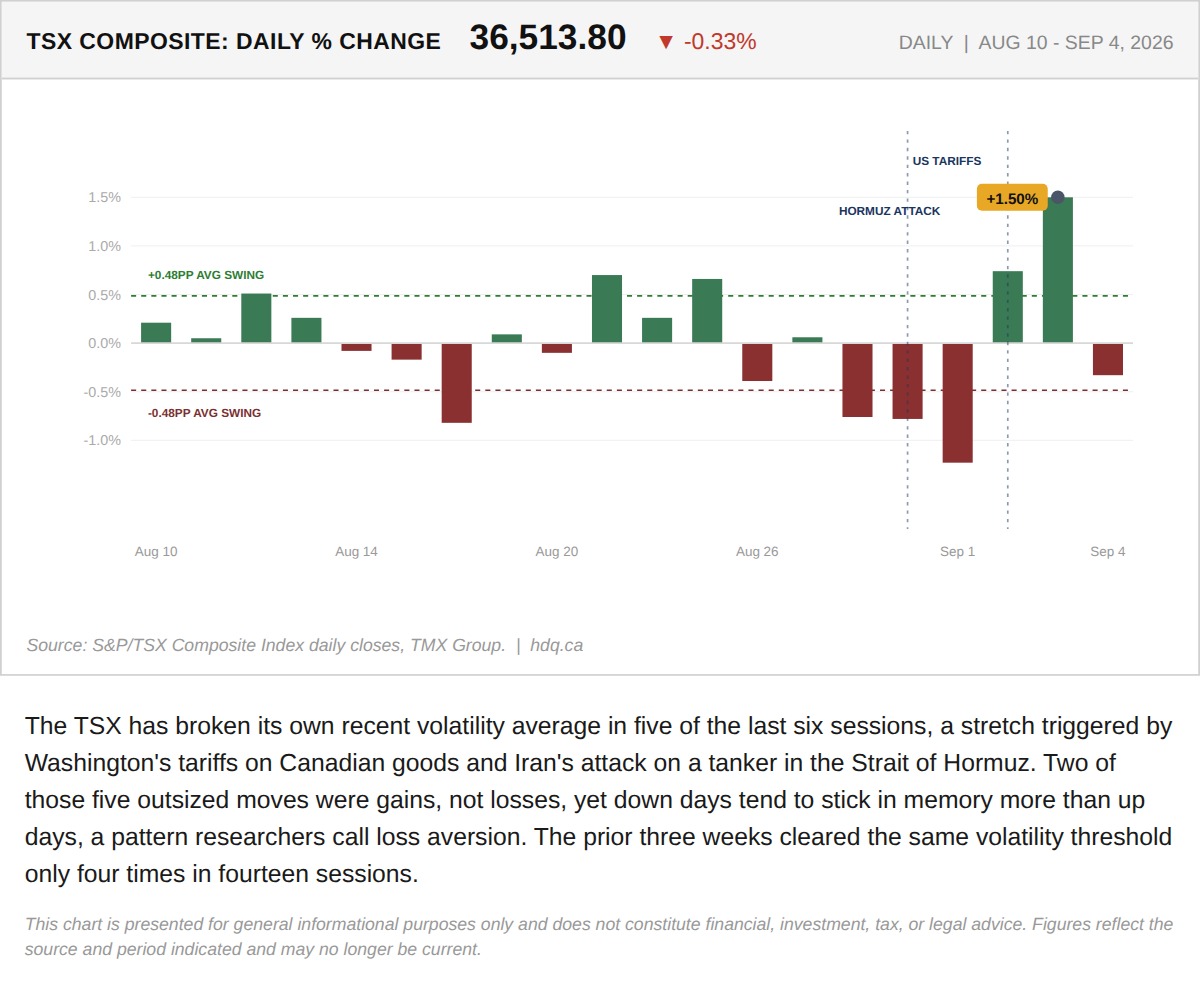
The TSX has broken its own recent volatility average in five of the last six sessions, a stretch triggered by Washington's tariffs on…
Why This Week Feels Worse Than the TSX Actually Performed
September 8, 2026
View chart & download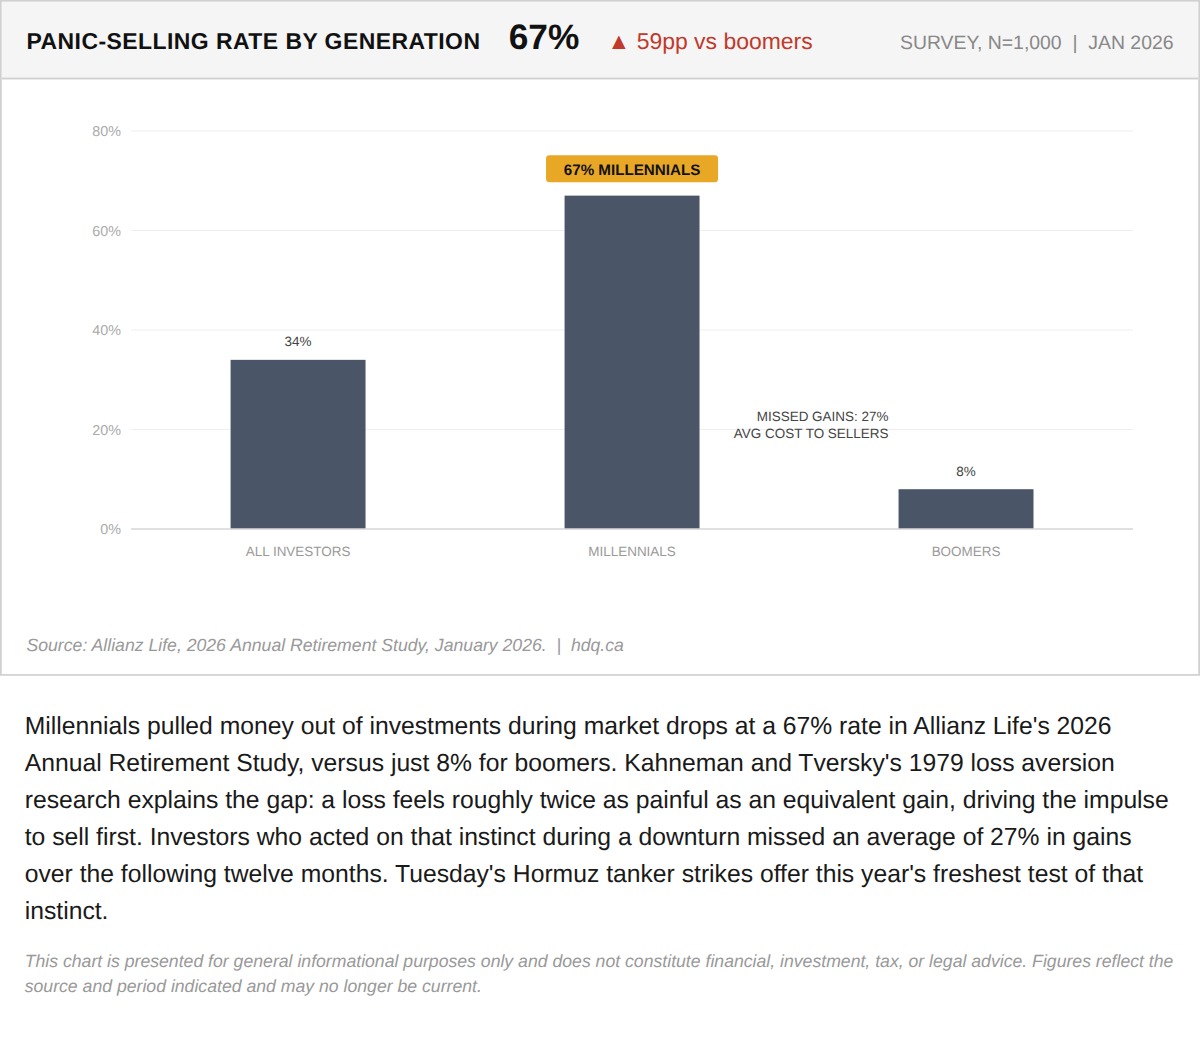
Millennials pulled money out of investments during market drops at a 67% rate in Allianz Life's 2026 Annual Retirement Study, versus just 8% for boomers.
Why Millennials Panic-Sell Eight Times More Than Boomers
September 1, 2026
View chart & download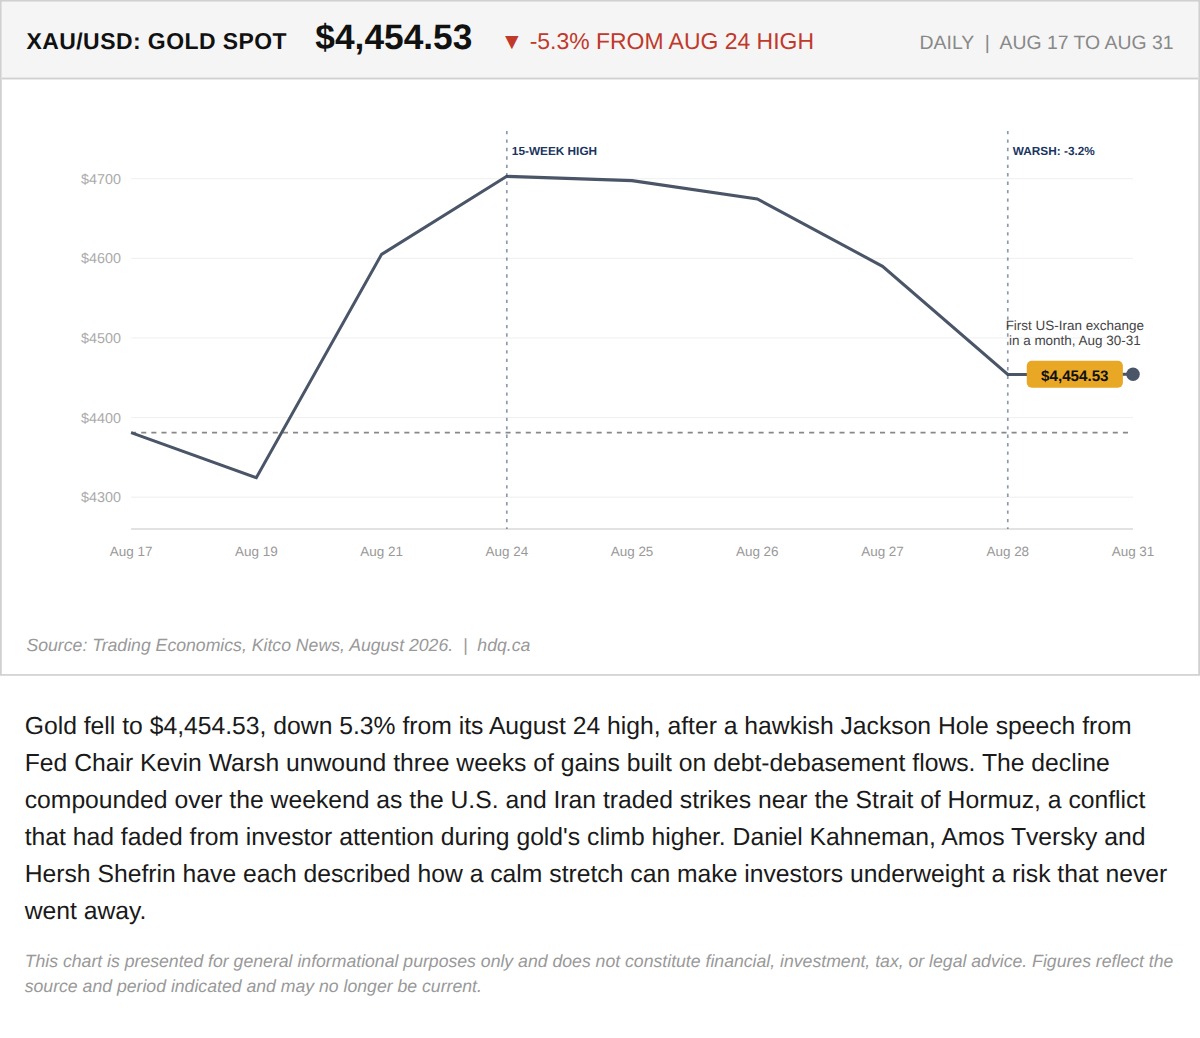
Gold fell to $4,454.53, down 5.3% from its August 24 high, after a hawkish Jackson Hole speech from Fed Chair Kevin Warsh unwound three weeks of gains built on debt-debasement flows.
Gold's Quiet Climb to a 15-Week High Hid the Risk That Just Came Back
August 31, 2026
View chart & download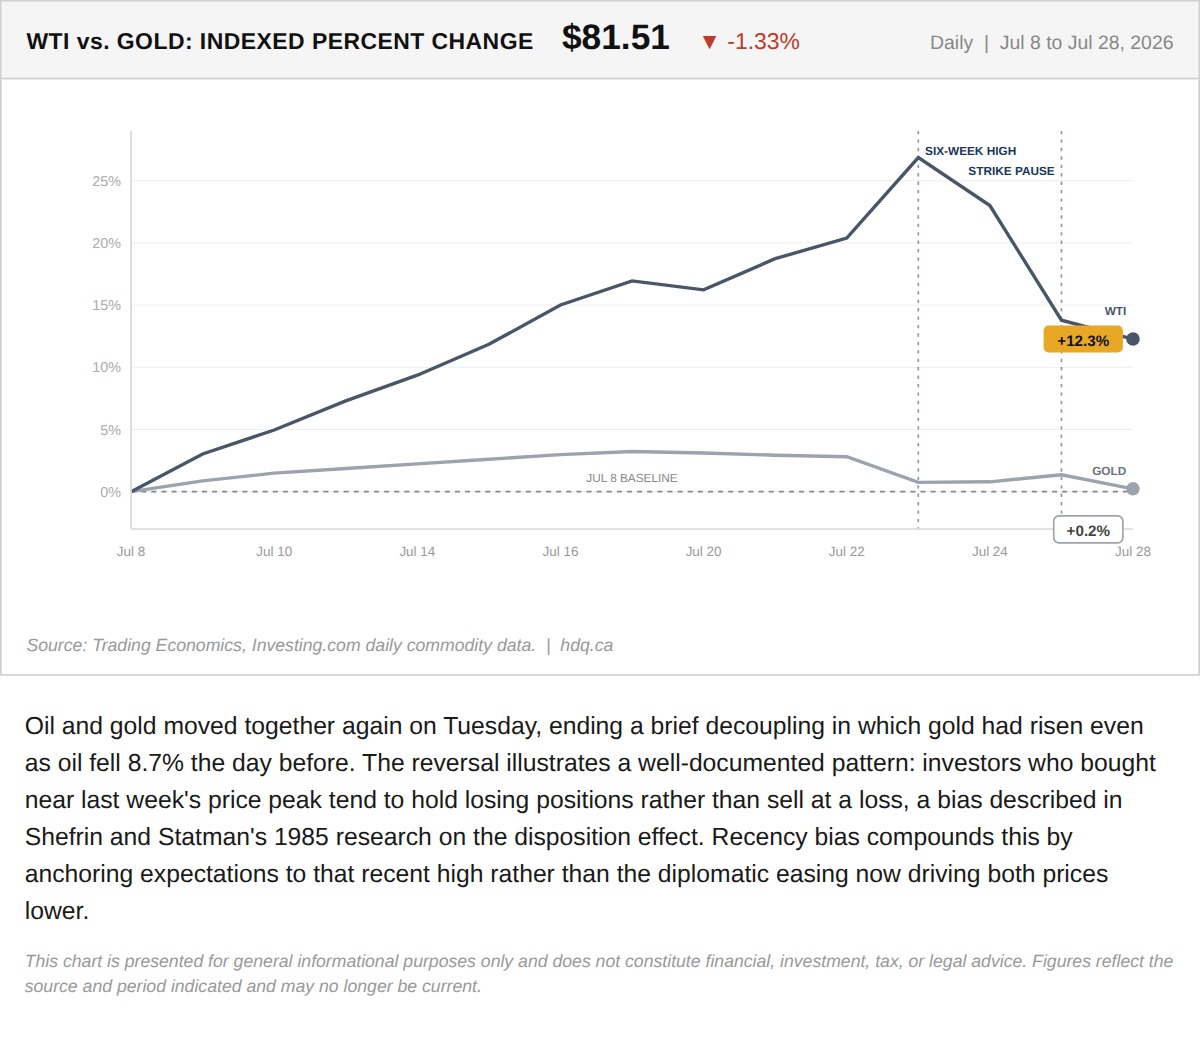
Oil and gold moved together again on Tuesday, ending a brief decoupling in which gold had risen even as oil fell 8.7% the day before.
July 28, 2026
View chart & download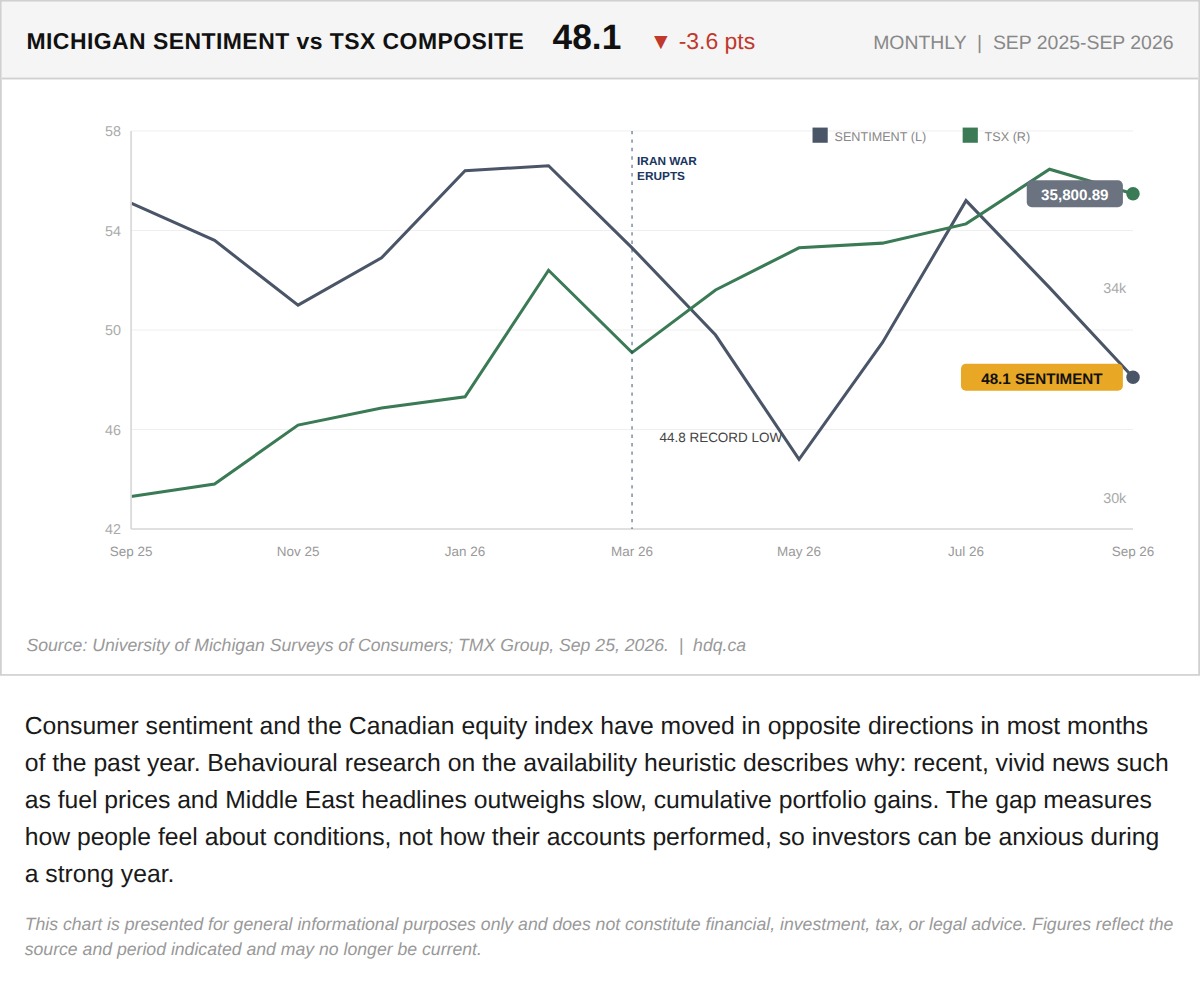
Consumer sentiment and the Canadian equity index have moved in opposite directions in most months of the past year.
Consumer Sentiment Falls While the TSX Rises
September 28, 2026
View chart & download