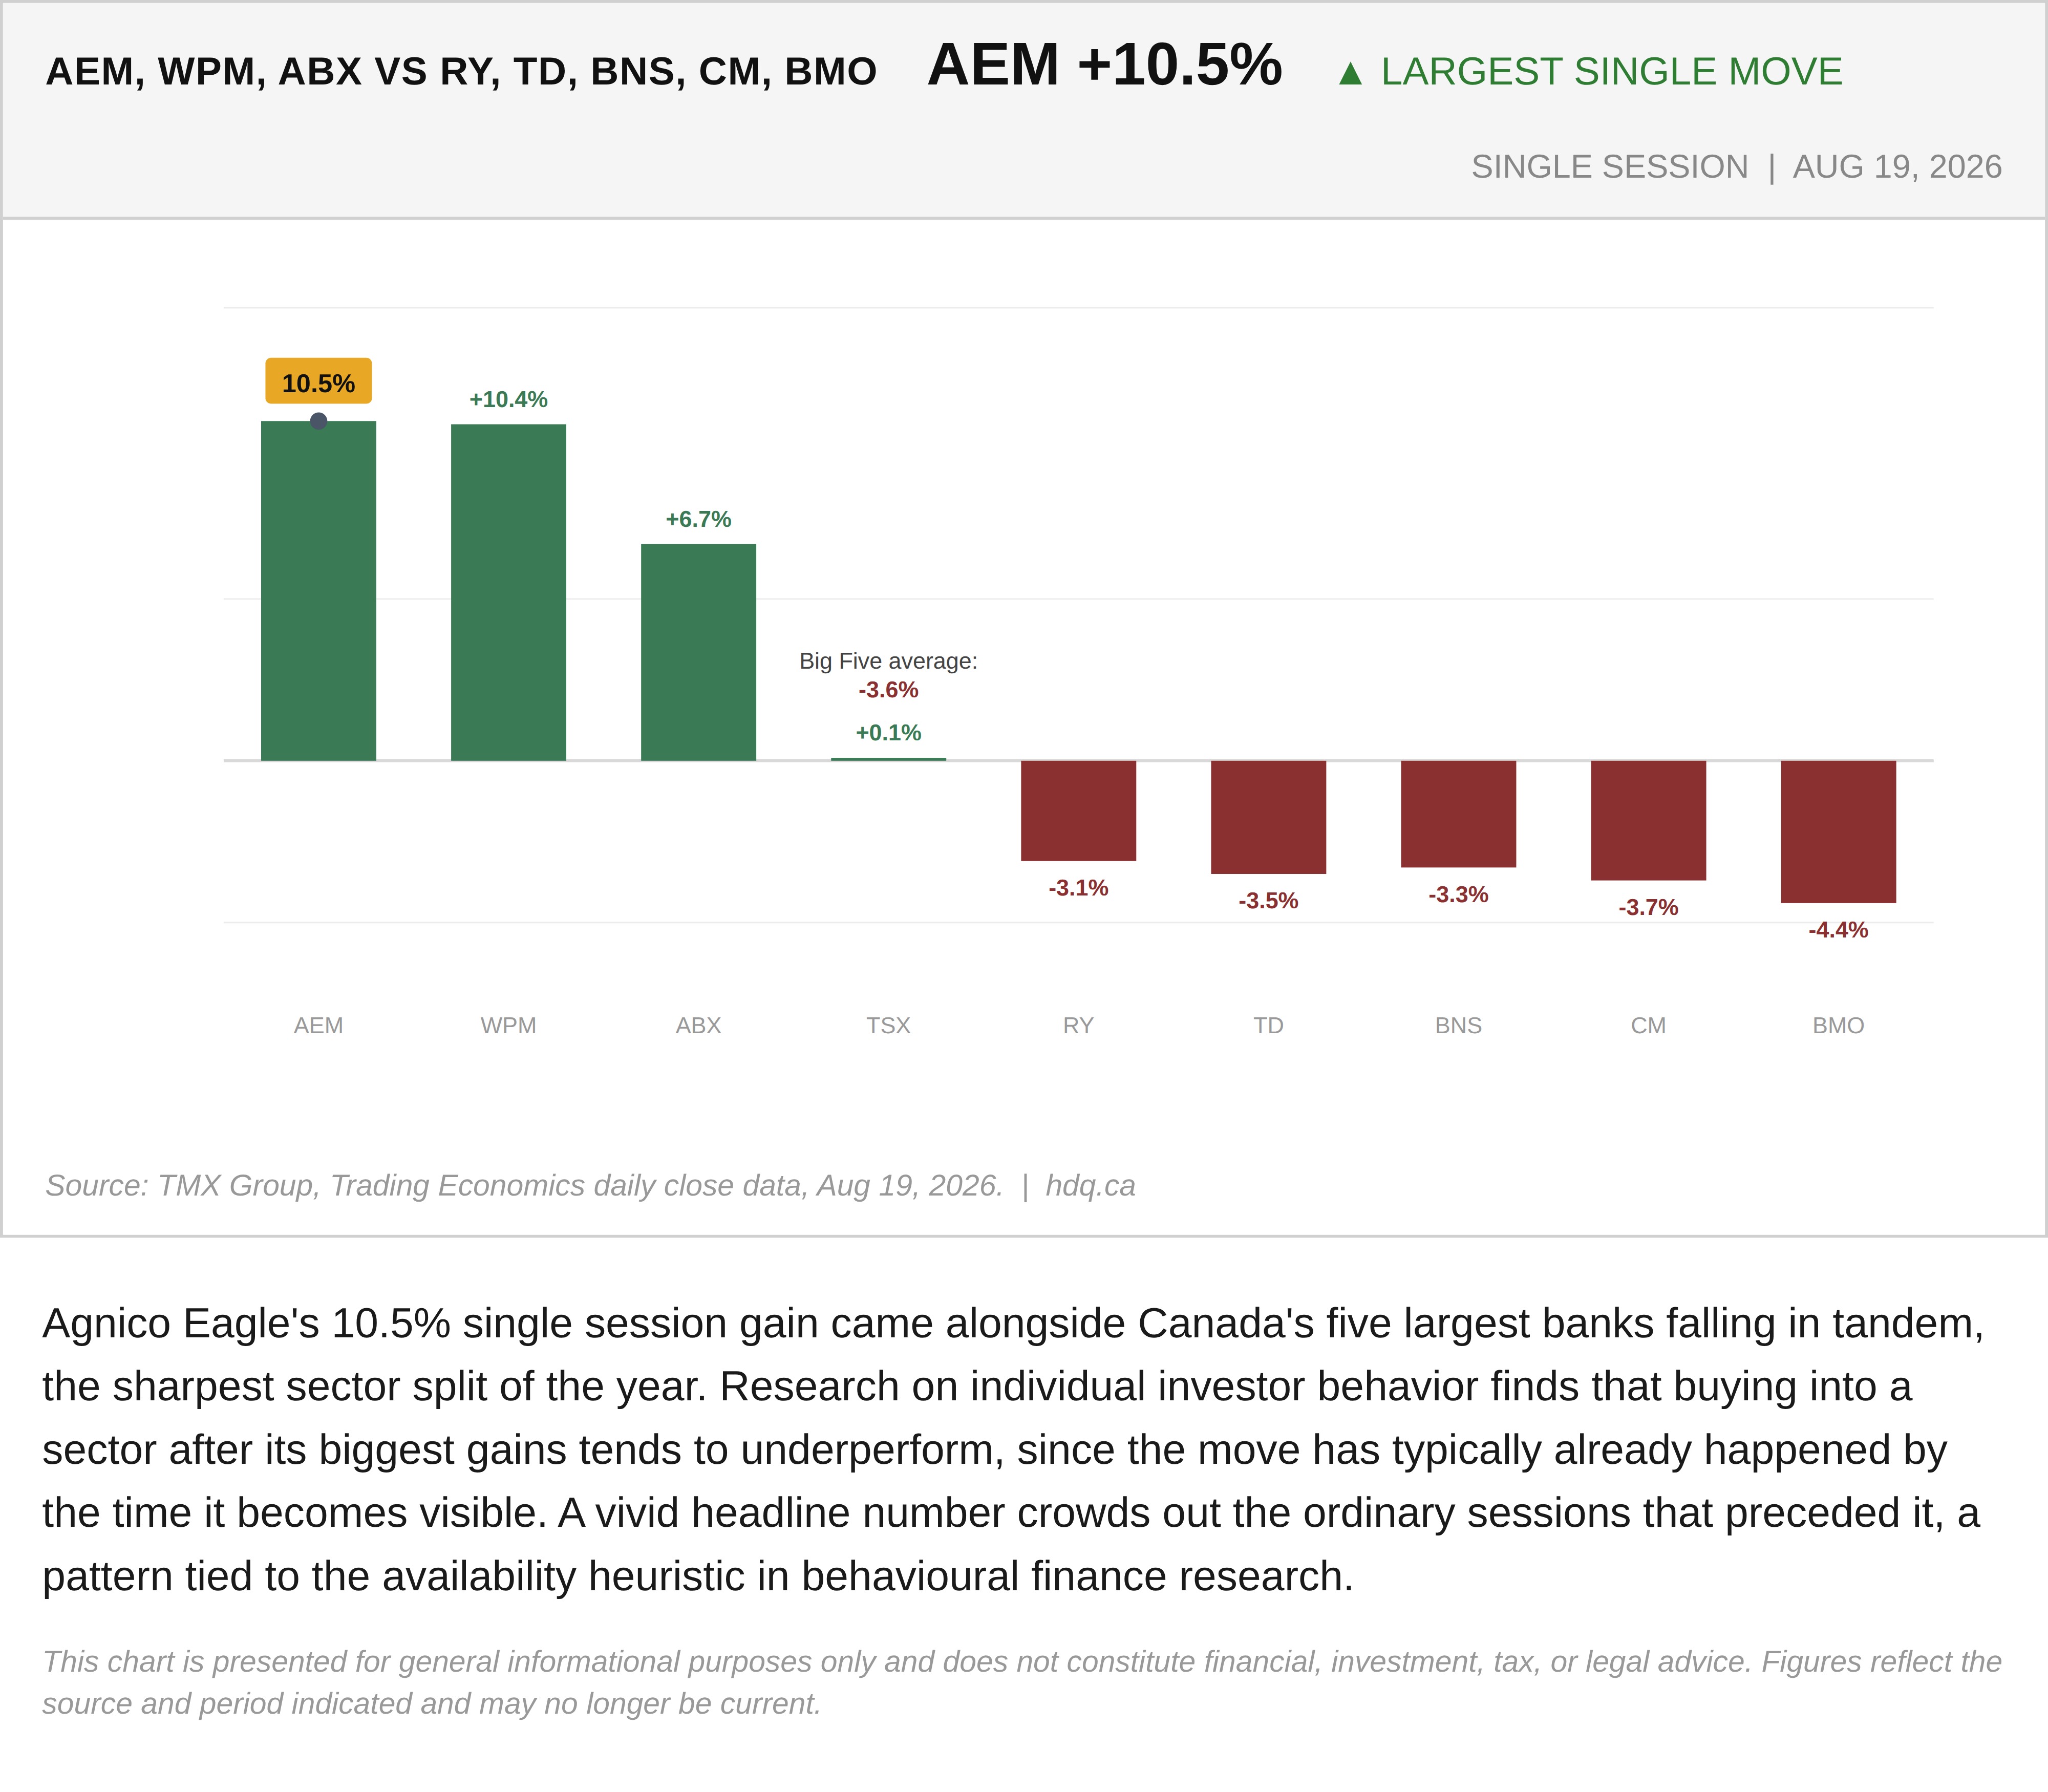
Agnico Eagle's 10.5% single session gain came alongside Canada's five largest banks falling in tandem, the sharpest sector split of the year. Research on individual investor behavior finds that buying into a sector after its biggest gains tends to underperform, since the move has typically already happened by the time it becomes visible. A vivid headline number crowds out the ordinary sessions that preceded it, a pattern tied to the availability heuristic in behavioural finance research.
This chart is presented for general informational purposes only and does not constitute financial, investment, tax, or legal advice. Figures reflect the source and period indicated and may no longer be current.
Related charts
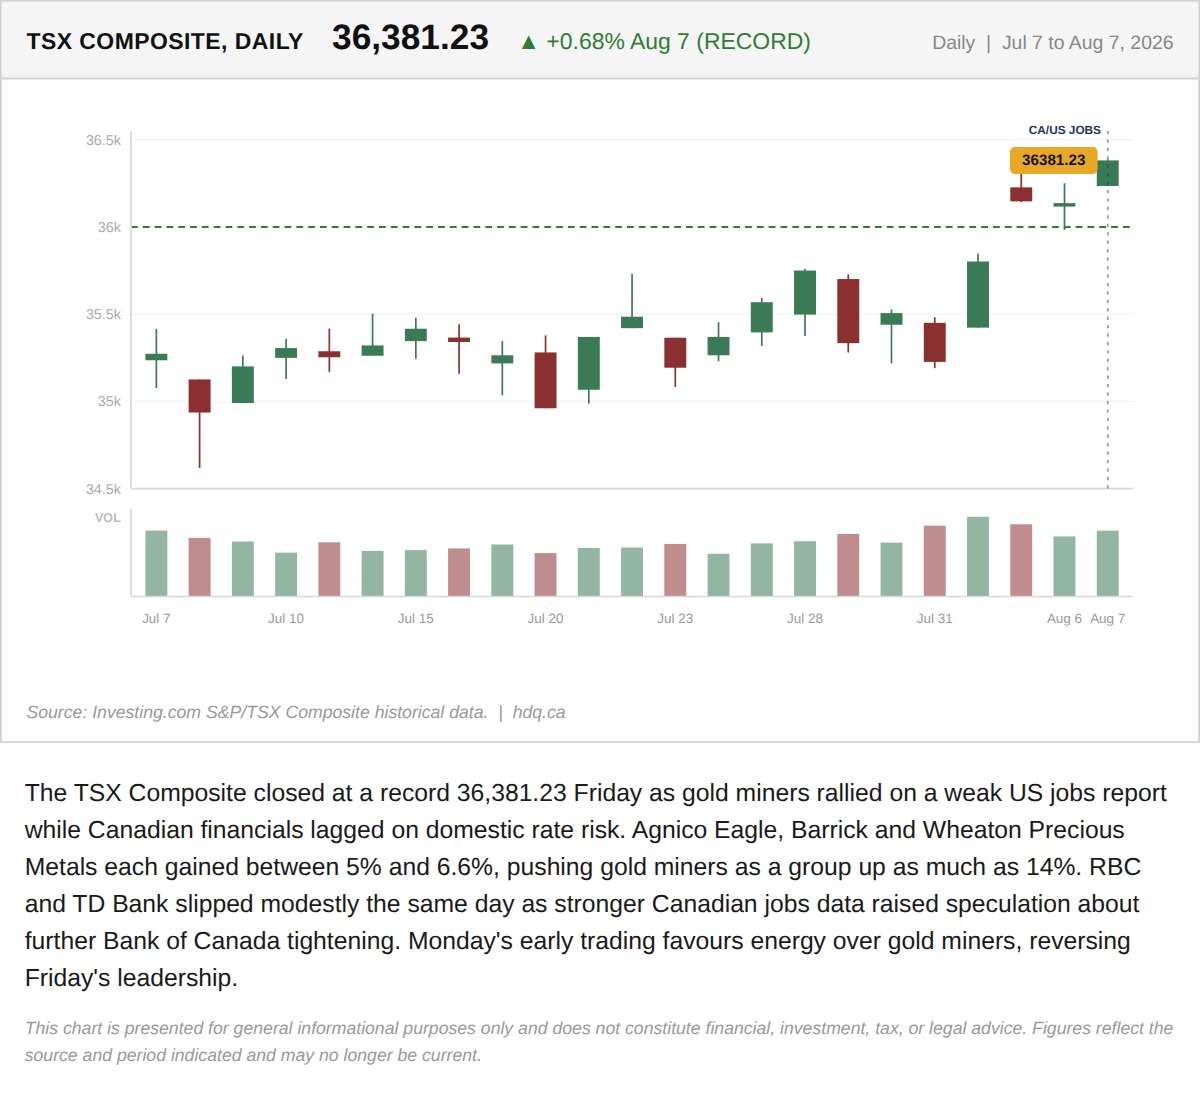
The TSX Composite closed at a record 36,381.23 Friday as gold miners rallied on a weak US jobs report while Canadian financials lagged on domestic rate risk.
The TSX Hit a Record Friday on Gold. Monday's Open Favours Oil Instead.
August 10, 2026
View chart & download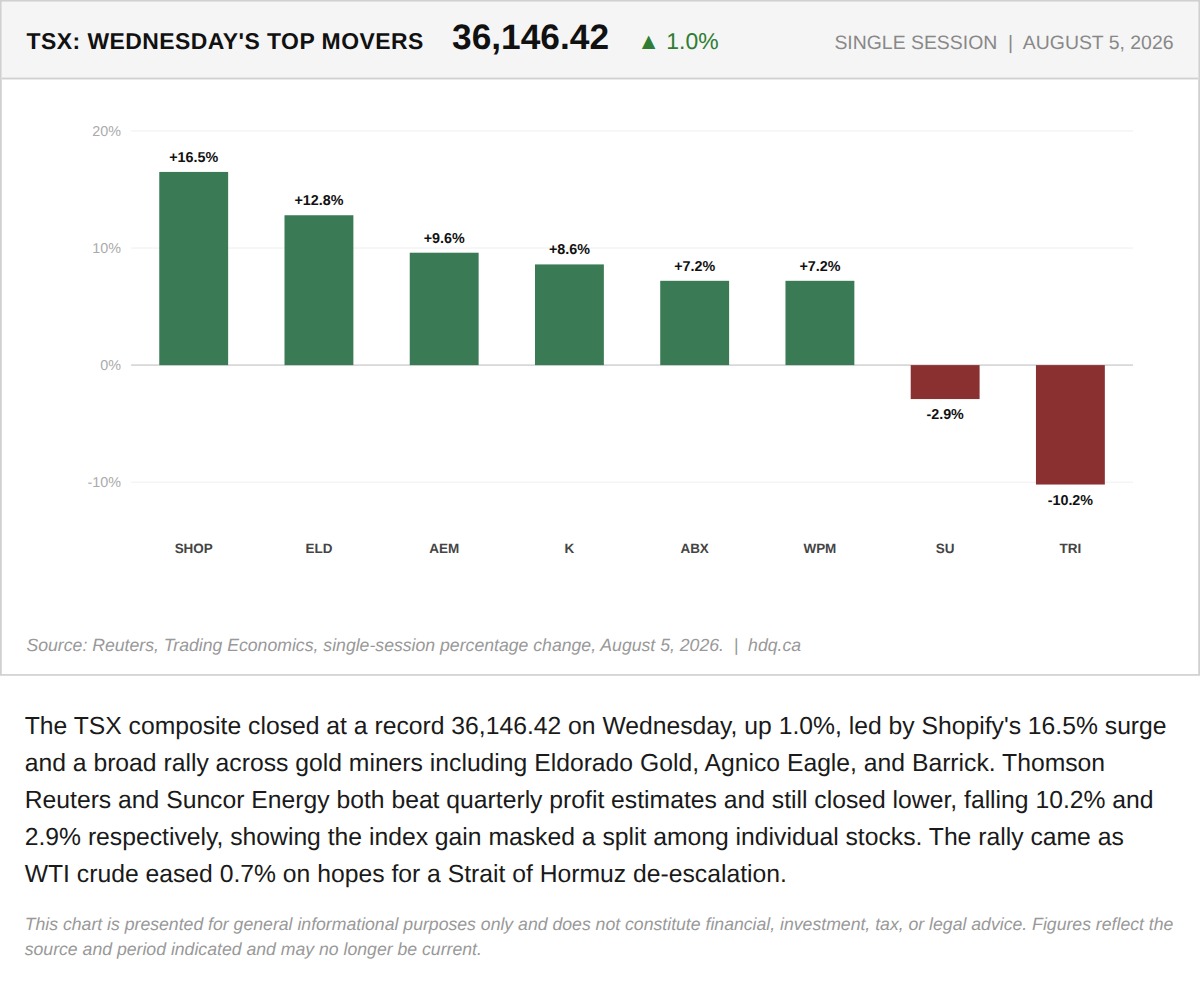
The TSX composite closed at a record 36,146.42 on Wednesday, up 1.0%, led by Shopify's 16.5% surge and a broad rally across gold miners…
TSX Hits a Record Close as Gold Miners and Shopify Carry the Index
August 5, 2026
View chart & download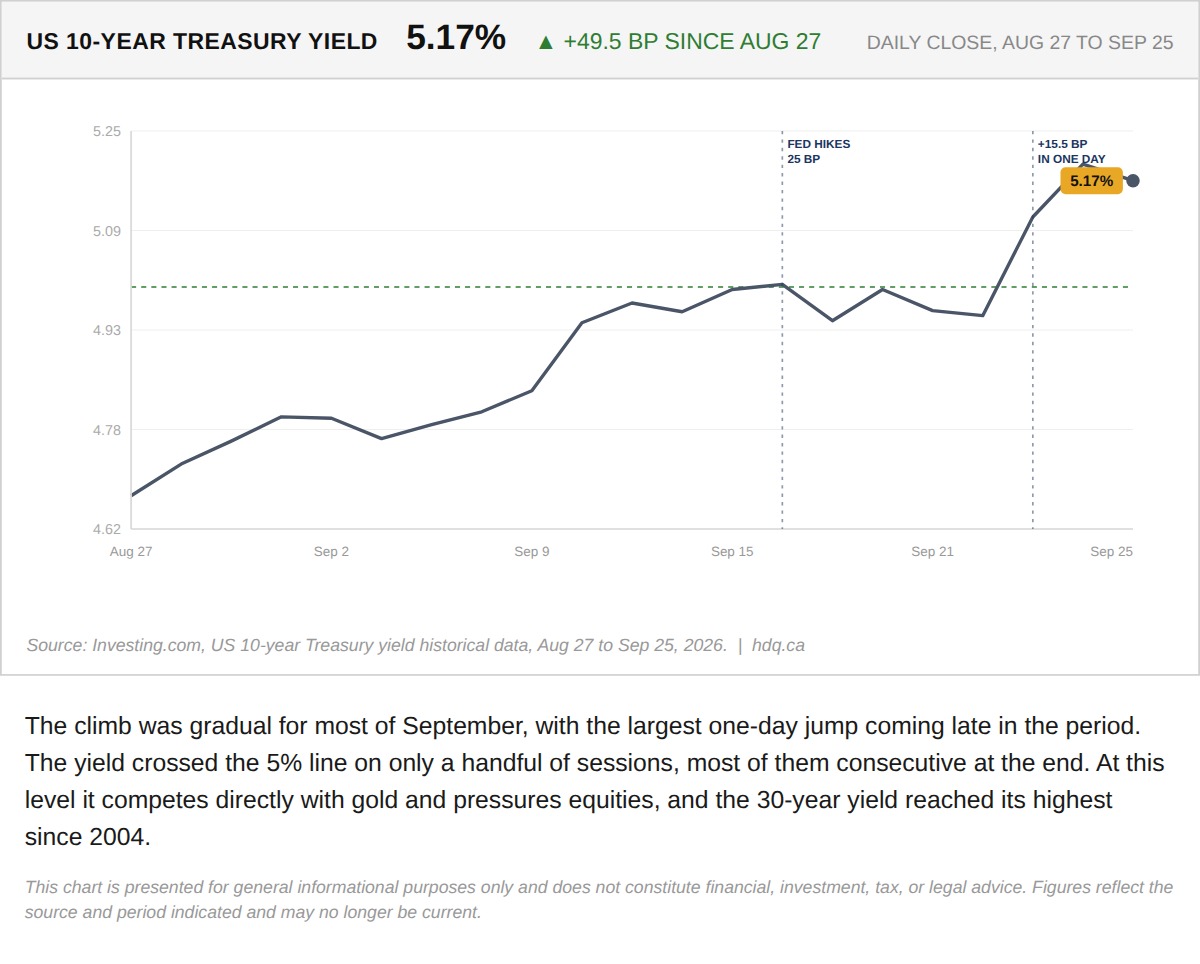
The climb was gradual for most of September, with the largest one-day jump coming late in the period.
US 10-Year Treasury Yield Rises Steadily Through September
September 28, 2026
View chart & download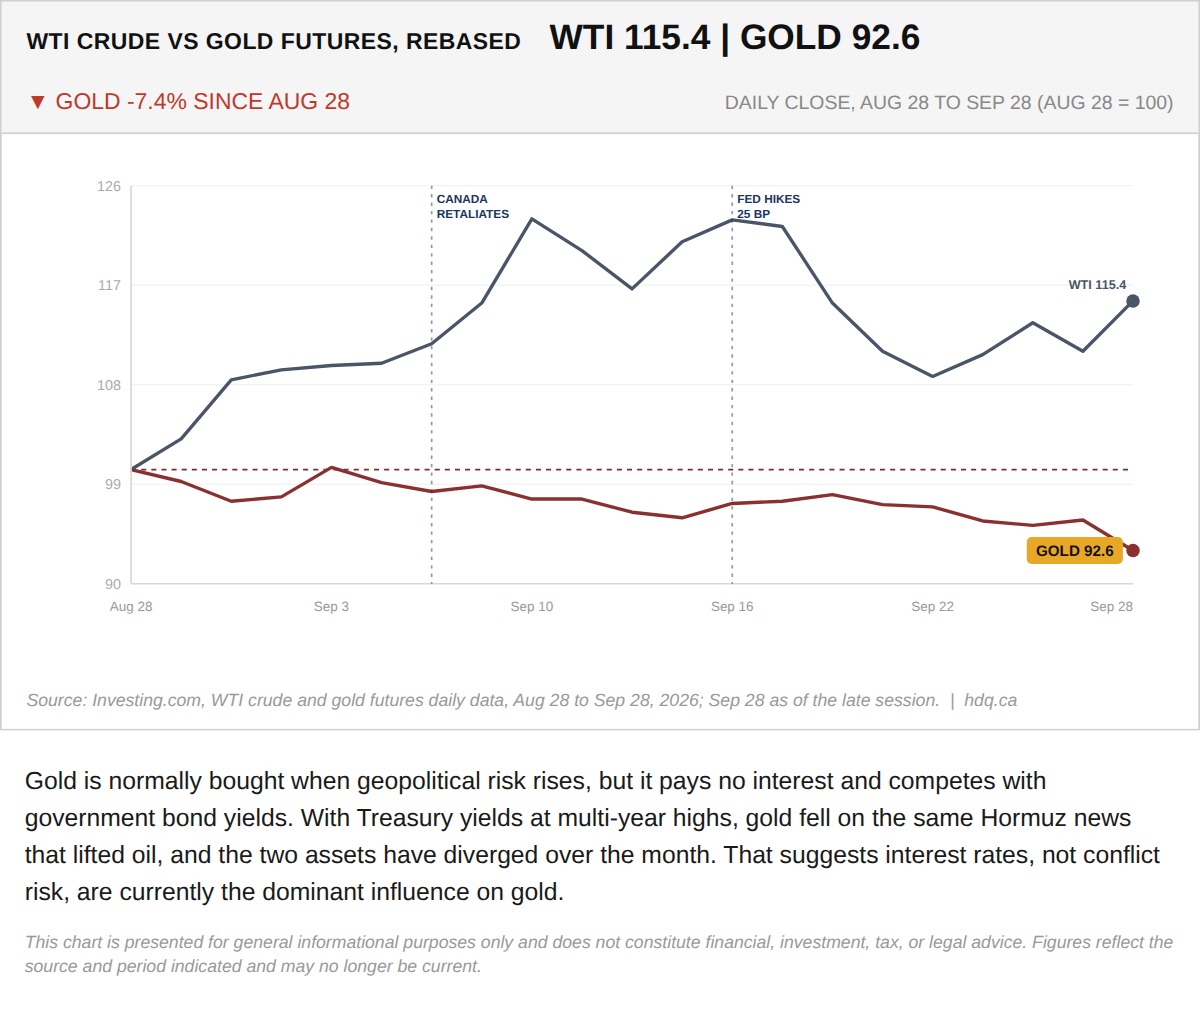
Gold is normally bought when geopolitical risk rises, but it pays no interest and competes with government bond yields.
Gold Falls While Oil Rises as Hormuz Talks Stall
September 28, 2026
View chart & download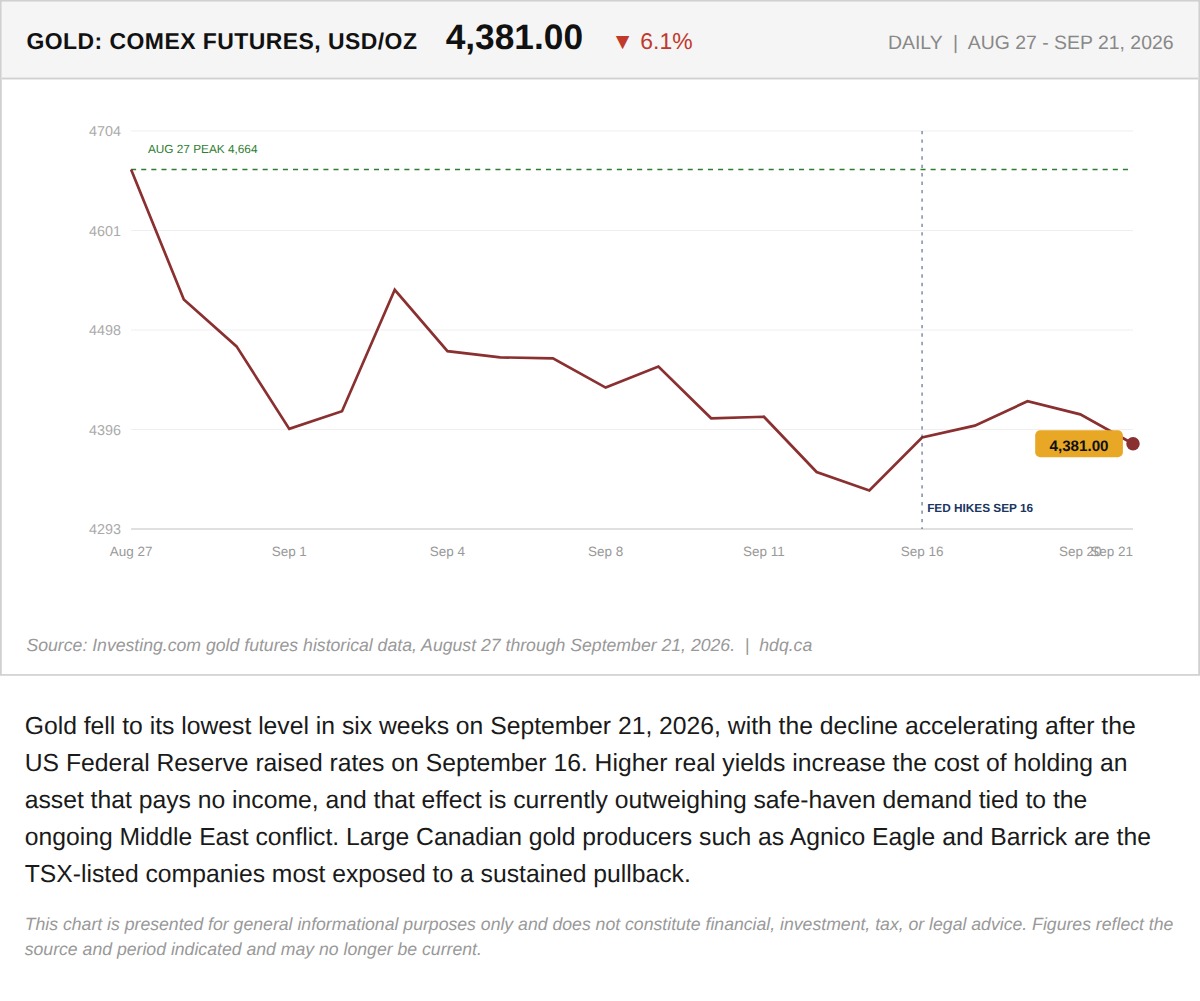
Gold fell to its lowest level in six weeks on September 21, 2026, with the decline accelerating after the US Federal Reserve raised rates on September 16.
Gold Falls to a Six-Week Low as the Fed Hike Outweighs the War Premium
September 22, 2026
View chart & download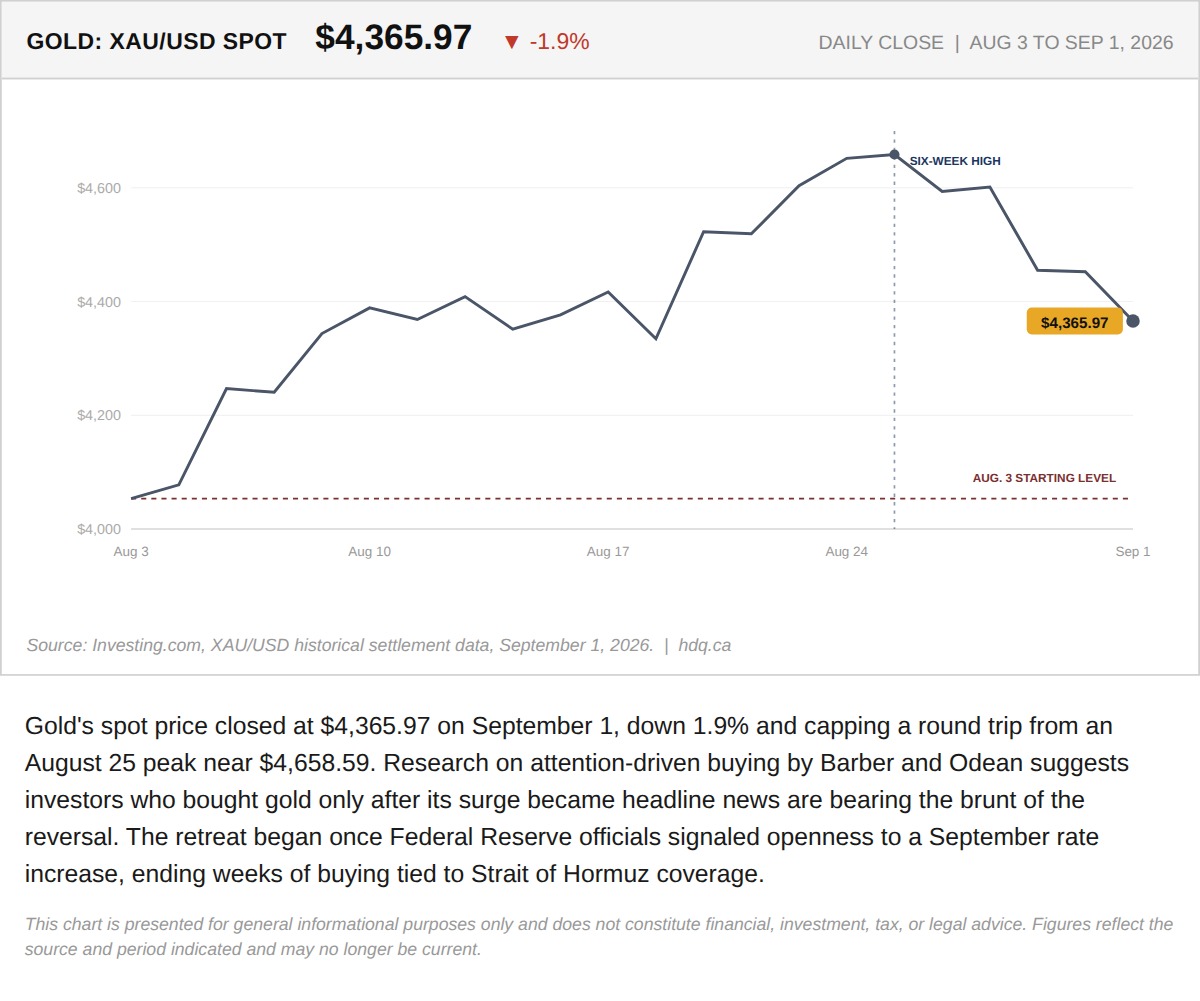
Gold's spot price closed at $4,365.97 on September 1, down 1.9% and capping a round trip from an August 25 peak near $4,658.59.
Gold's Spot Price Pulls Back 1.9% After an Attention-Driven August Surge
September 2, 2026
View chart & download