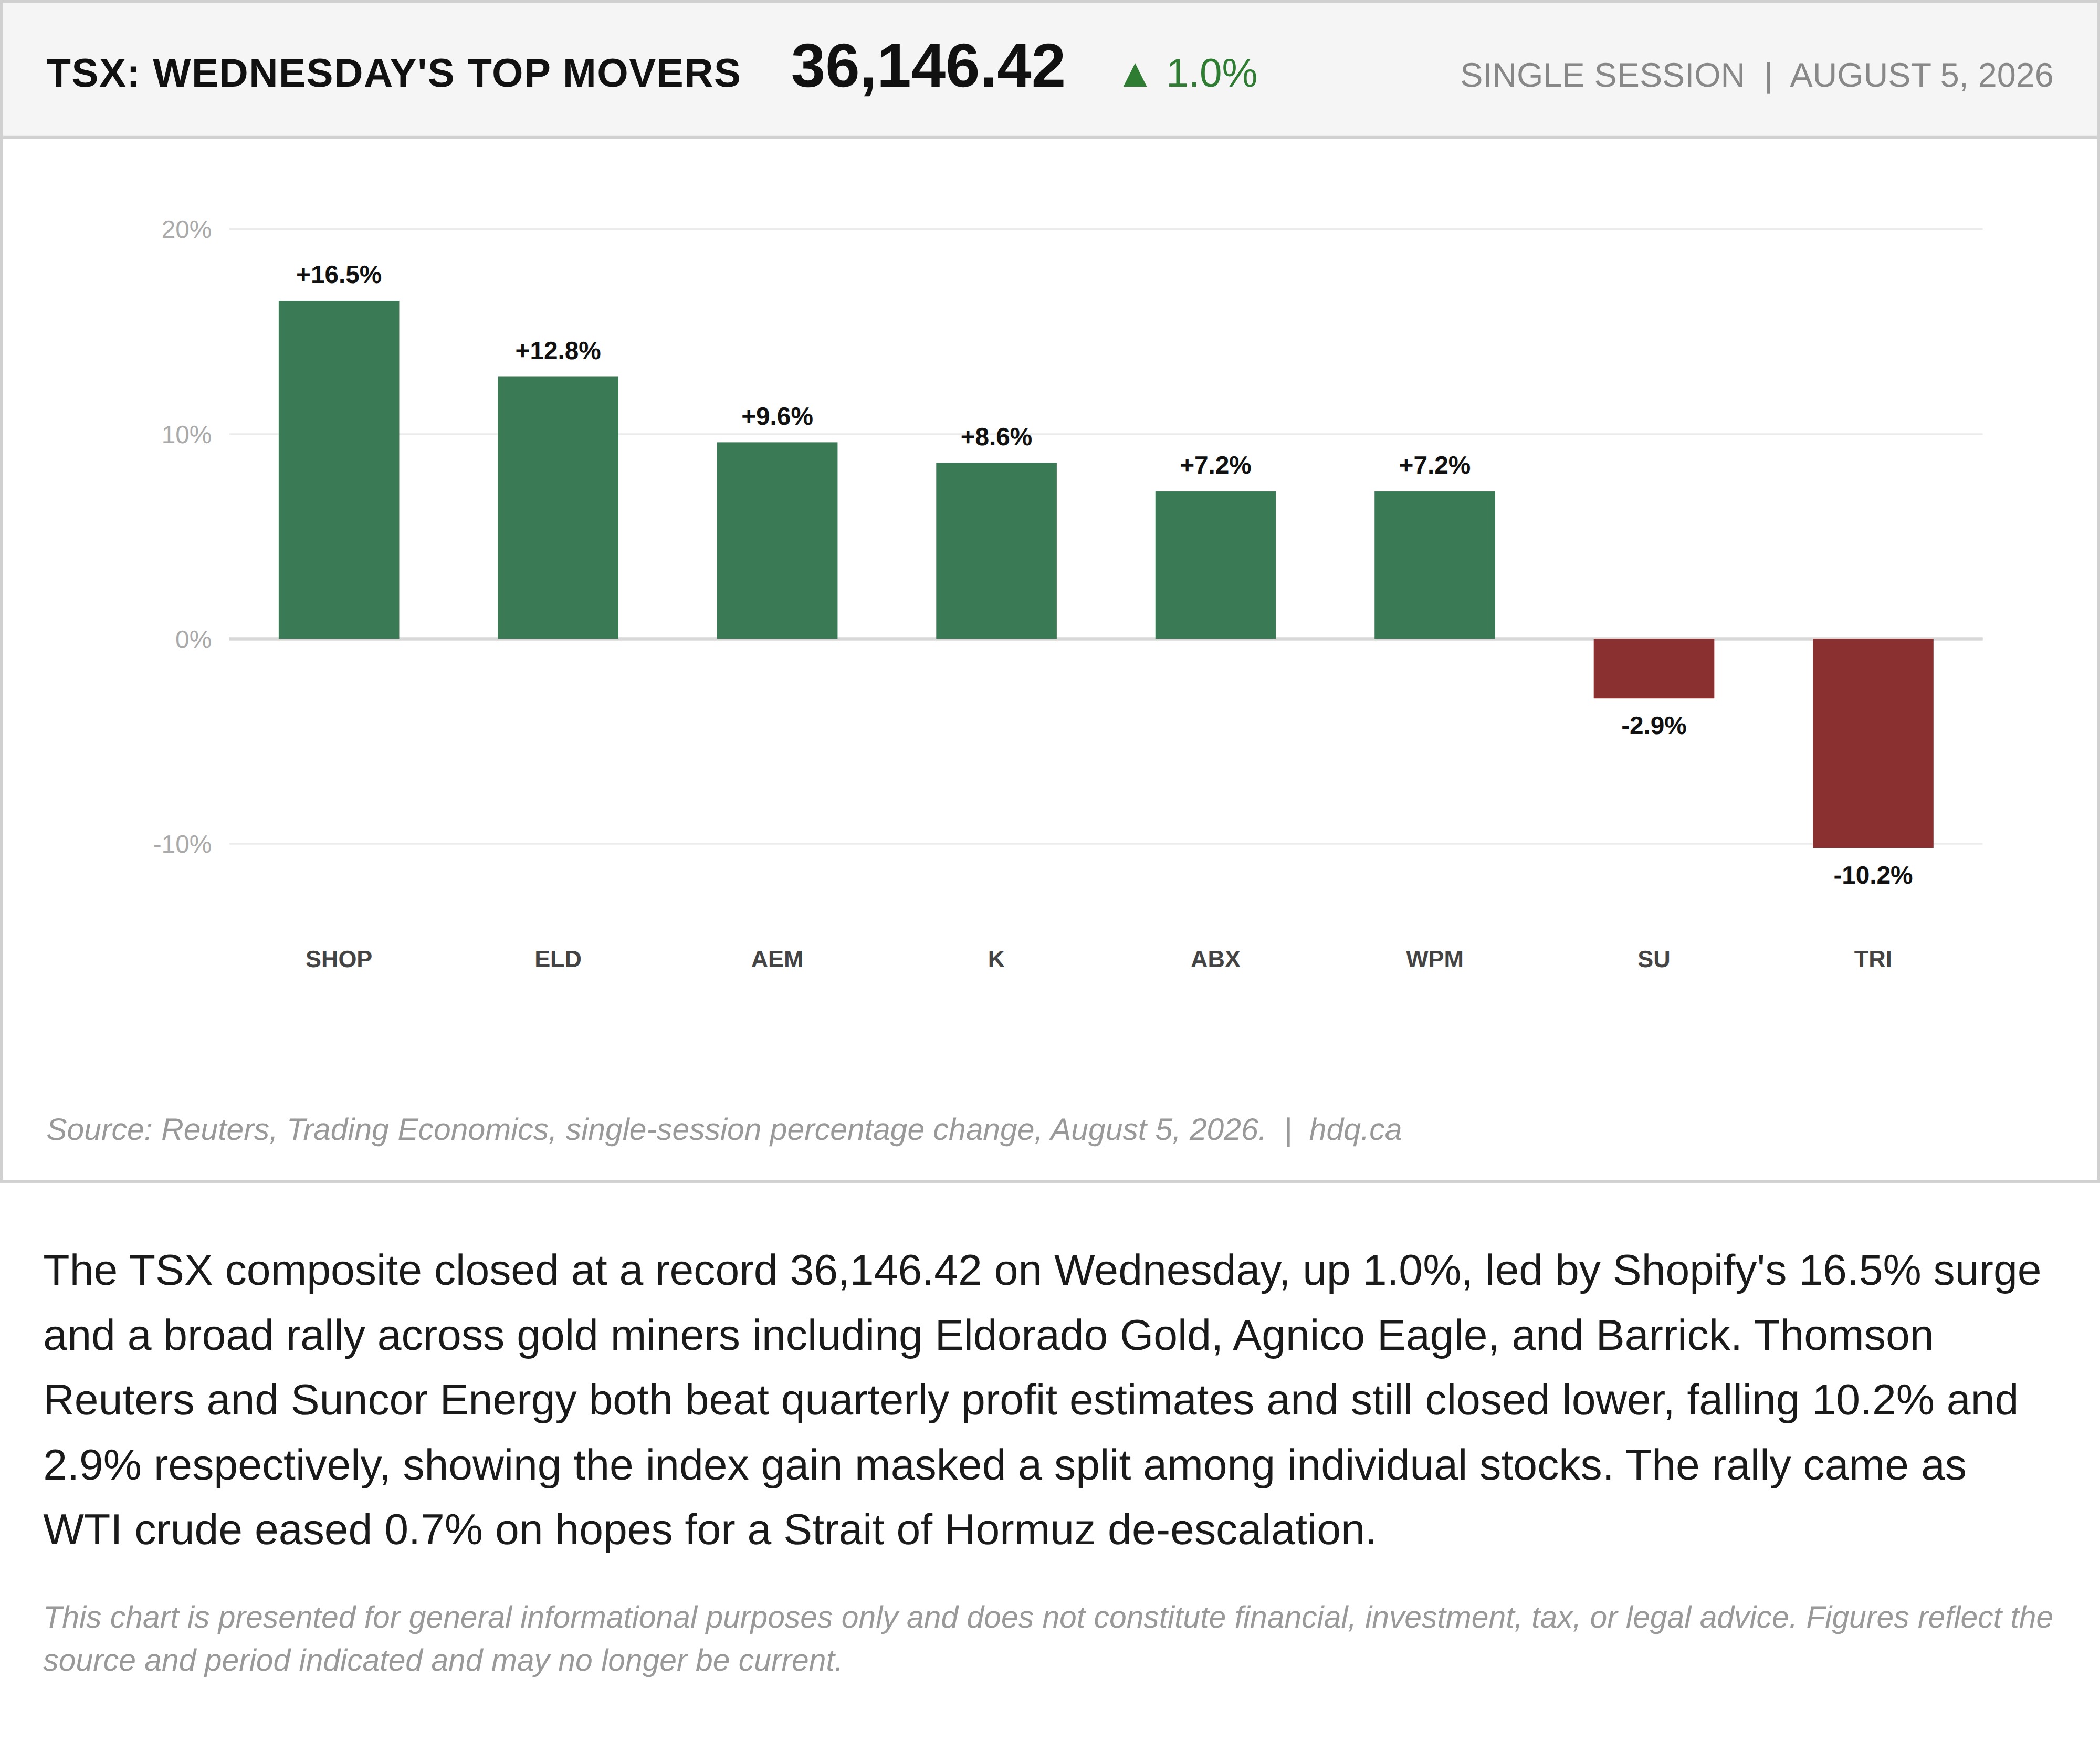
The TSX composite closed at a record 36,146.42 on Wednesday, up 1.0%, led by Shopify's 16.5% surge and a broad rally across gold miners including Eldorado Gold, Agnico Eagle, and Barrick. Thomson Reuters and Suncor Energy both beat quarterly profit estimates and still closed lower, falling 10.2% and 2.9% respectively, showing the index gain masked a split among individual stocks. The rally came as WTI crude eased 0.7% on hopes for a Strait of Hormuz de-escalation.
This chart is presented for general informational purposes only and does not constitute financial, investment, tax, or legal advice. Figures reflect the source and period indicated and may no longer be current.
Related charts
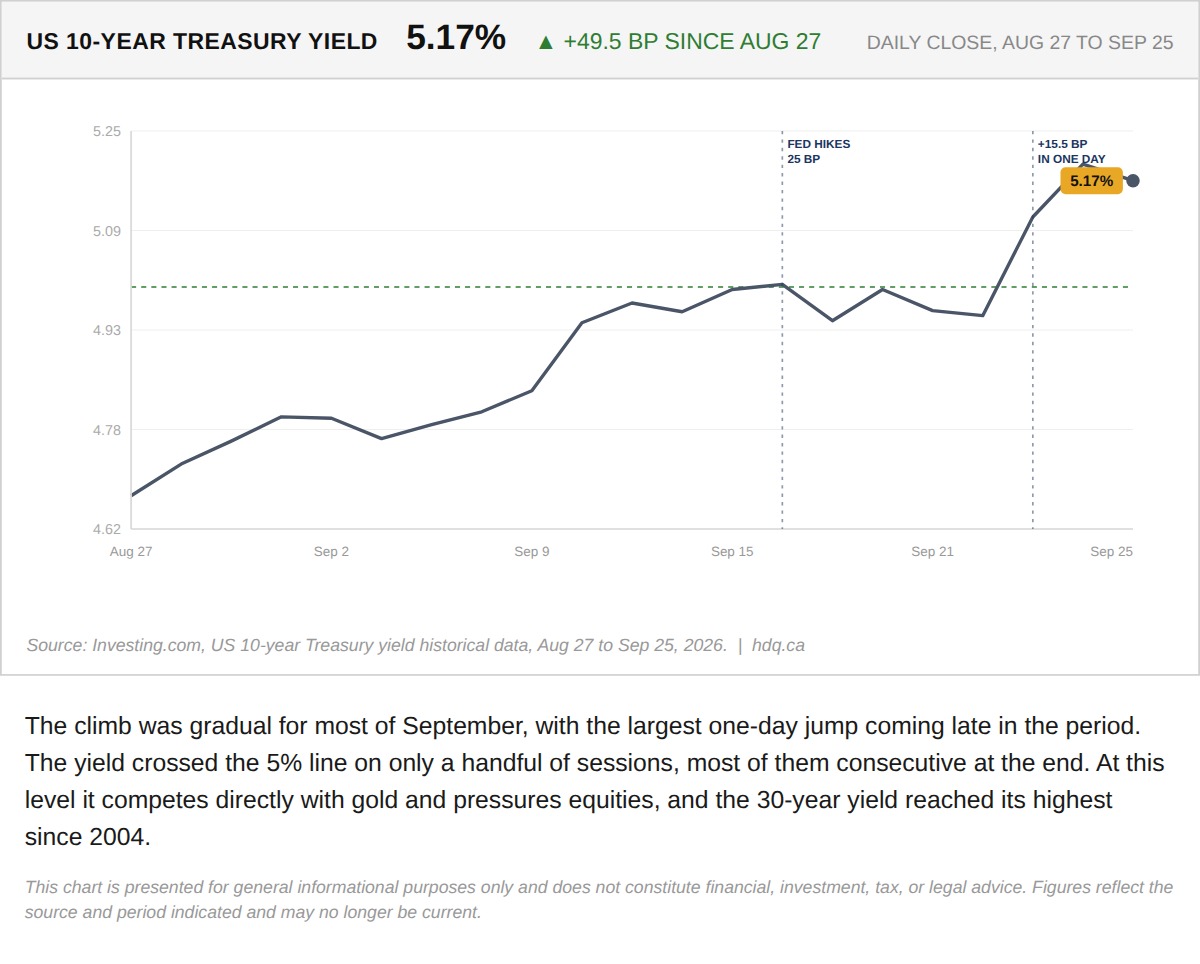
The climb was gradual for most of September, with the largest one-day jump coming late in the period.
US 10-Year Treasury Yield Rises Steadily Through September
September 28, 2026
View chart & download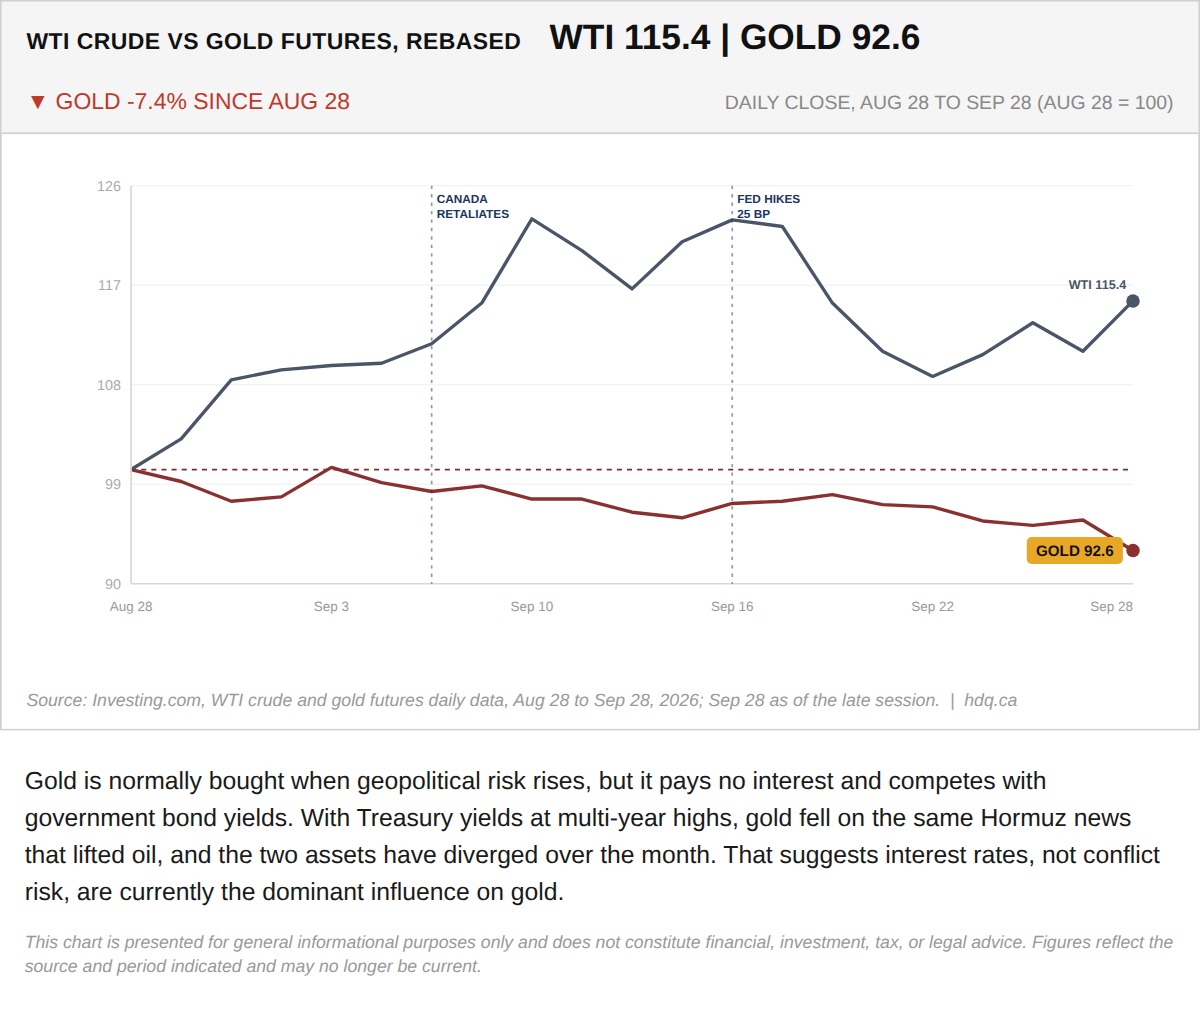
Gold is normally bought when geopolitical risk rises, but it pays no interest and competes with government bond yields.
Gold Falls While Oil Rises as Hormuz Talks Stall
September 28, 2026
View chart & download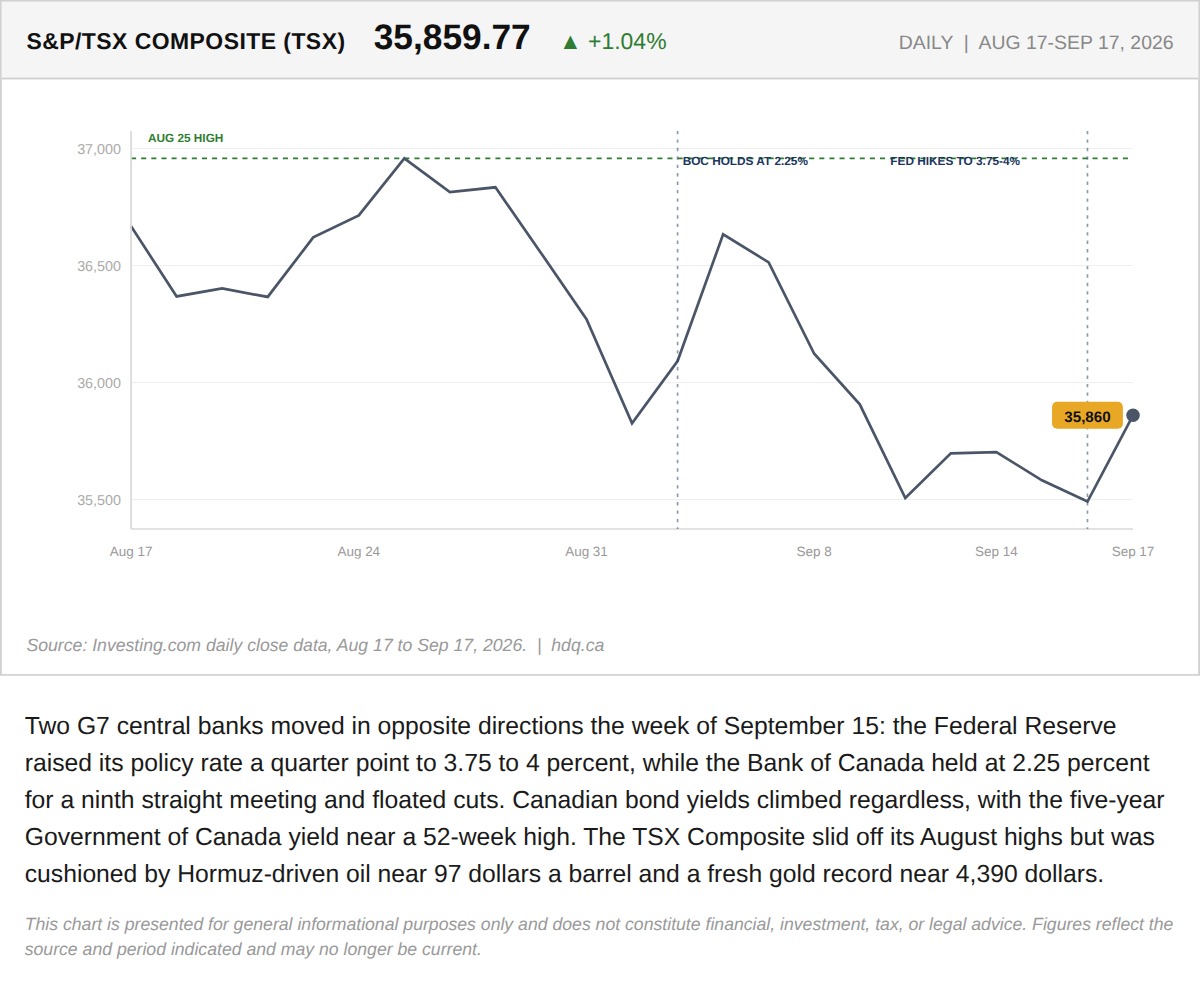
Two G7 central banks moved in opposite directions the week of September 15: the Federal Reserve raised its policy rate a quarter point to…
The Week the Bank of Canada's Own Rate Stopped Setting Canadian Borrowing Costs
September 19, 2026
View chart & download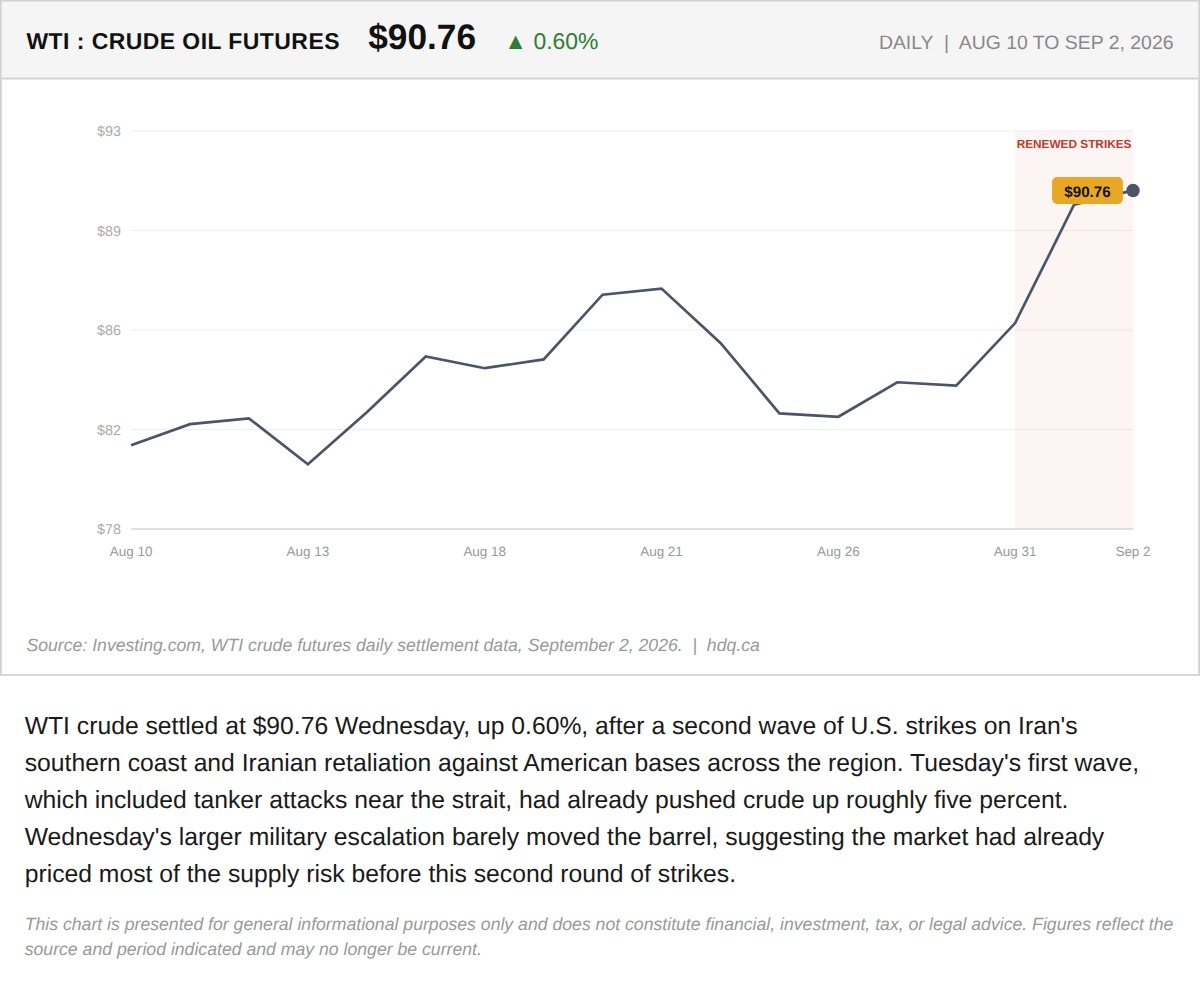
WTI crude settled at $90.76 Wednesday, up 0.60%, after a second wave of U.S.
WTI Crude Adds 0.60% as a Second Wave of Strikes Near Iran Barely Moves the Barrel
September 2, 2026
View chart & download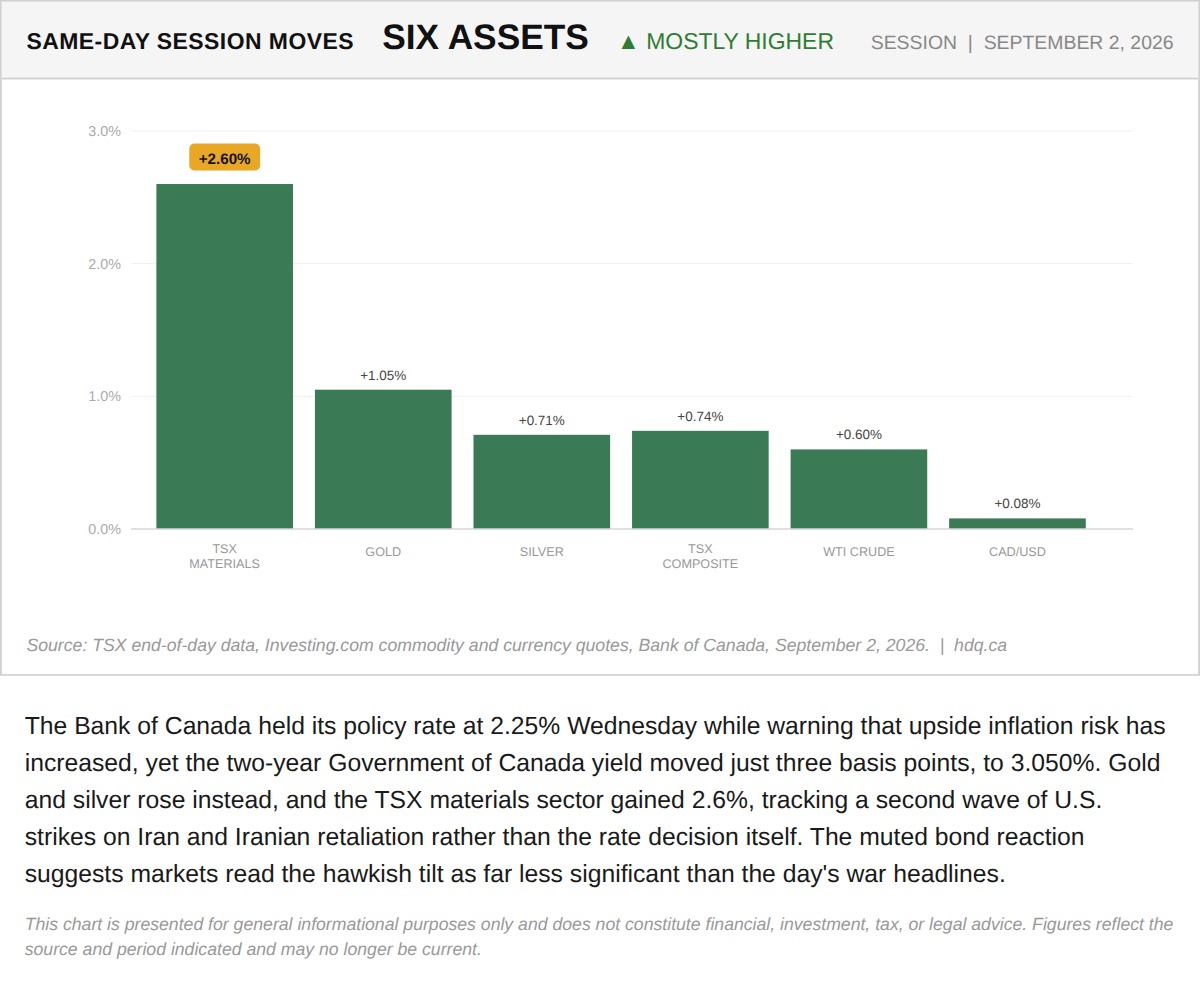
The Bank of Canada held its policy rate at 2.25% Wednesday while warning that upside inflation risk has increased, yet the two-year…
TSX Materials, Gold and Silver Lead a Broad Same-Day Rally Across Six Assets
September 2, 2026
View chart & download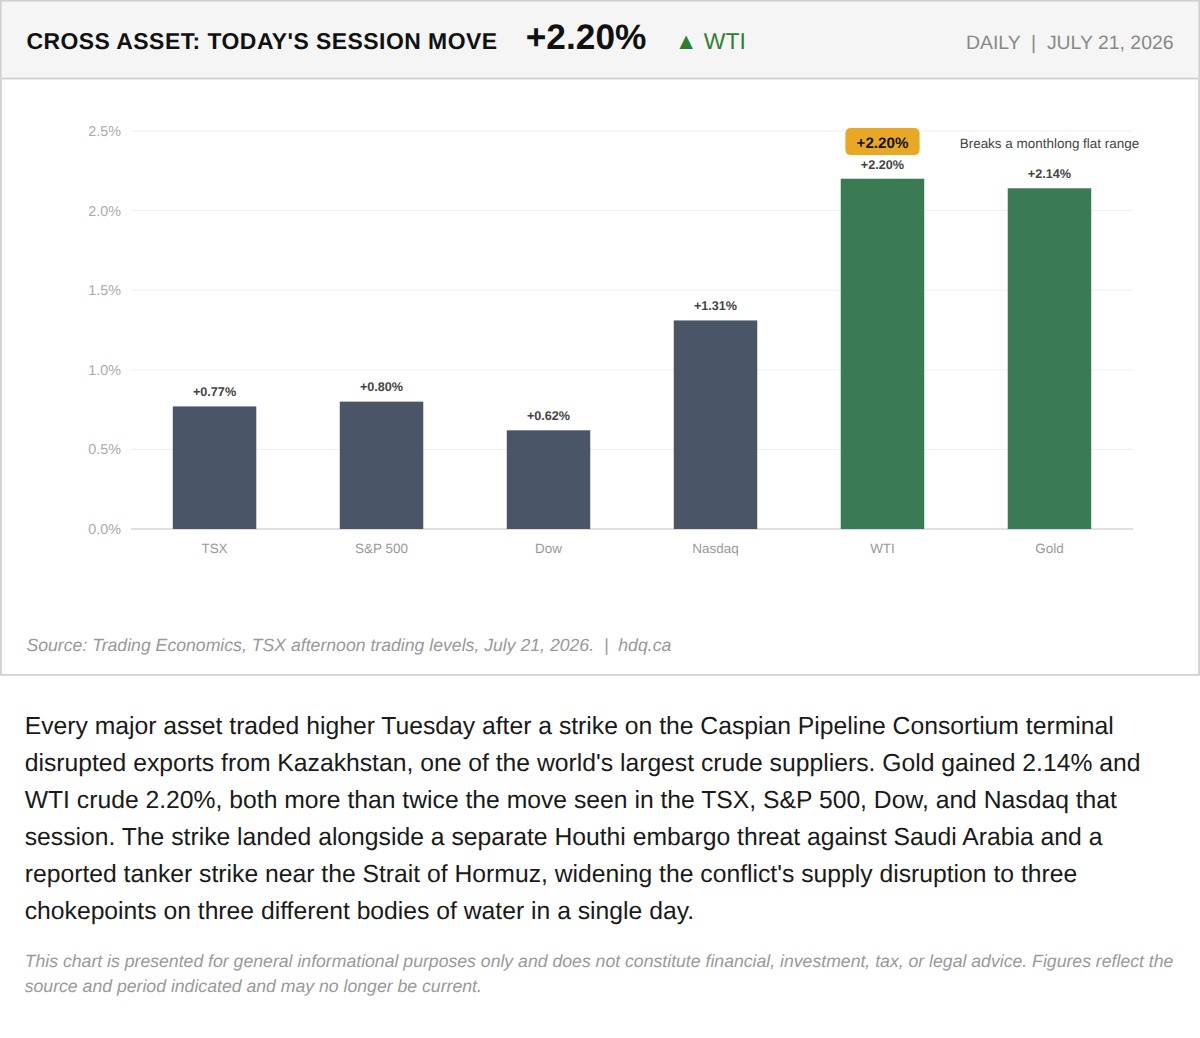
Every major asset traded higher Tuesday after a strike on the Caspian Pipeline Consortium terminal disrupted exports from Kazakhstan, one of the world's largest crude suppliers.
A Kazakhstan Pipeline Strike, Not Hormuz, Just Broke Gold's Monthlong Anchor
July 21, 2026
View chart & download