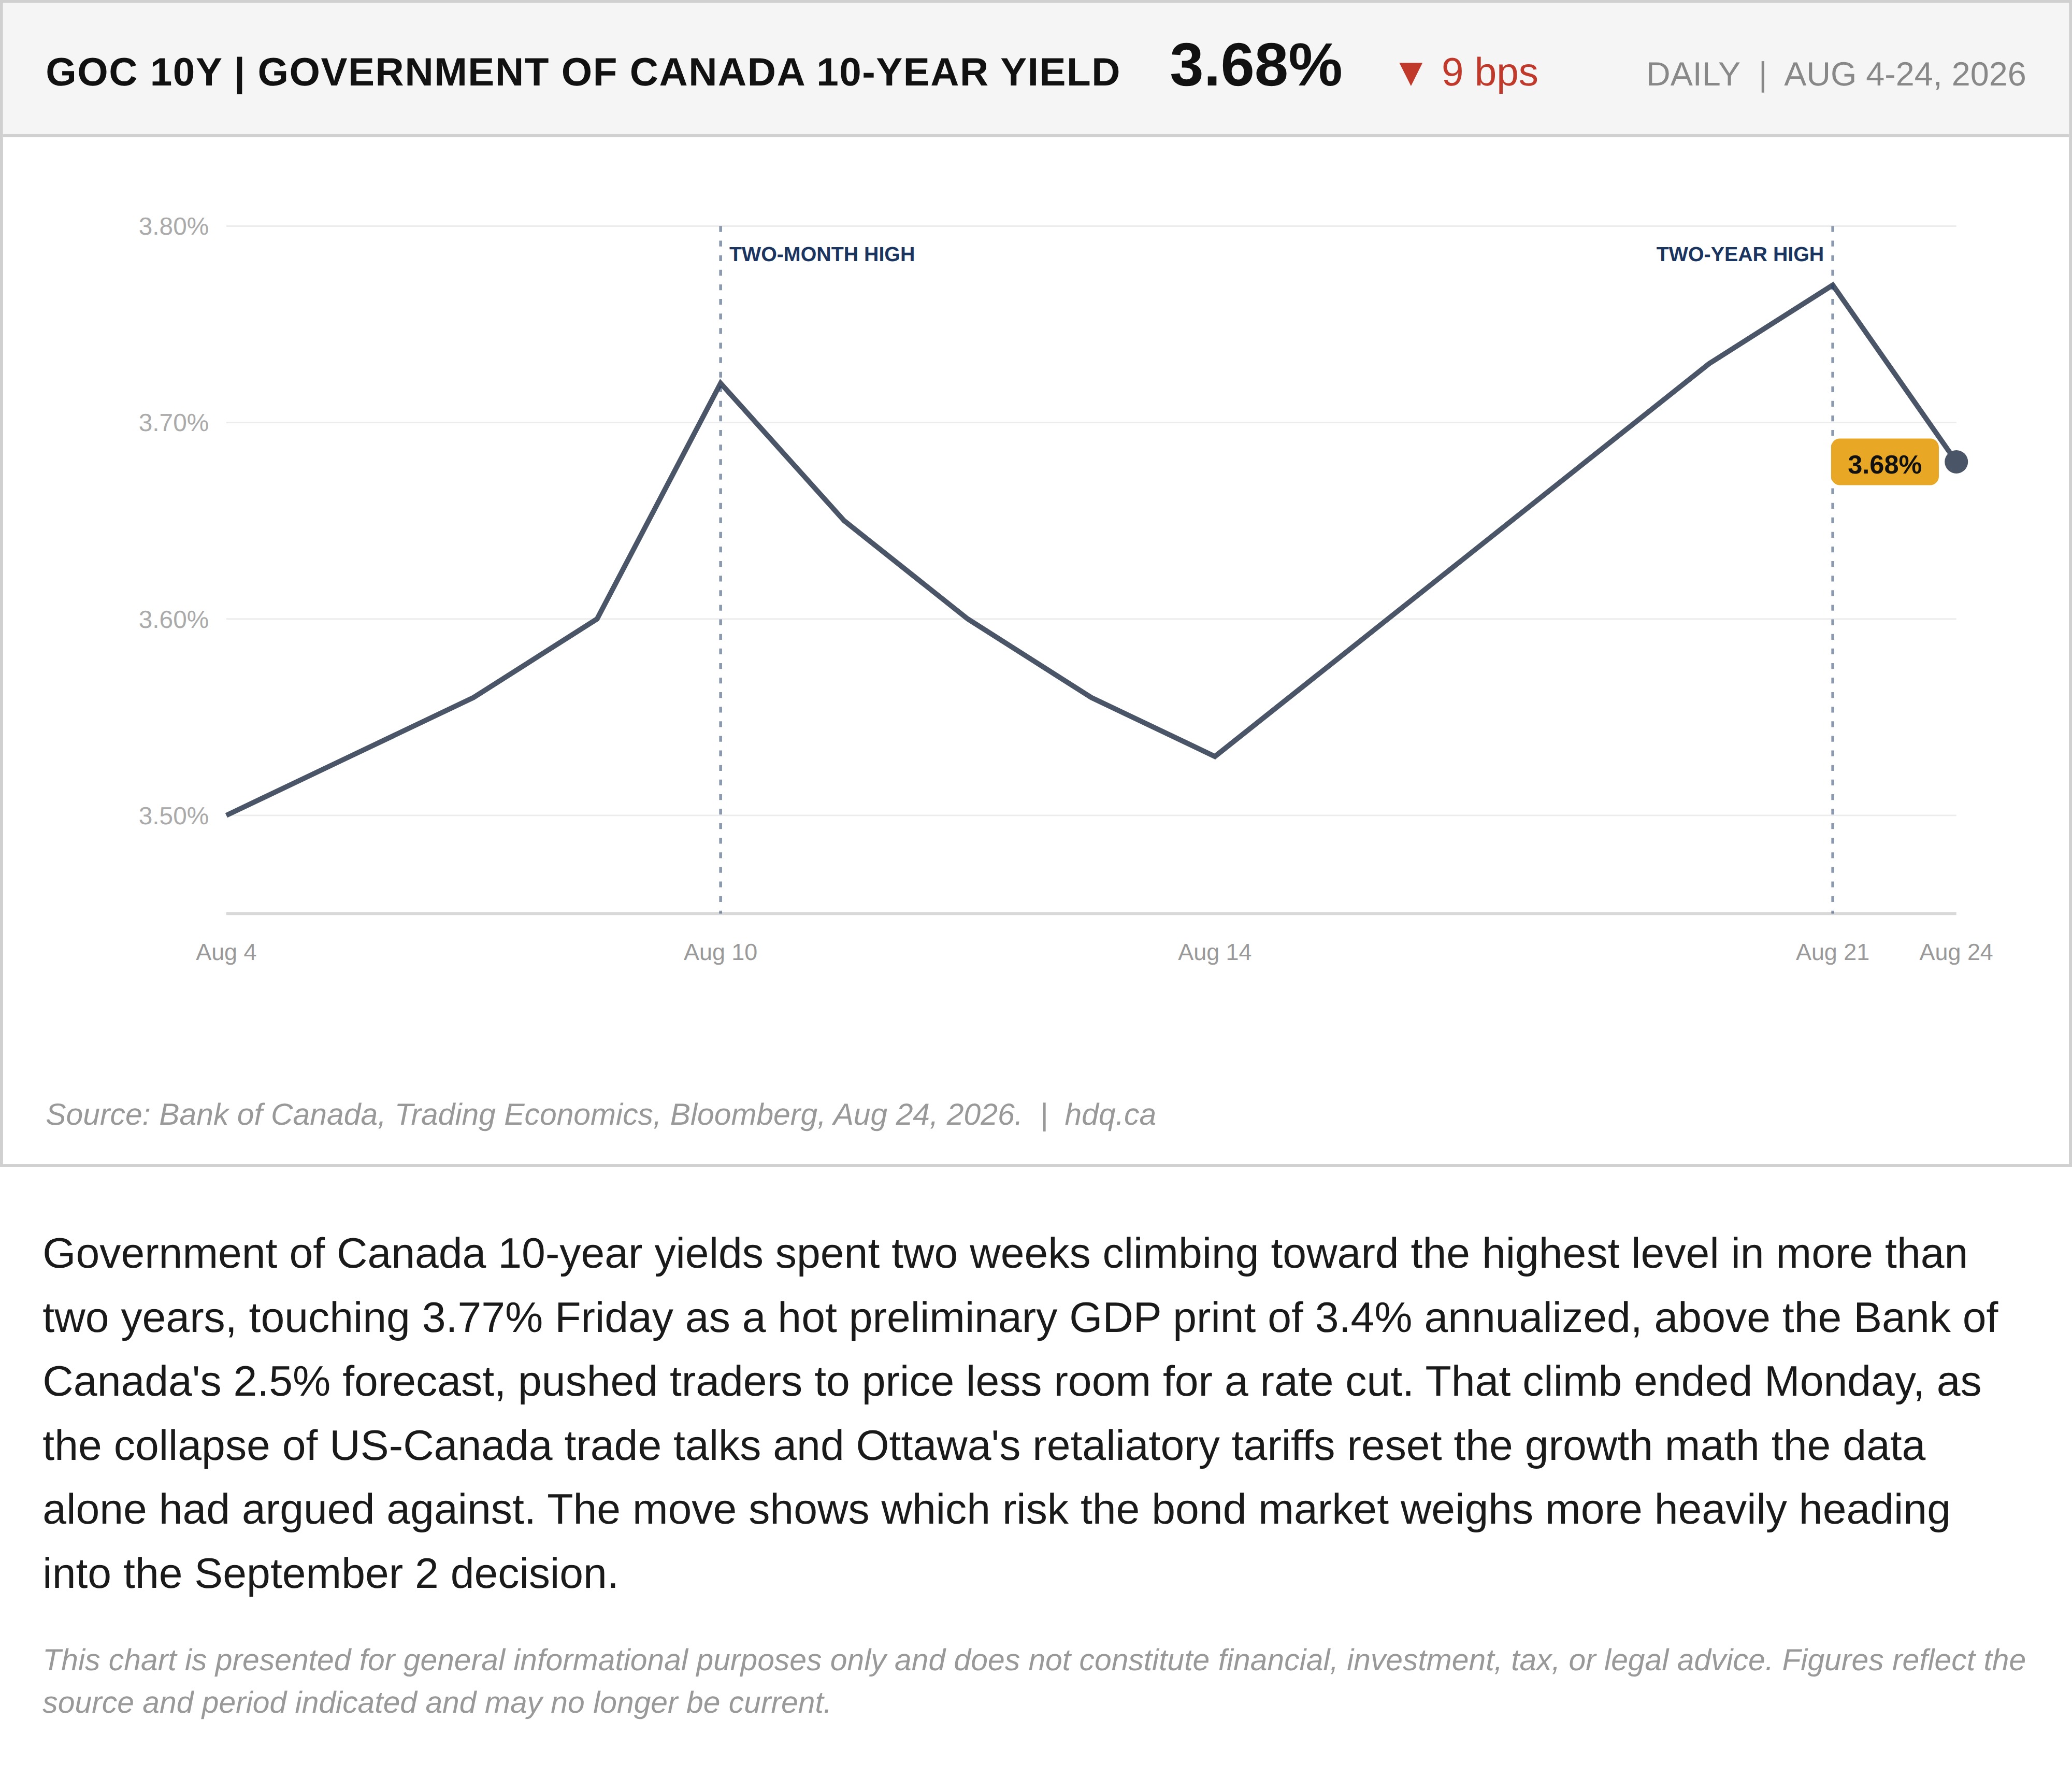
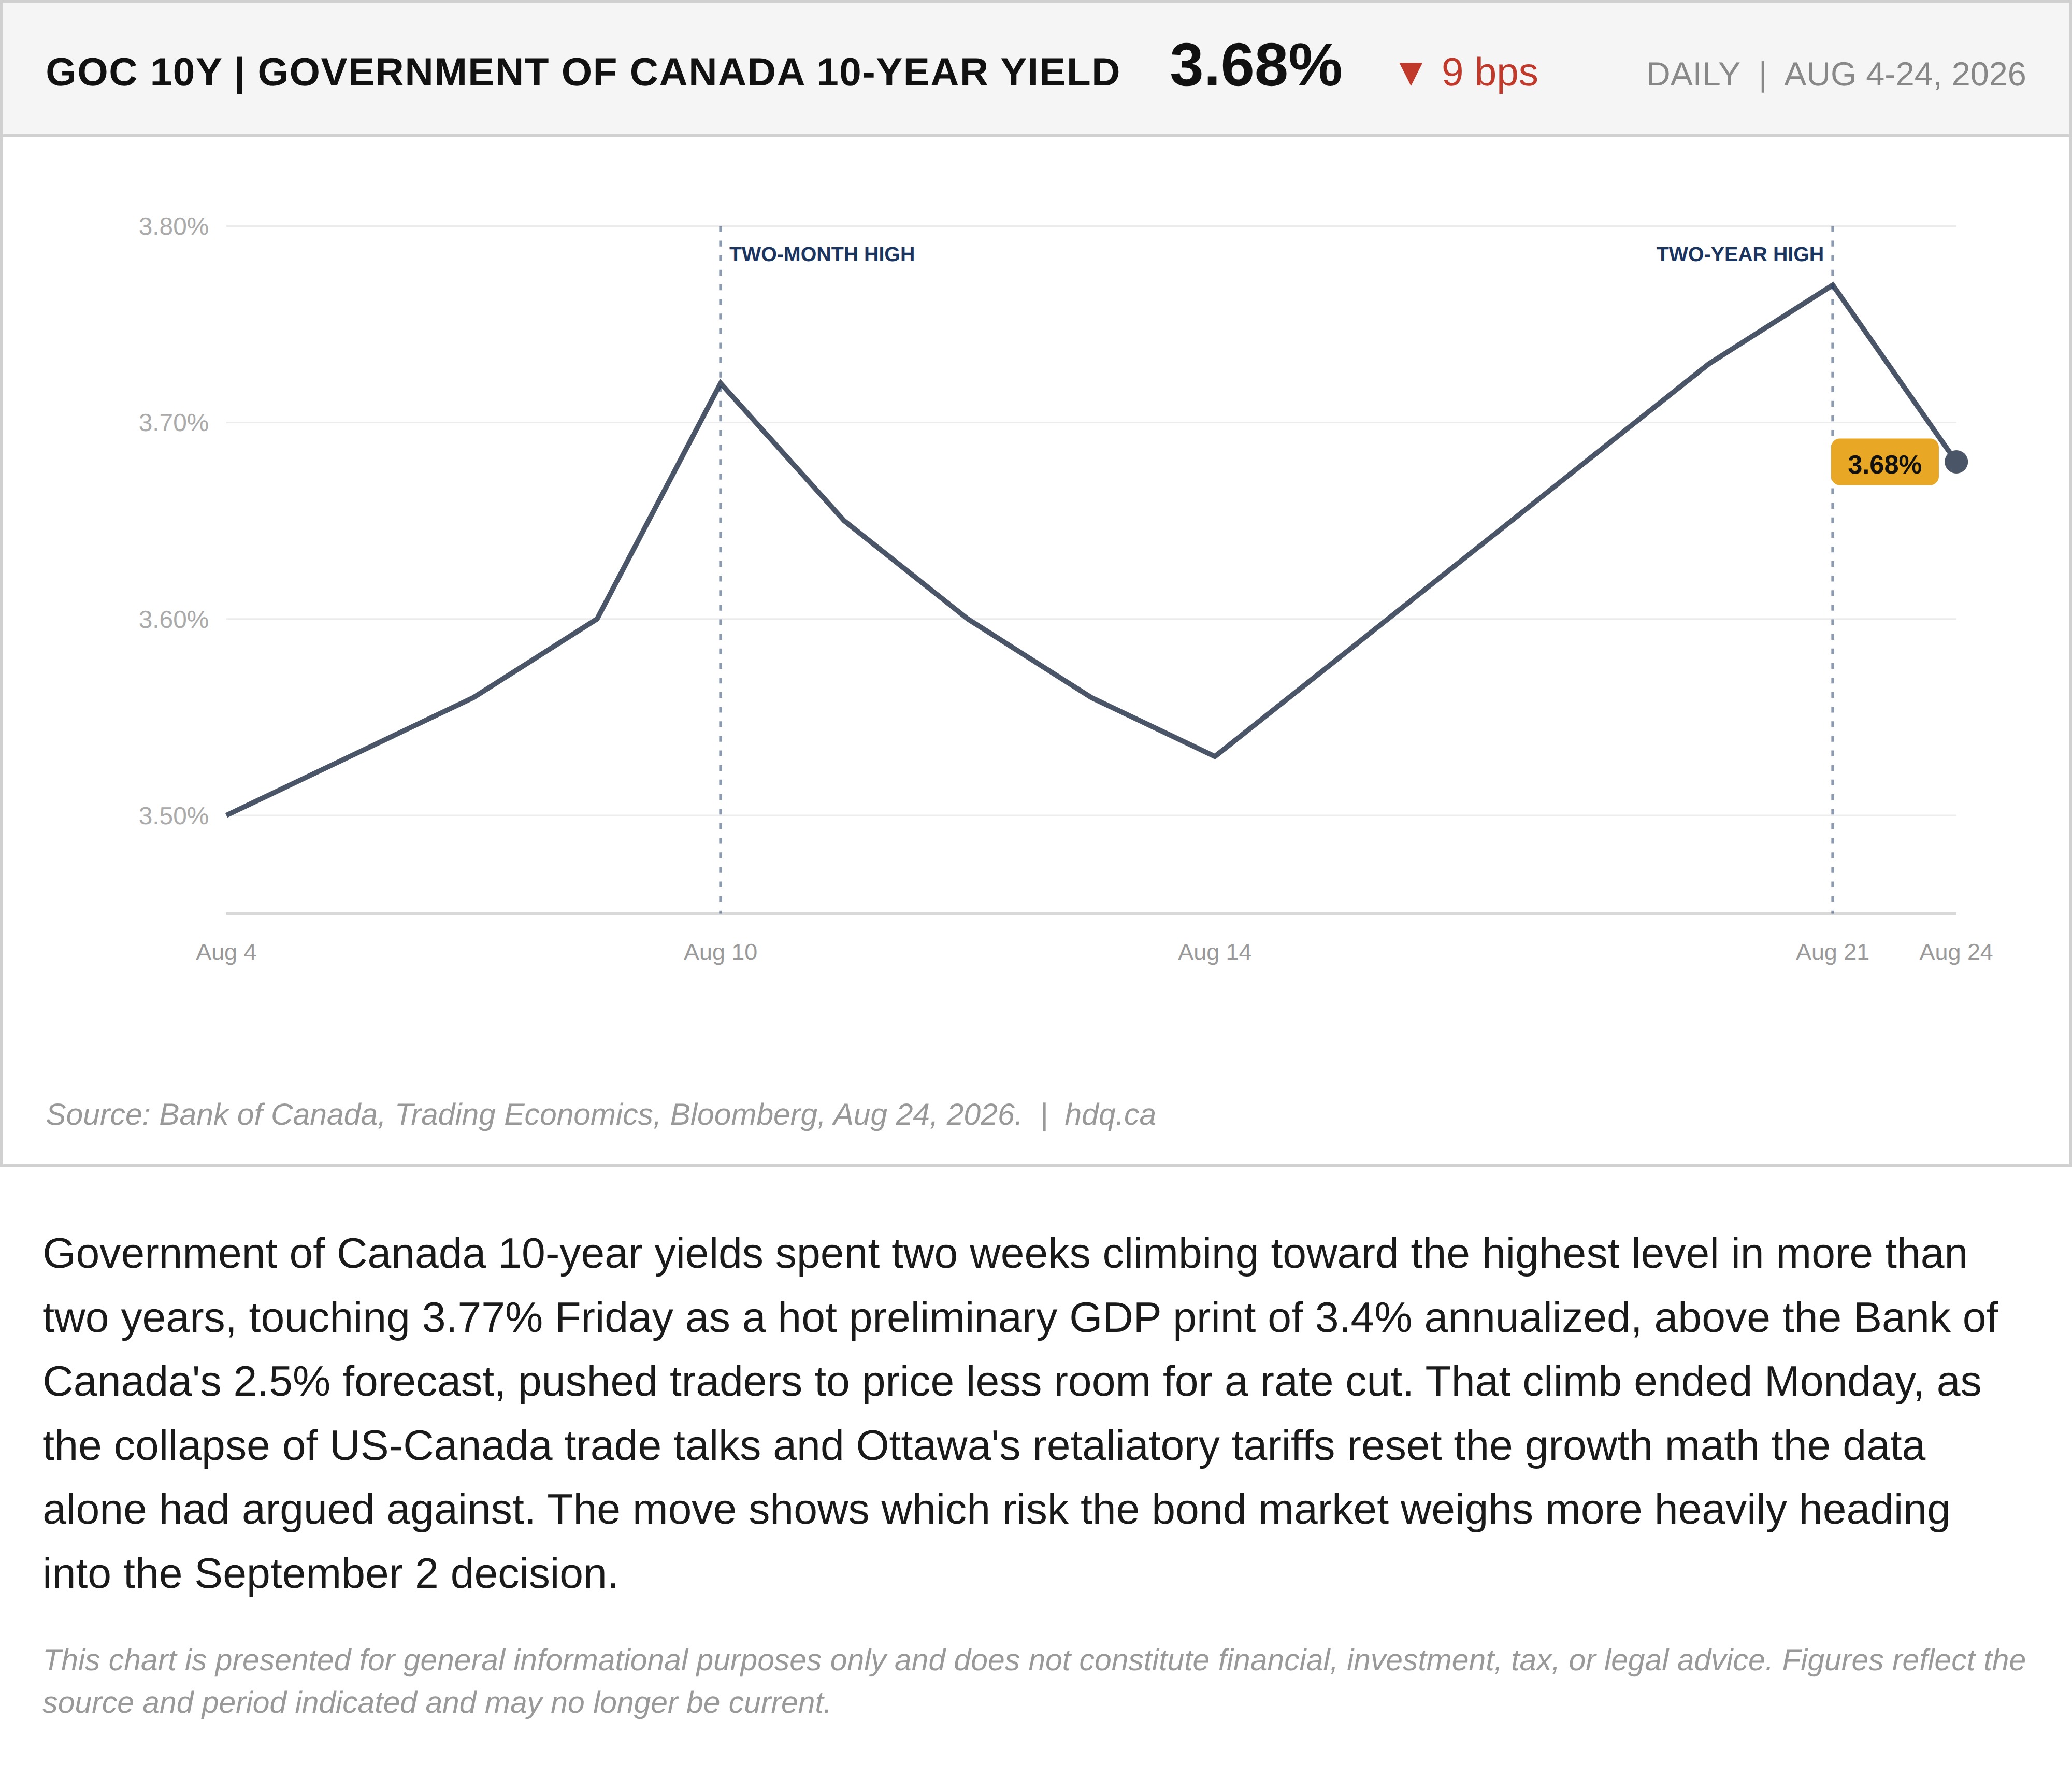
Government of Canada 10-year yields spent two weeks climbing toward the highest level in more than two years, touching 3.77% Friday as a hot preliminary GDP print of 3.4% annualized, above the Bank of Canada's 2.5% forecast, pushed traders to price less room for a rate cut. That climb ended Monday, as the collapse of US-Canada trade talks and Ottawa's retaliatory tariffs reset the growth math the data alone had argued against. The move shows which risk the bond market weighs more heavily heading into the September 2 decision.
This chart is presented for general informational purposes only and does not constitute financial, investment, tax, or legal advice. Figures reflect the source and period indicated and may no longer be current.
Related charts
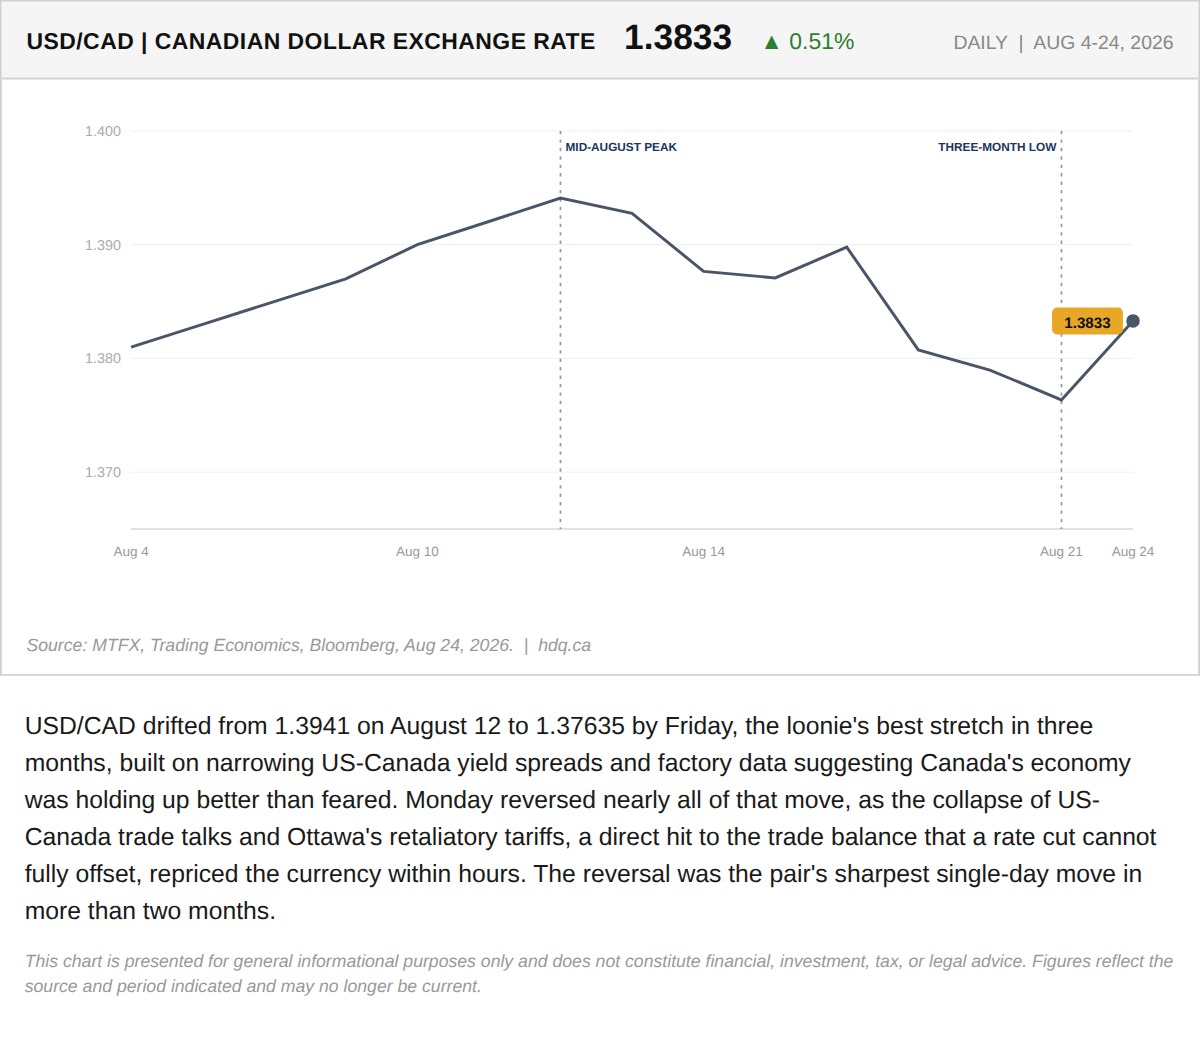
USD/CAD drifted from 1.3941 on August 12 to 1.37635 by Friday, the loonie's best stretch in three months, built on narrowing US-Canada…
The Loonie's Three-Month Rally Unwound in One Trading Day
August 24, 2026
View chart & download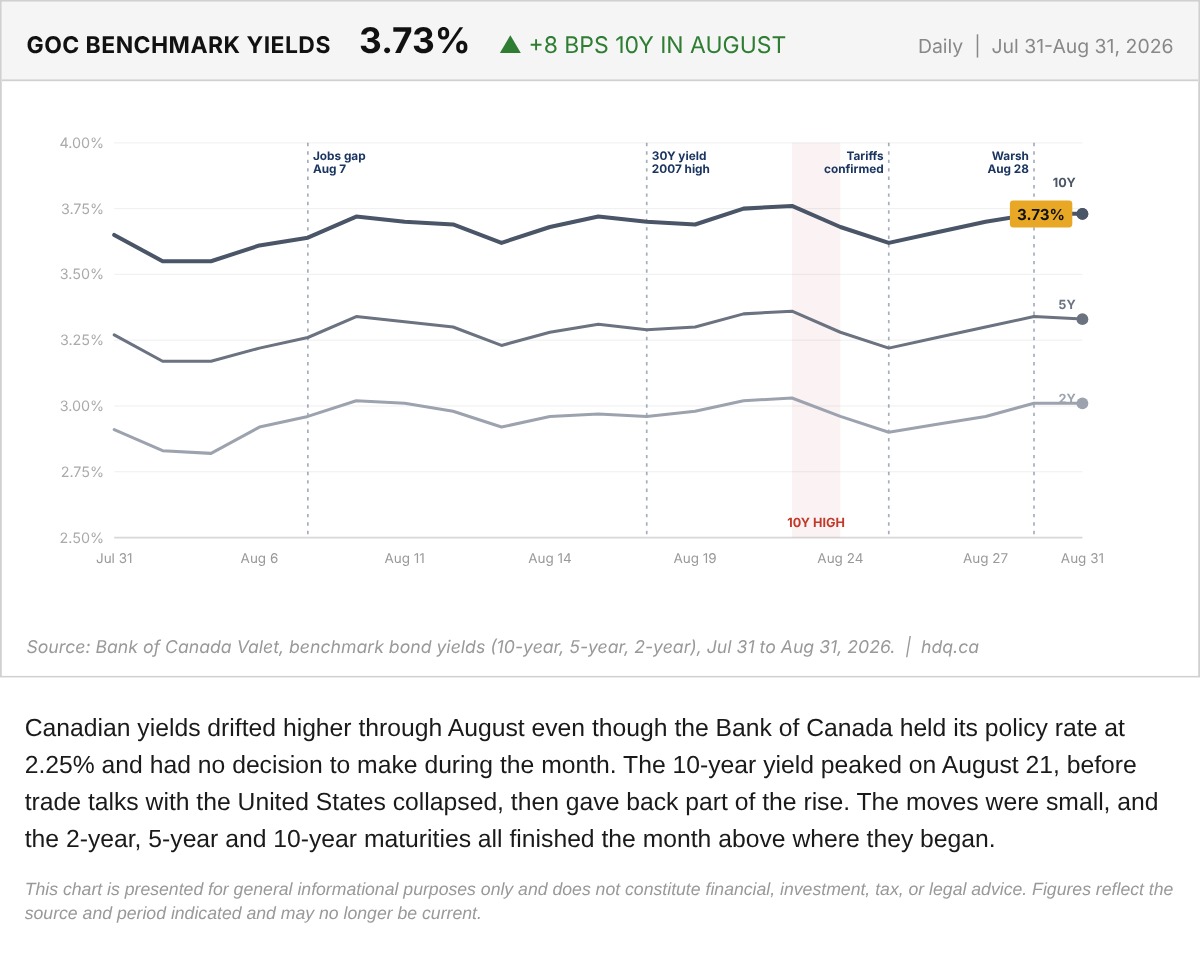
Canadian yields drifted higher through August even though the Bank of Canada held its policy rate at 2.25% and had no decision to make during the month.
Government of Canada Benchmark Yields, August 2026
August 31, 2026
View chart & download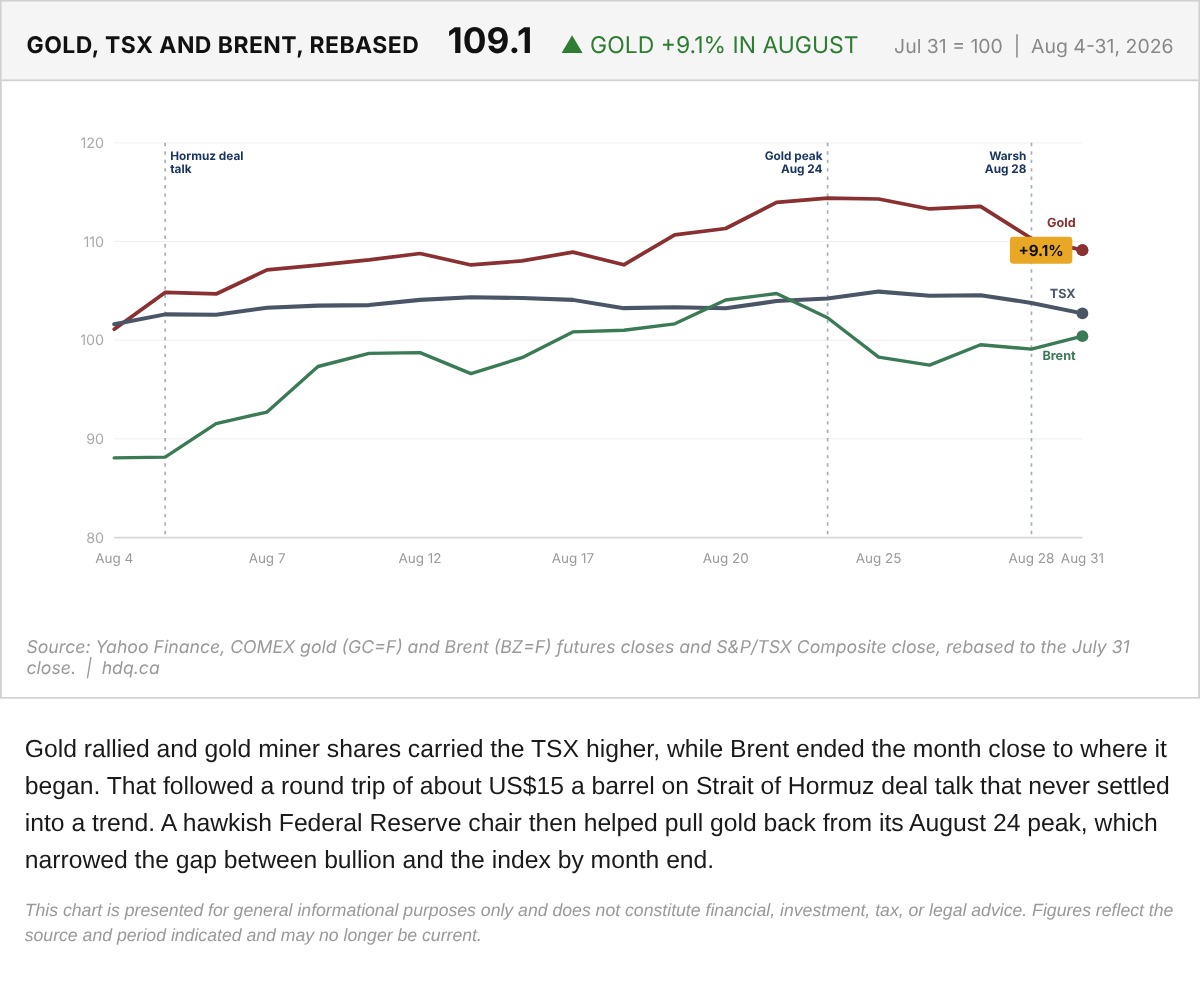
Gold rallied and gold miner shares carried the TSX higher, while Brent ended the month close to where it began.
Gold, TSX and Brent Rebased to the July 31 Close
August 31, 2026
View chart & download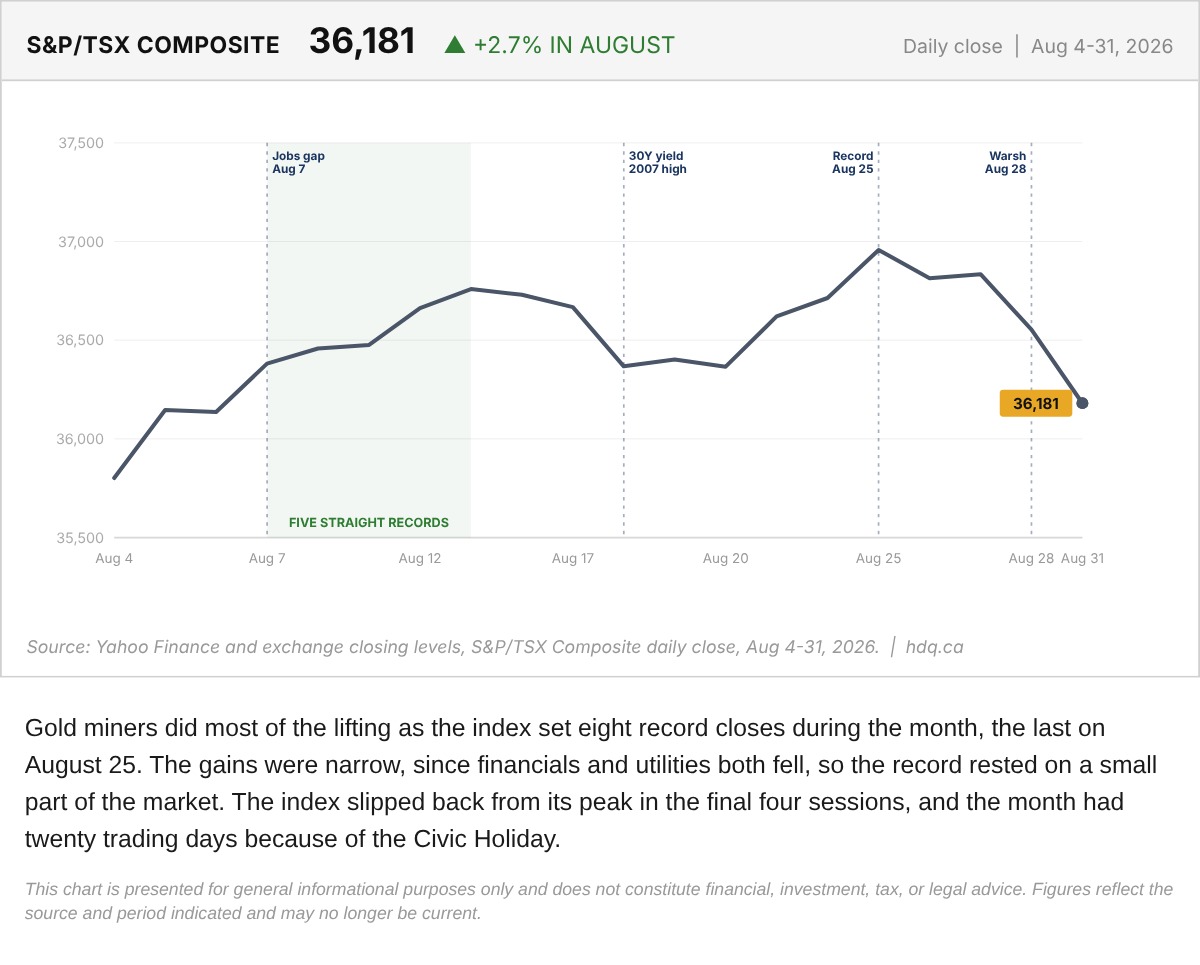
Gold miners did most of the lifting as the index set eight record closes during the month, the last on August 25.
S&P/TSX Composite Daily Close Through August 2026
August 31, 2026
View chart & download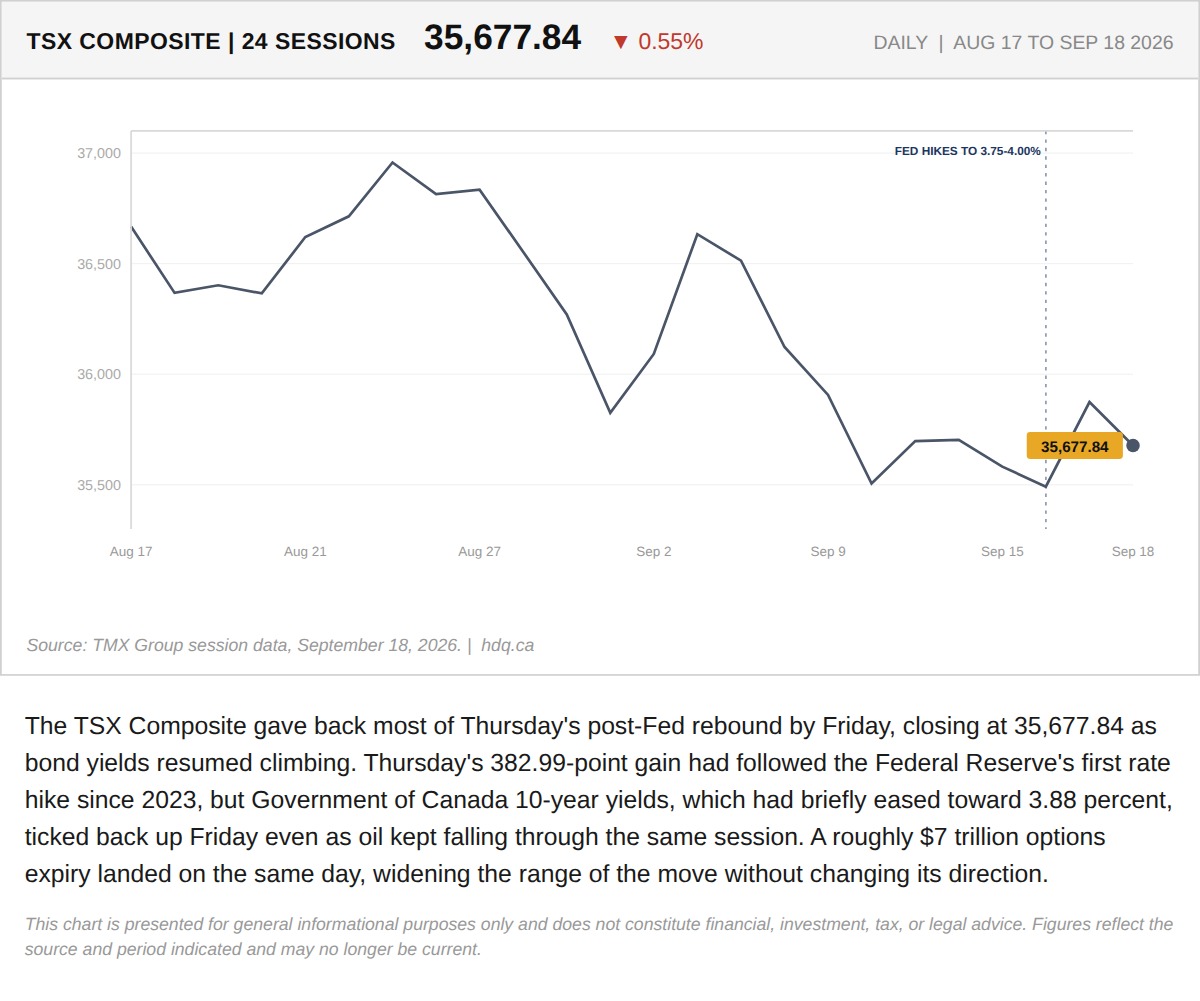
The TSX Composite gave back most of Thursday's post-Fed rebound by Friday, closing at 35,677.84 as bond yields resumed climbing.
TSX Gives Back Post-Fed Rally as Bond Yields Resume Climbing
September 18, 2026
View chart & download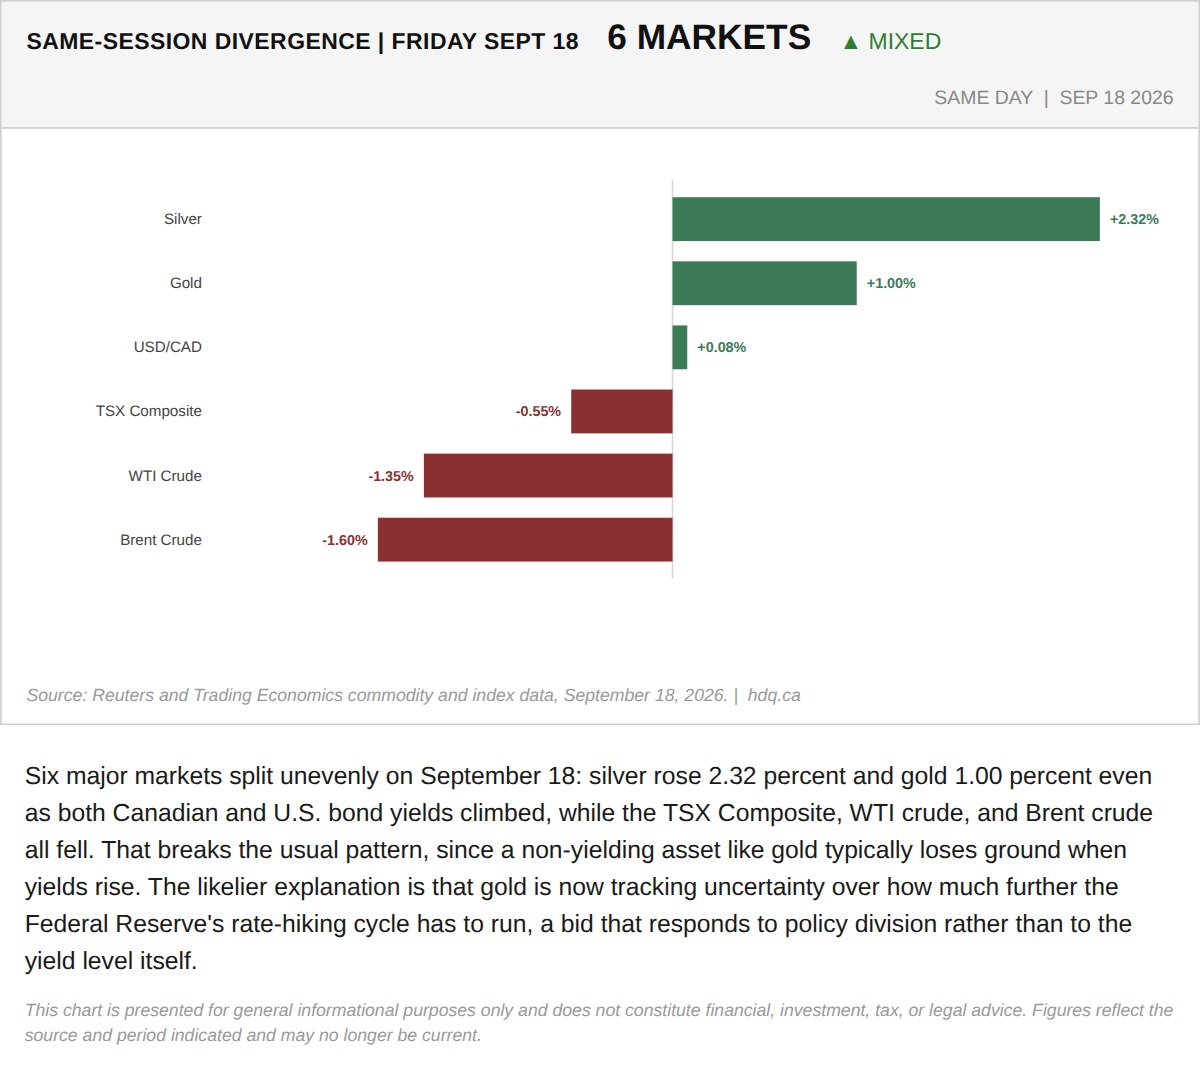
Six major markets split unevenly on September 18: silver rose 2.32 percent and gold 1.00 percent even as both Canadian and U.S.
Gold and Silver Rise With Yields, Breaking the Usual Pattern
September 18, 2026
View chart & download