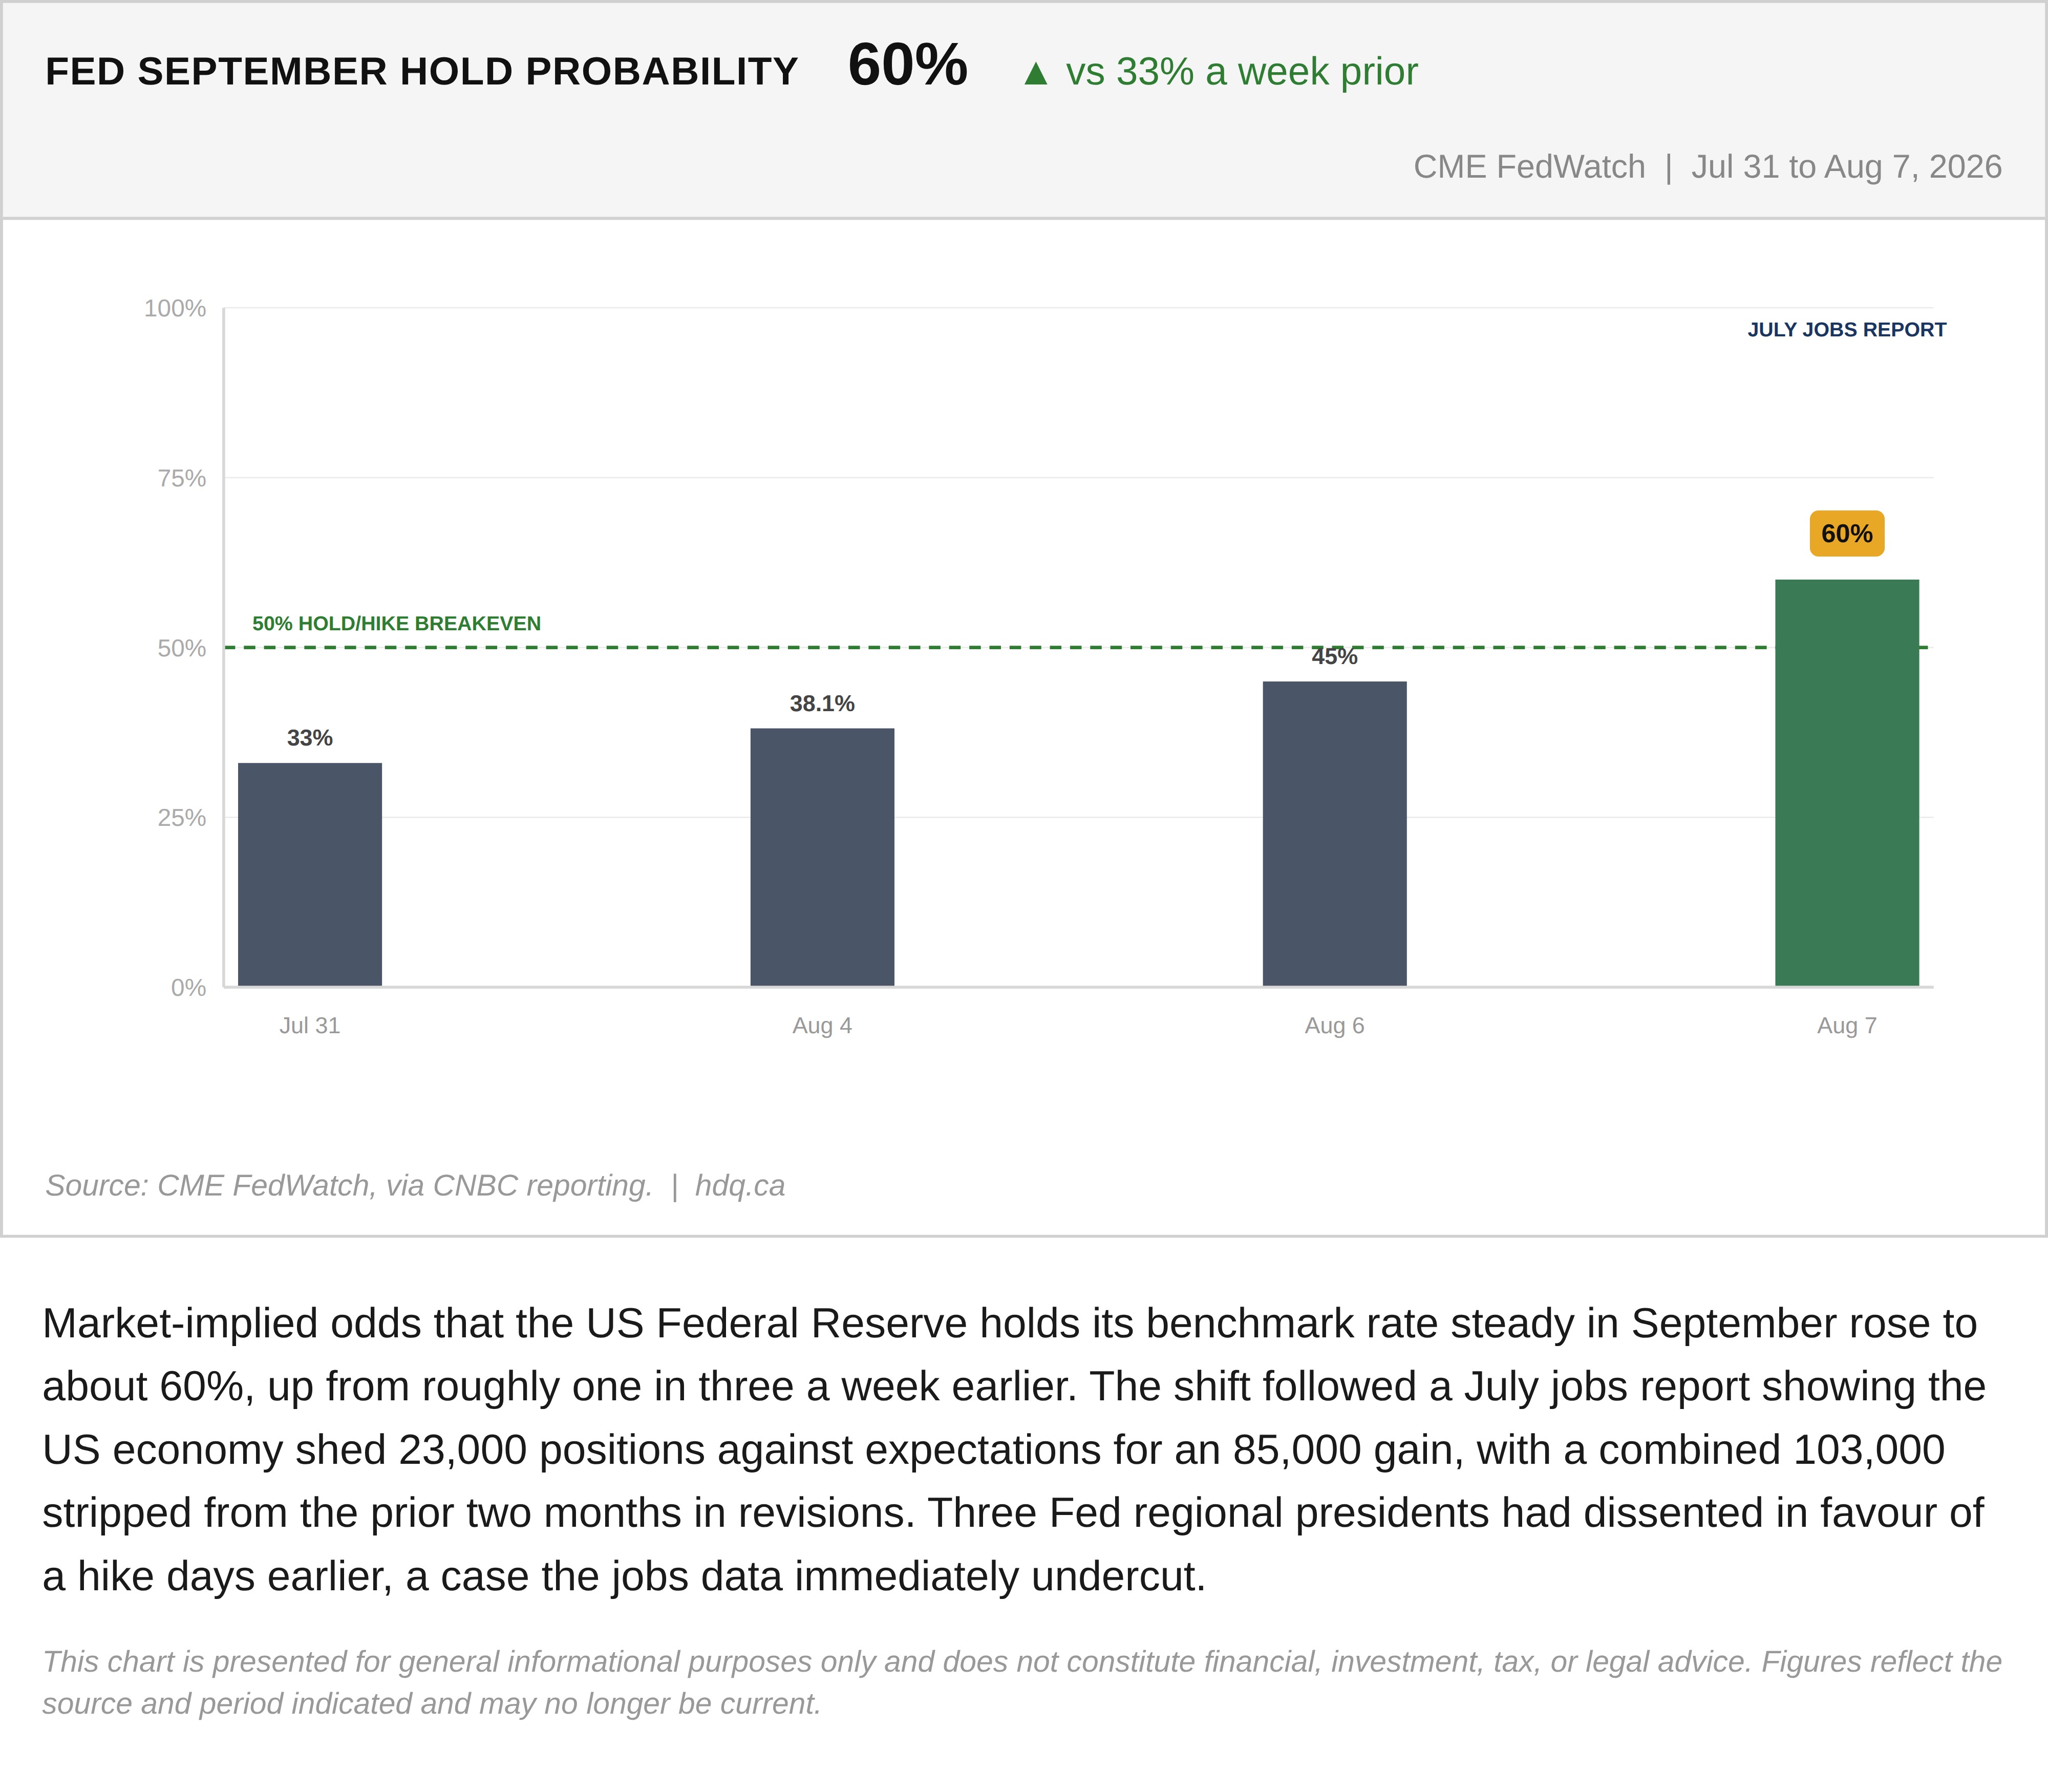
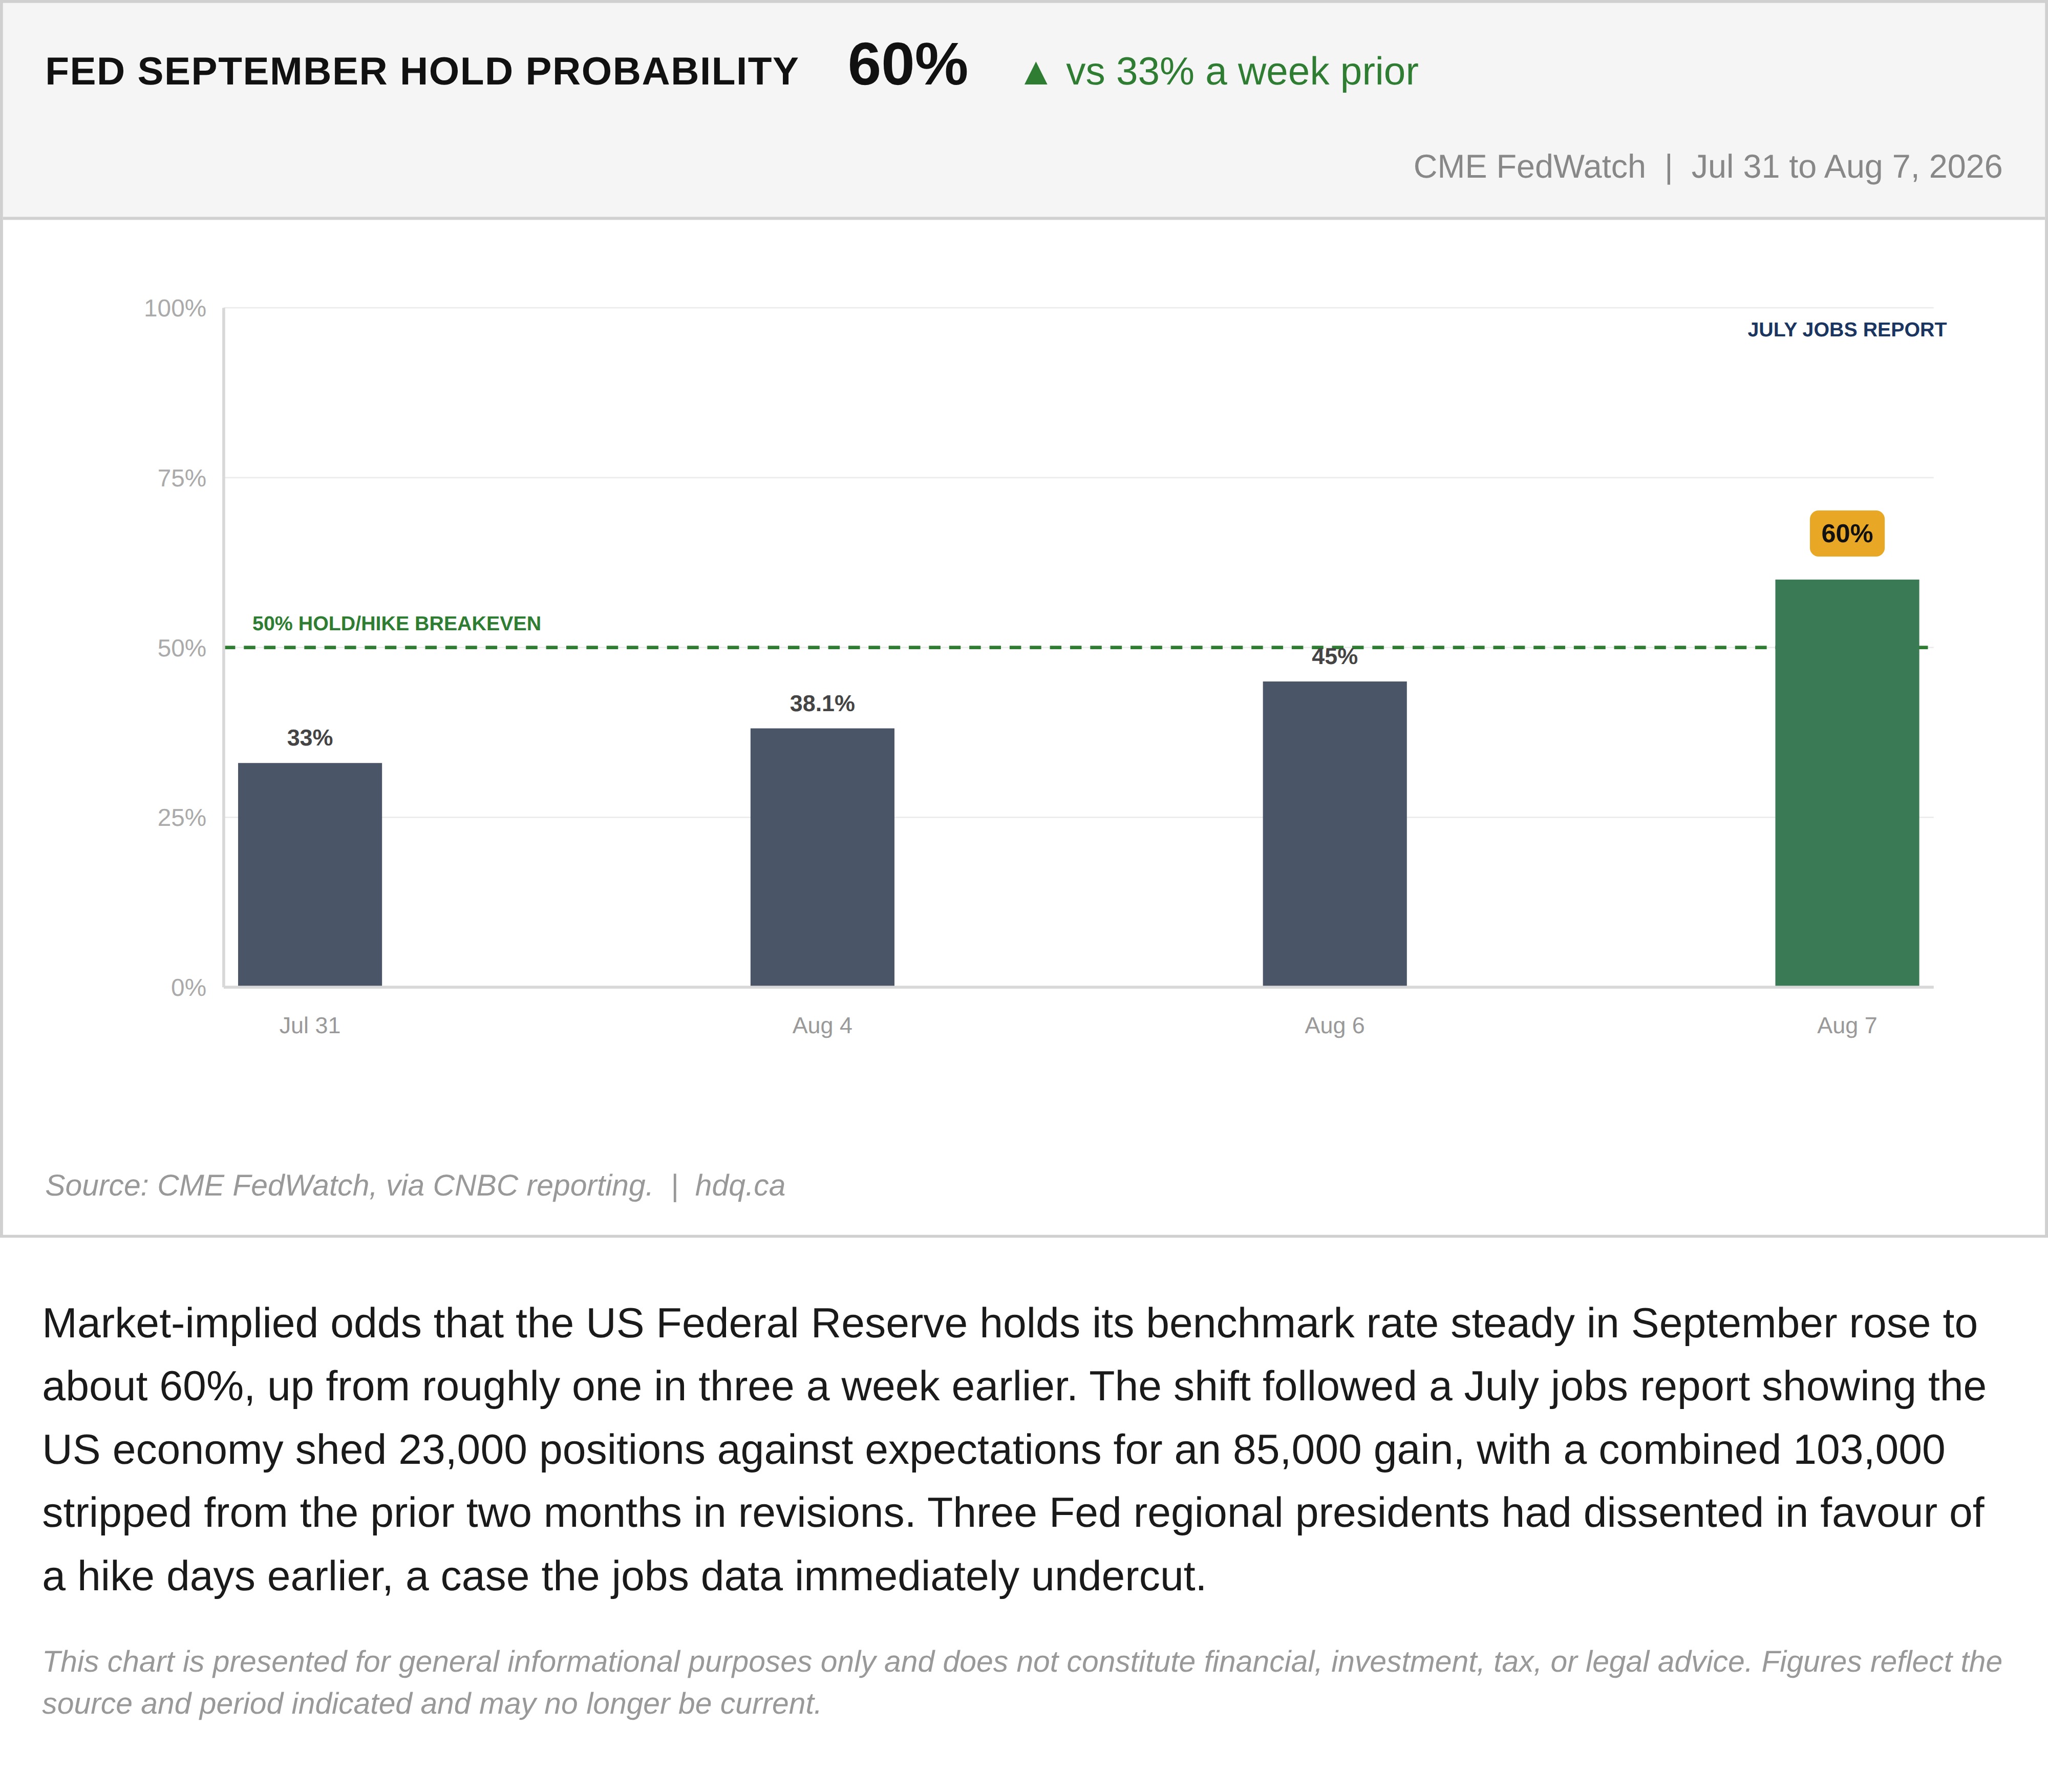
Market-implied odds that the US Federal Reserve holds its benchmark rate steady in September rose to about 60%, up from roughly one in three a week earlier. The shift followed a July jobs report showing the US economy shed 23,000 positions against expectations for an 85,000 gain, with a combined 103,000 stripped from the prior two months in revisions. Three Fed regional presidents had dissented in favour of a hike days earlier, a case the jobs data immediately undercut.
This chart is presented for general informational purposes only and does not constitute financial, investment, tax, or legal advice. Figures reflect the source and period indicated and may no longer be current.
Related charts
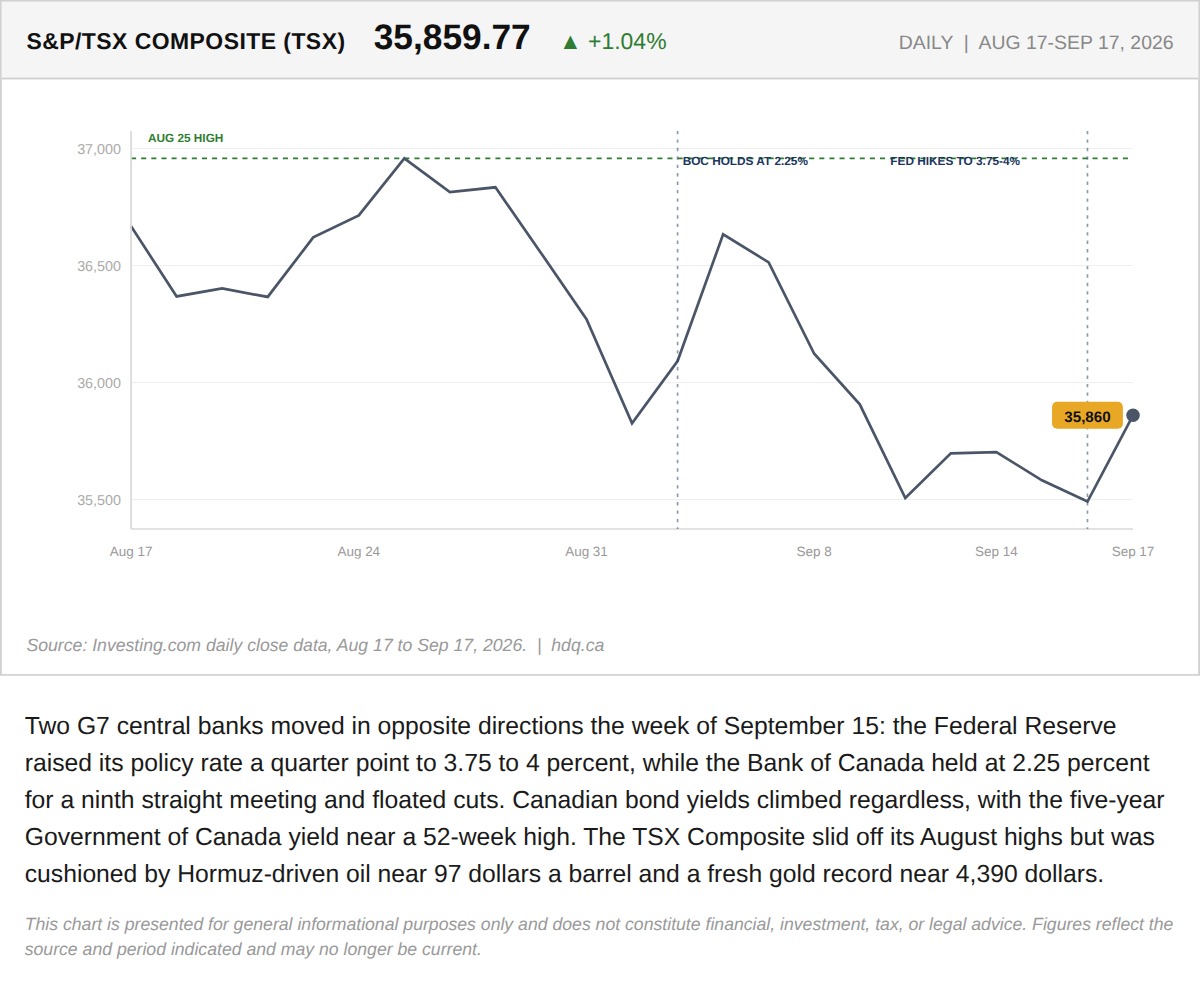
Two G7 central banks moved in opposite directions the week of September 15: the Federal Reserve raised its policy rate a quarter point to…
The Week the Bank of Canada's Own Rate Stopped Setting Canadian Borrowing Costs
September 19, 2026
View chart & download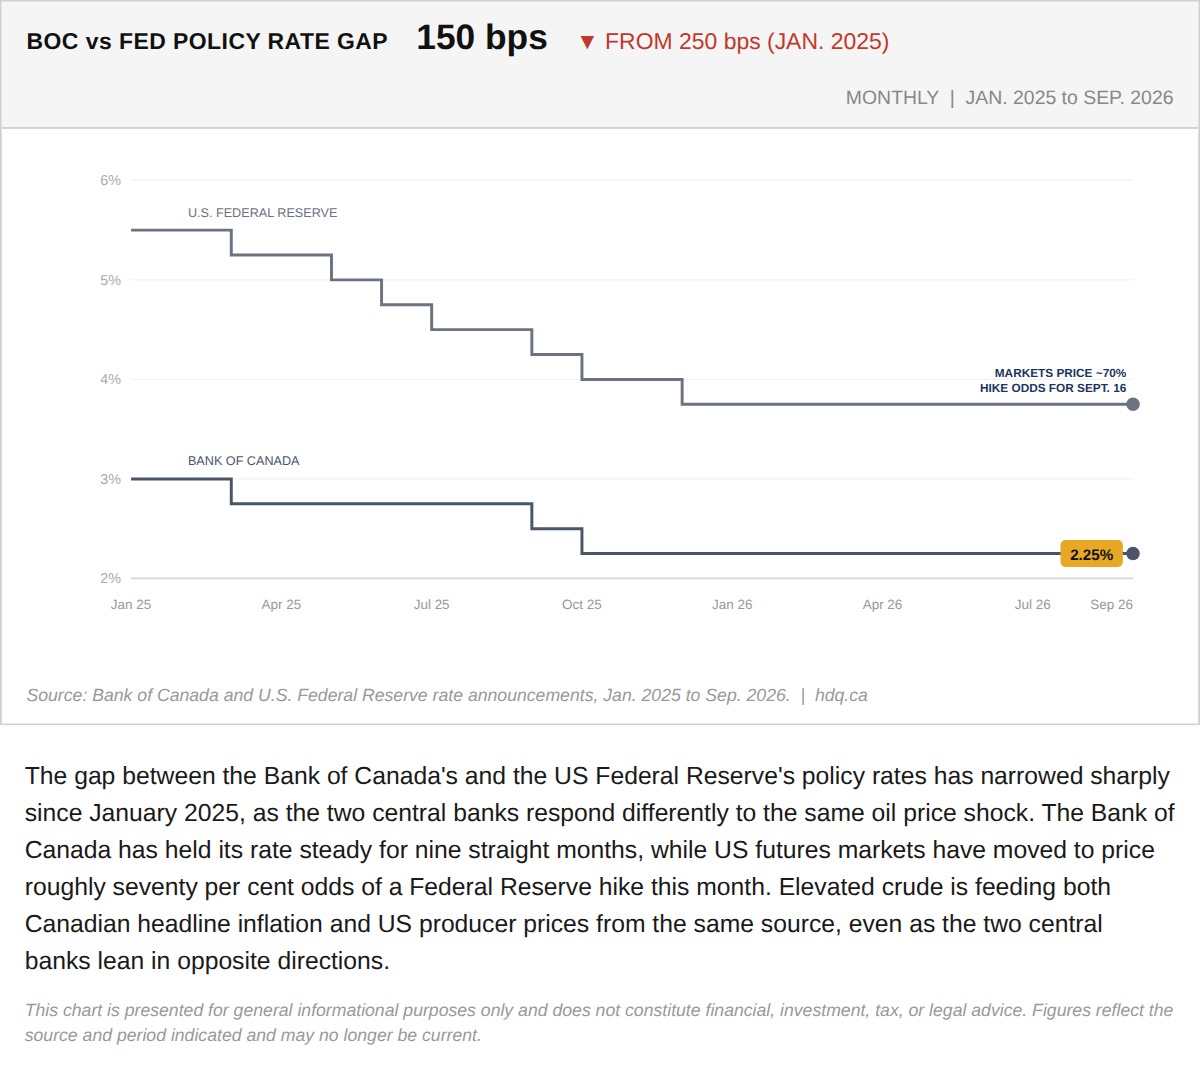
The gap between the Bank of Canada's and the US Federal Reserve's policy rates has narrowed sharply since January 2025, as the two central…
The BoC and the Fed Have Stopped Moving Together, and Oil Is the Reason Why
September 11, 2026
View chart & download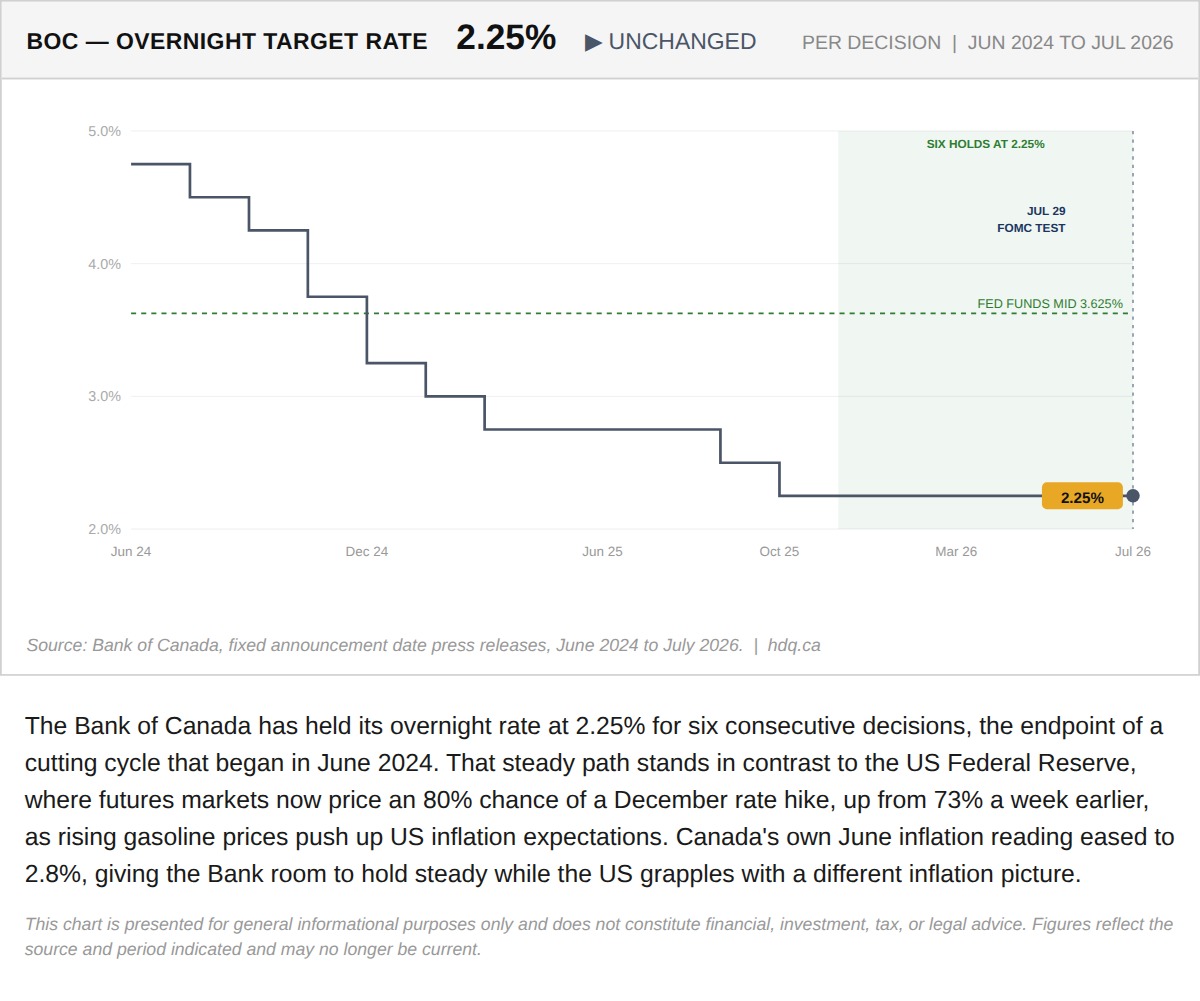
The Bank of Canada has held its overnight rate at 2.25% for six consecutive decisions, the endpoint of a cutting cycle that began in June 2024.
Fed Hike Odds Jumped to 80% in a Week. The Bank of Canada's Math Has Not Changed
July 21, 2026
View chart & download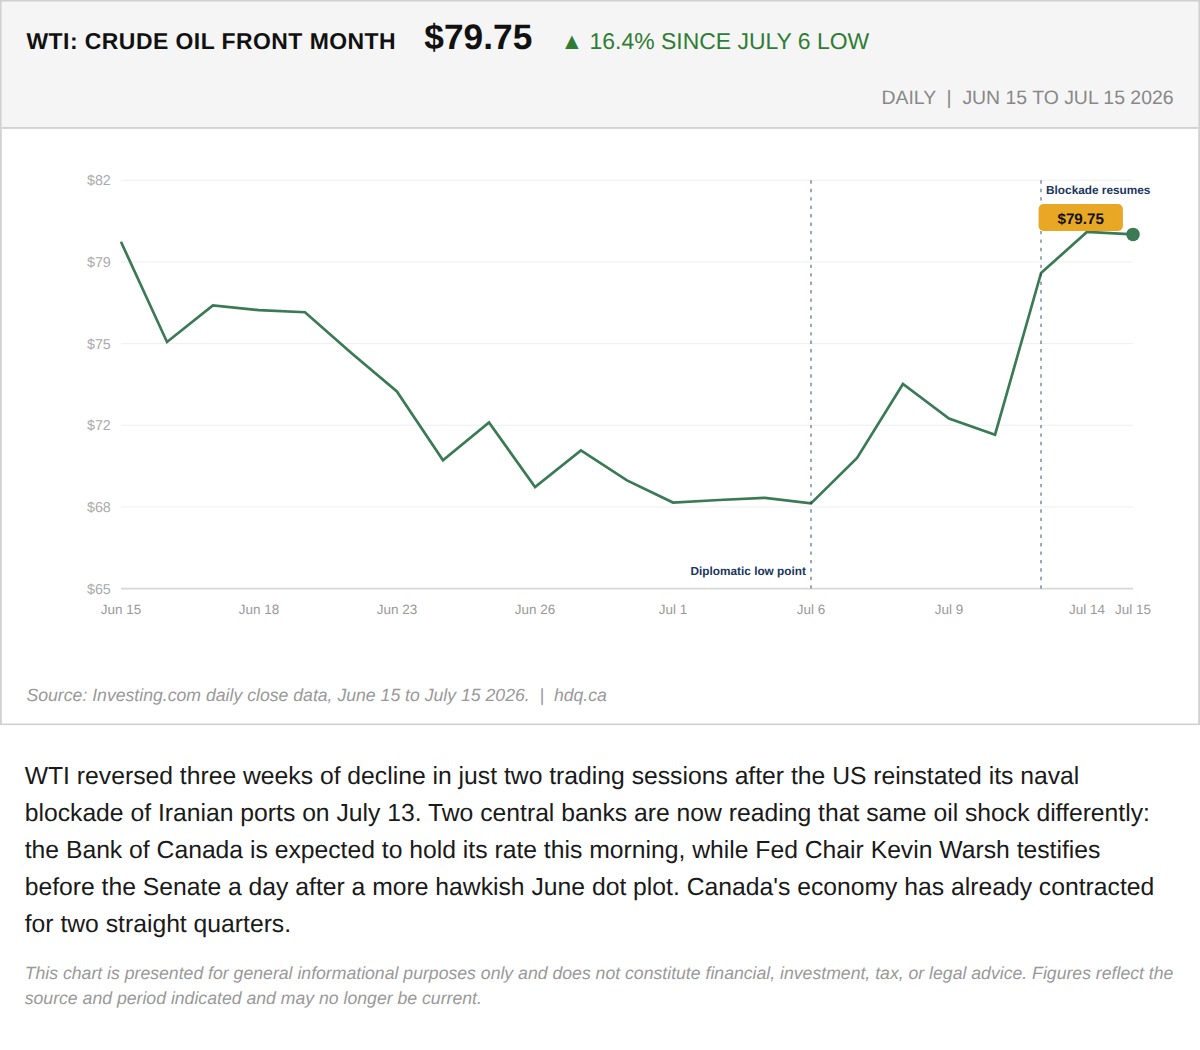
WTI reversed three weeks of decline in just two trading sessions after the US reinstated its naval blockade of Iranian ports on July 13.
July 15, 2026
View chart & download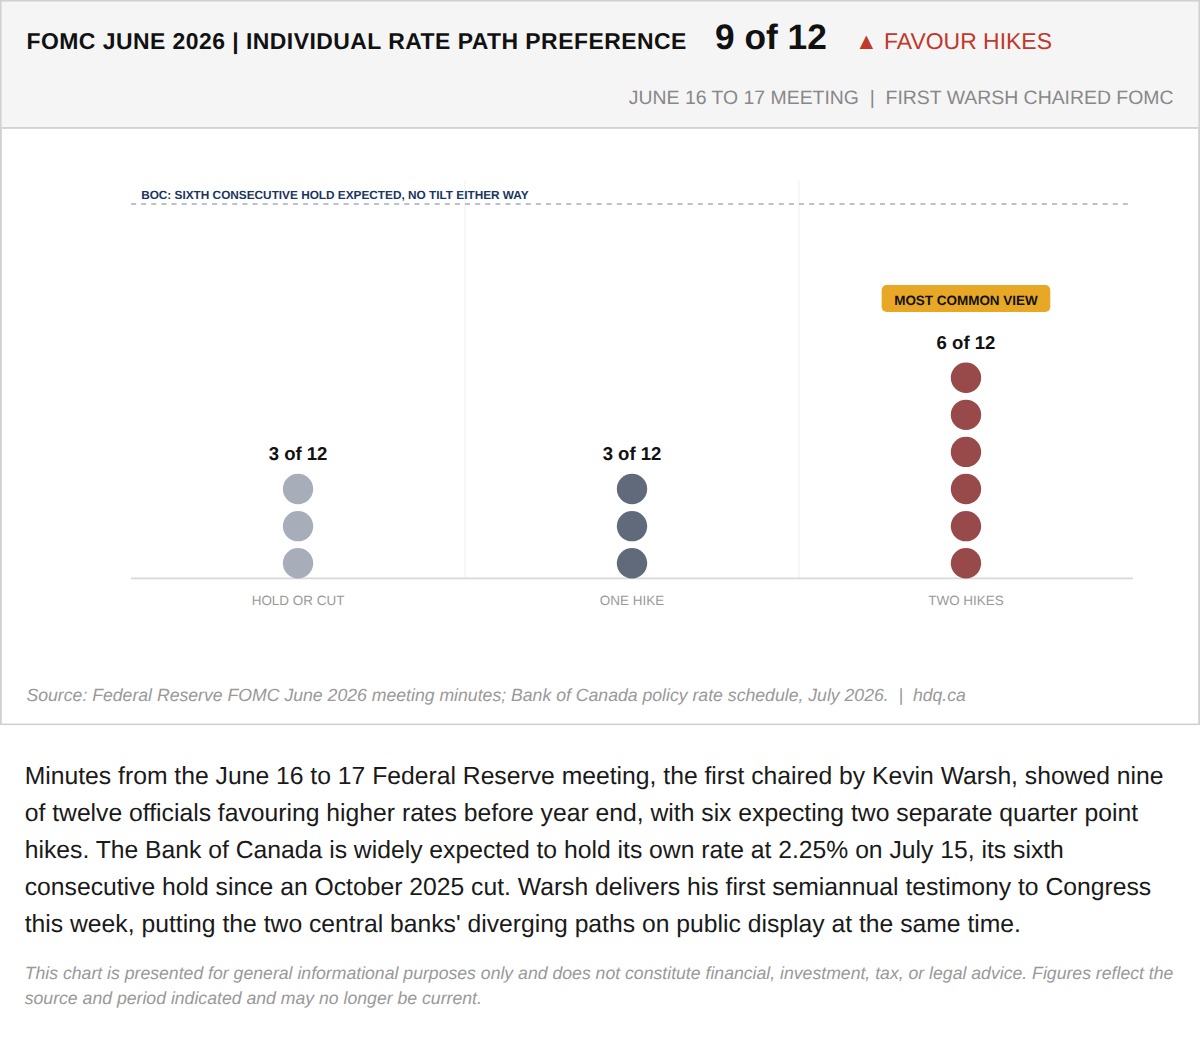
Minutes from the June 16 to 17 Federal Reserve meeting, the first chaired by Kevin Warsh, showed nine of twelve officials favouring higher…
July 13, 2026
View chart & download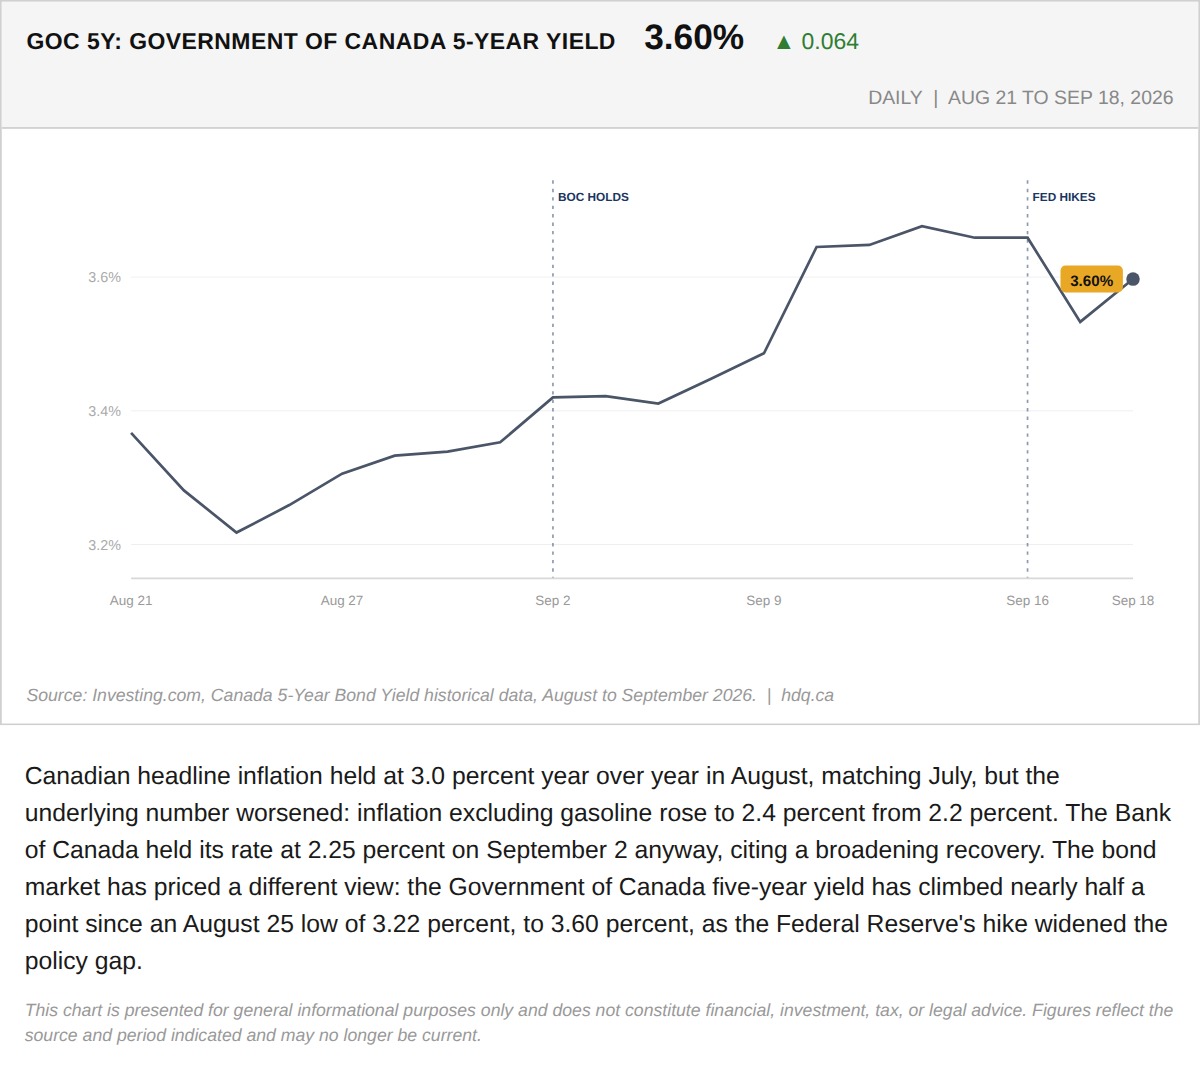
Canadian headline inflation held at 3.0 percent year over year in August, matching July, but the underlying number worsened: inflation…
The Bond Market Already Moved Before the Bank of Canada Has To
September 21, 2026
View chart & download