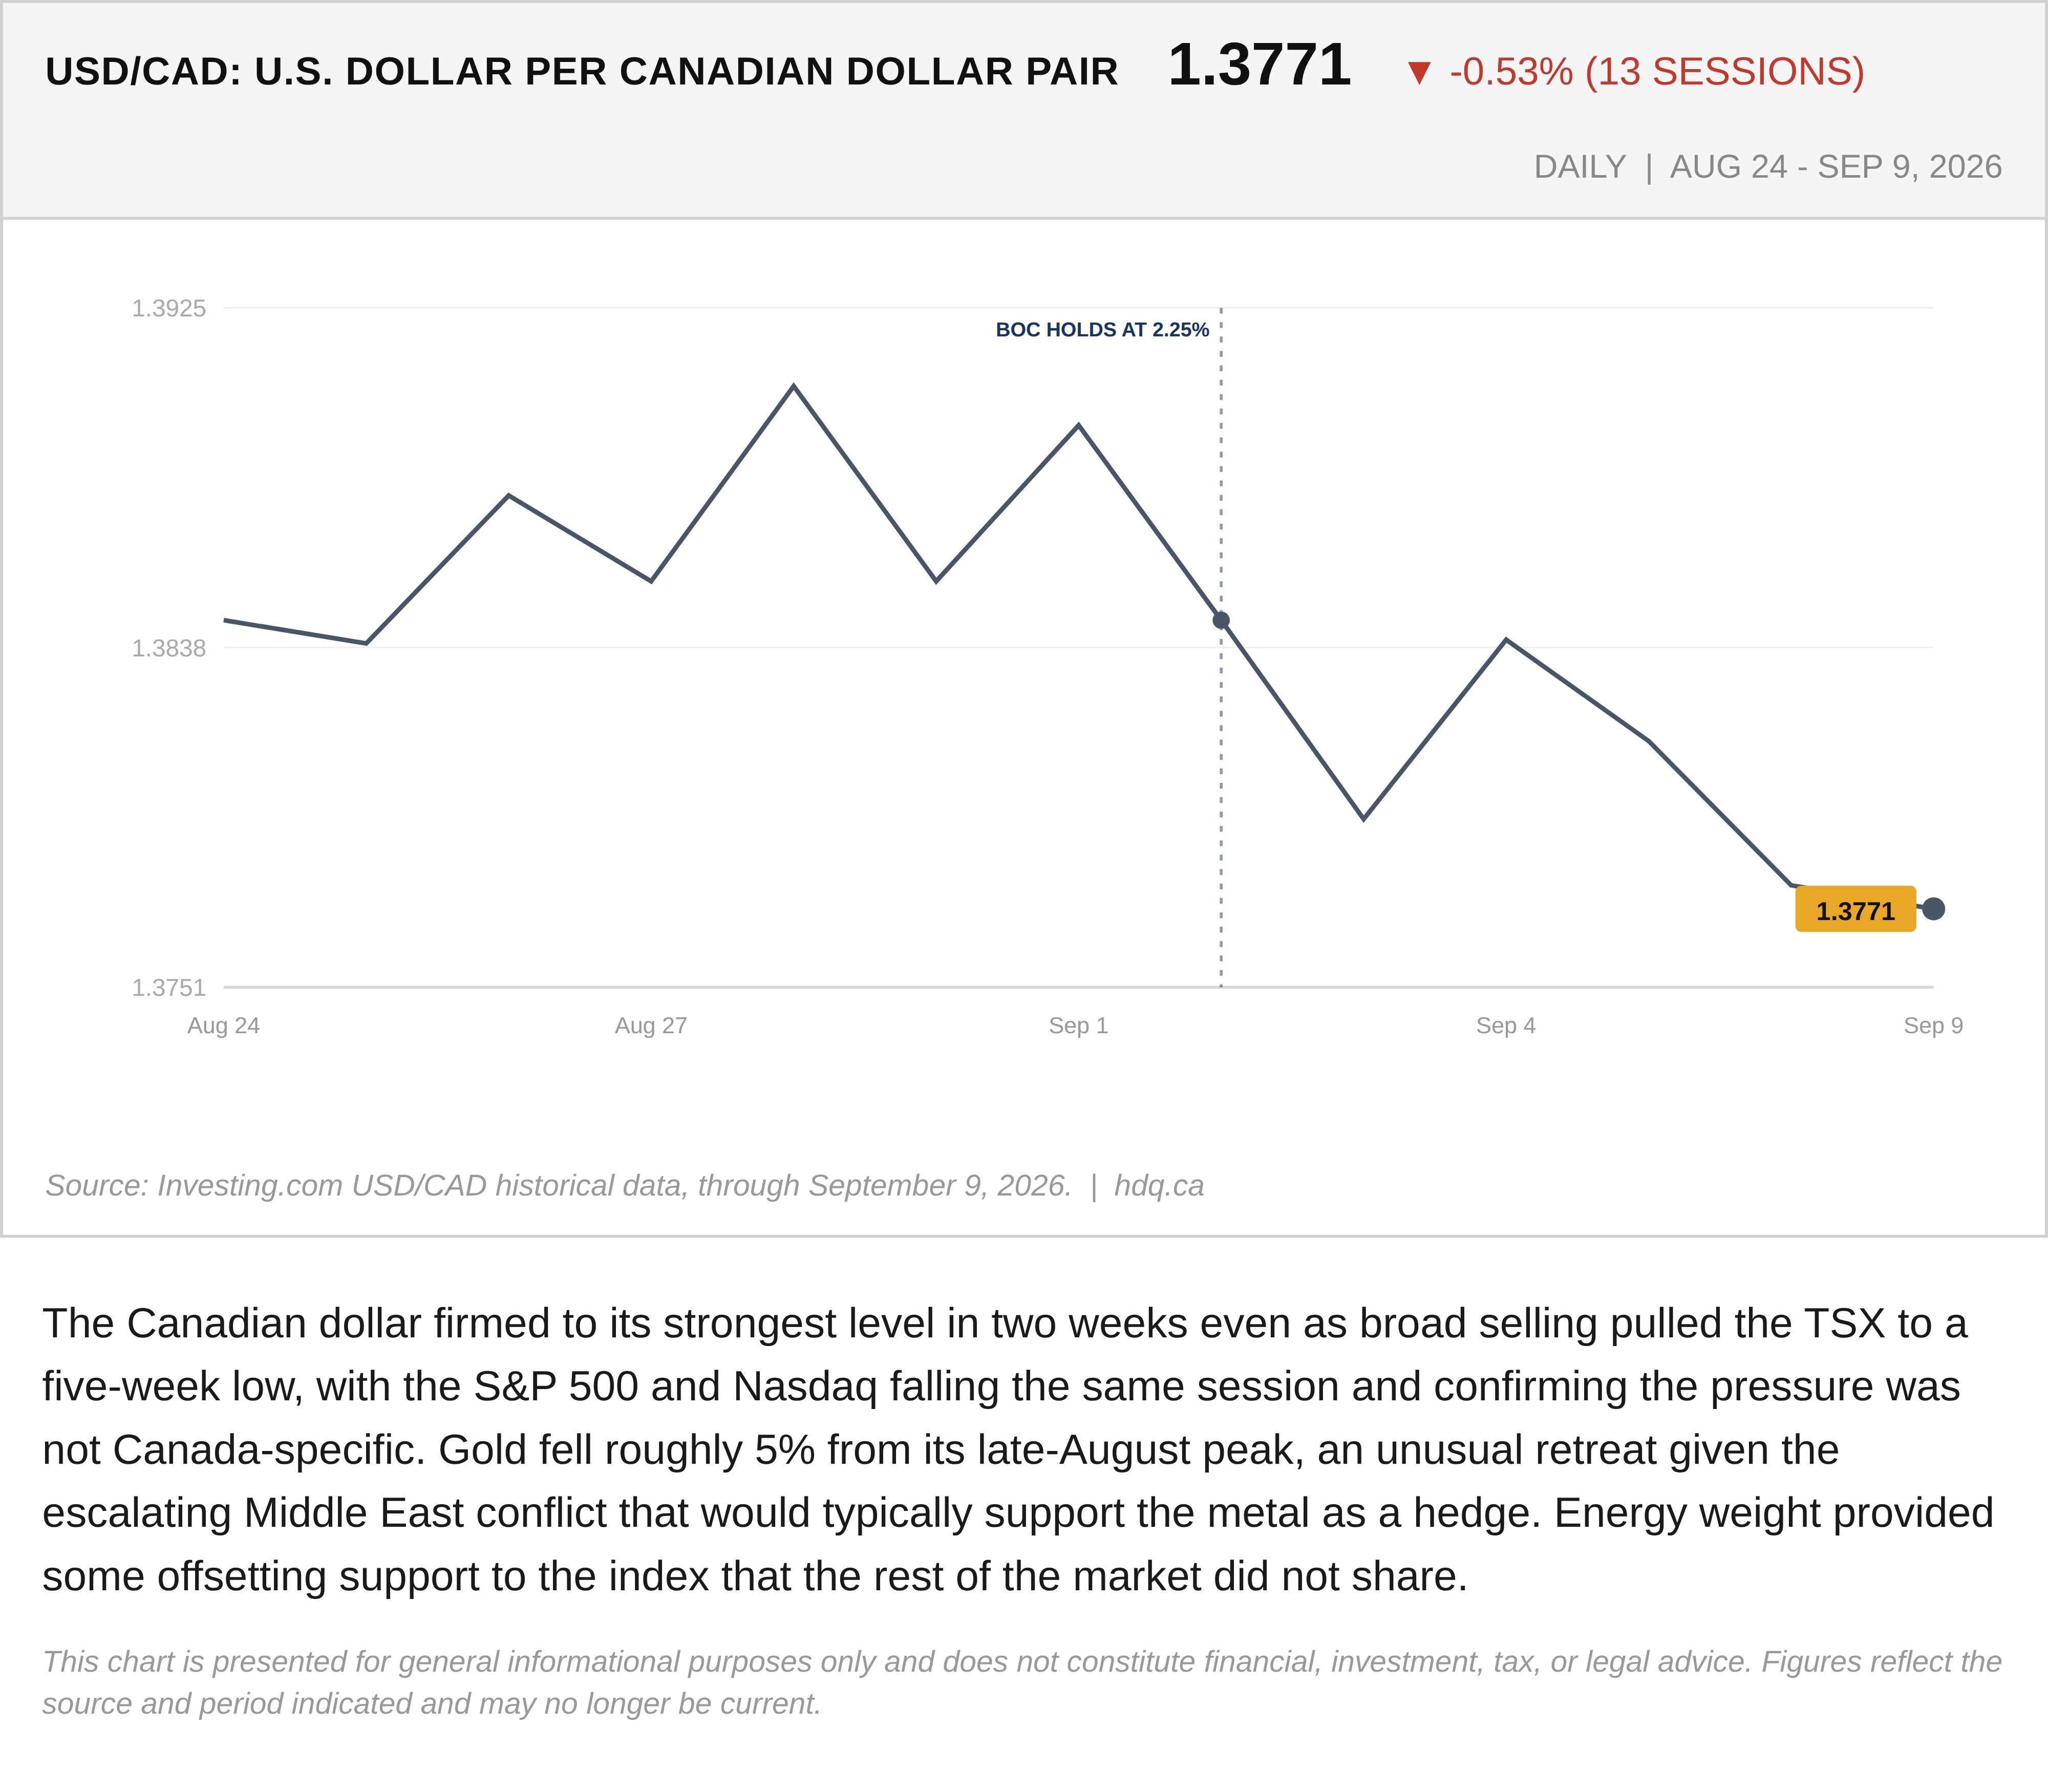
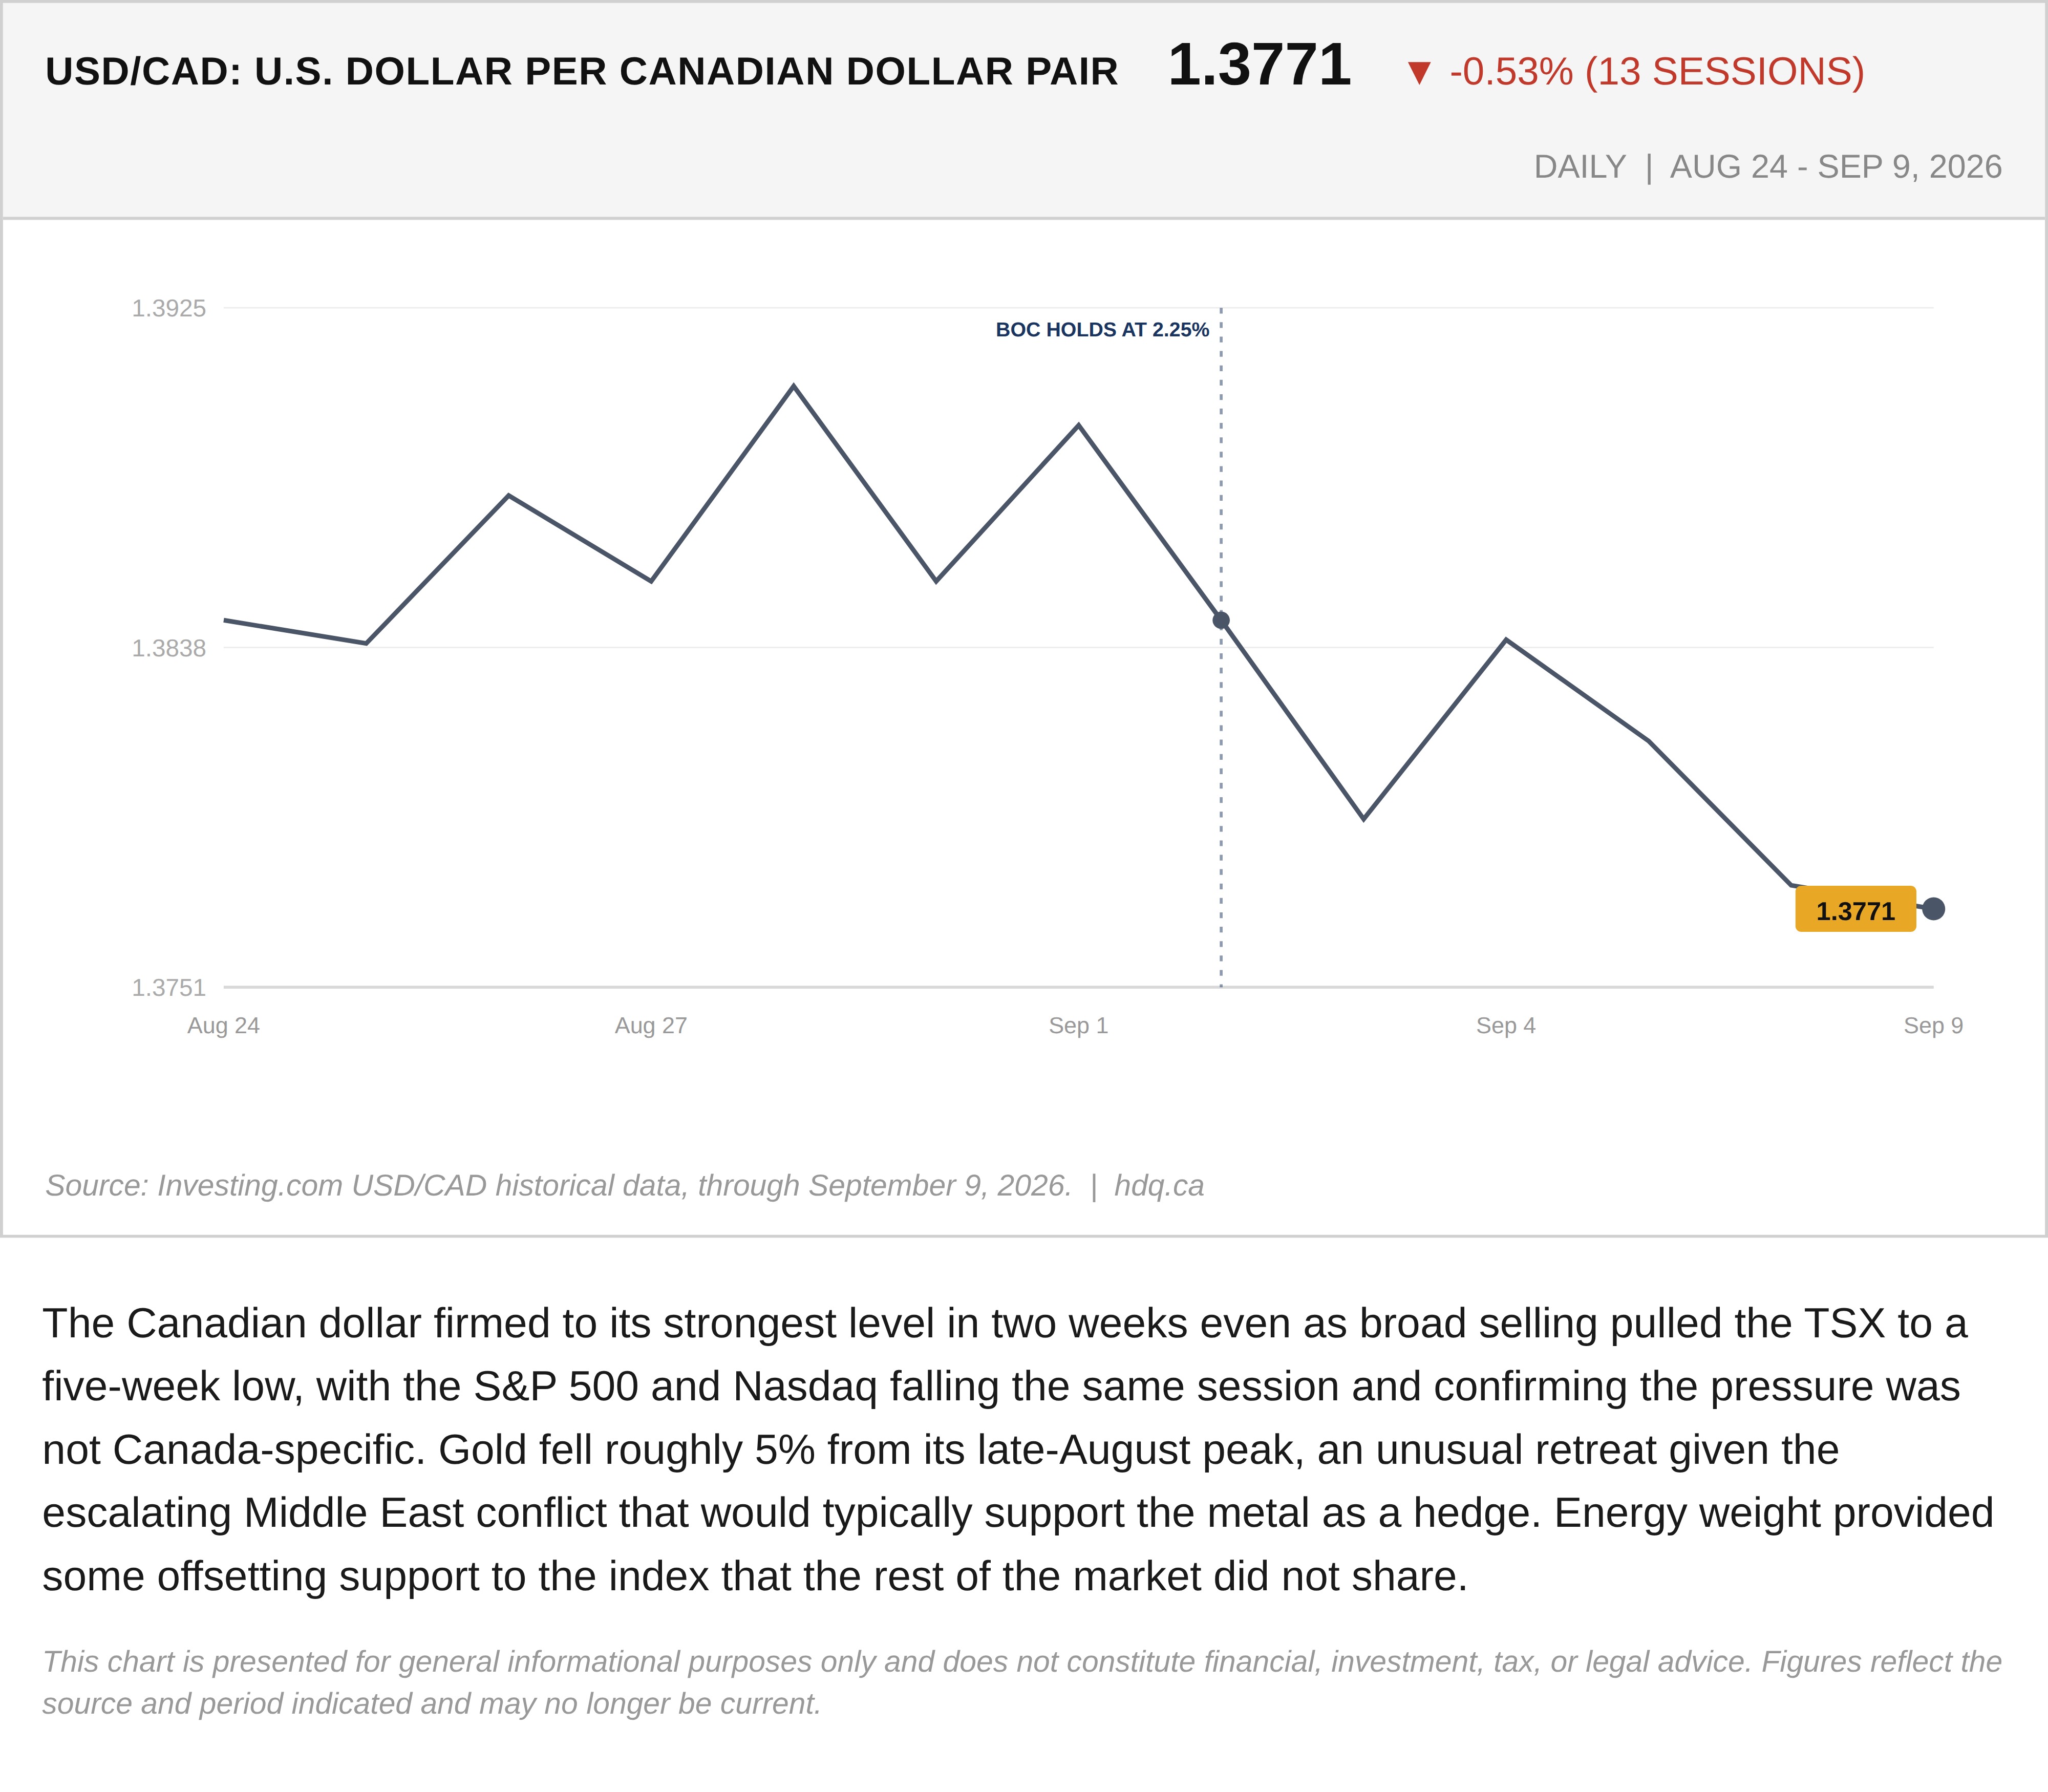
The Canadian dollar firmed to its strongest level in two weeks even as broad selling pulled the TSX to a five-week low, with the S&P 500 and Nasdaq falling the same session and confirming the pressure was not Canada-specific. Gold fell roughly 5% from its late-August peak, an unusual retreat given the escalating Middle East conflict that would typically support the metal as a hedge. Energy weight provided some offsetting support to the index that the rest of the market did not share.
This chart is presented for general informational purposes only and does not constitute financial, investment, tax, or legal advice. Figures reflect the source and period indicated and may no longer be current.
Related charts
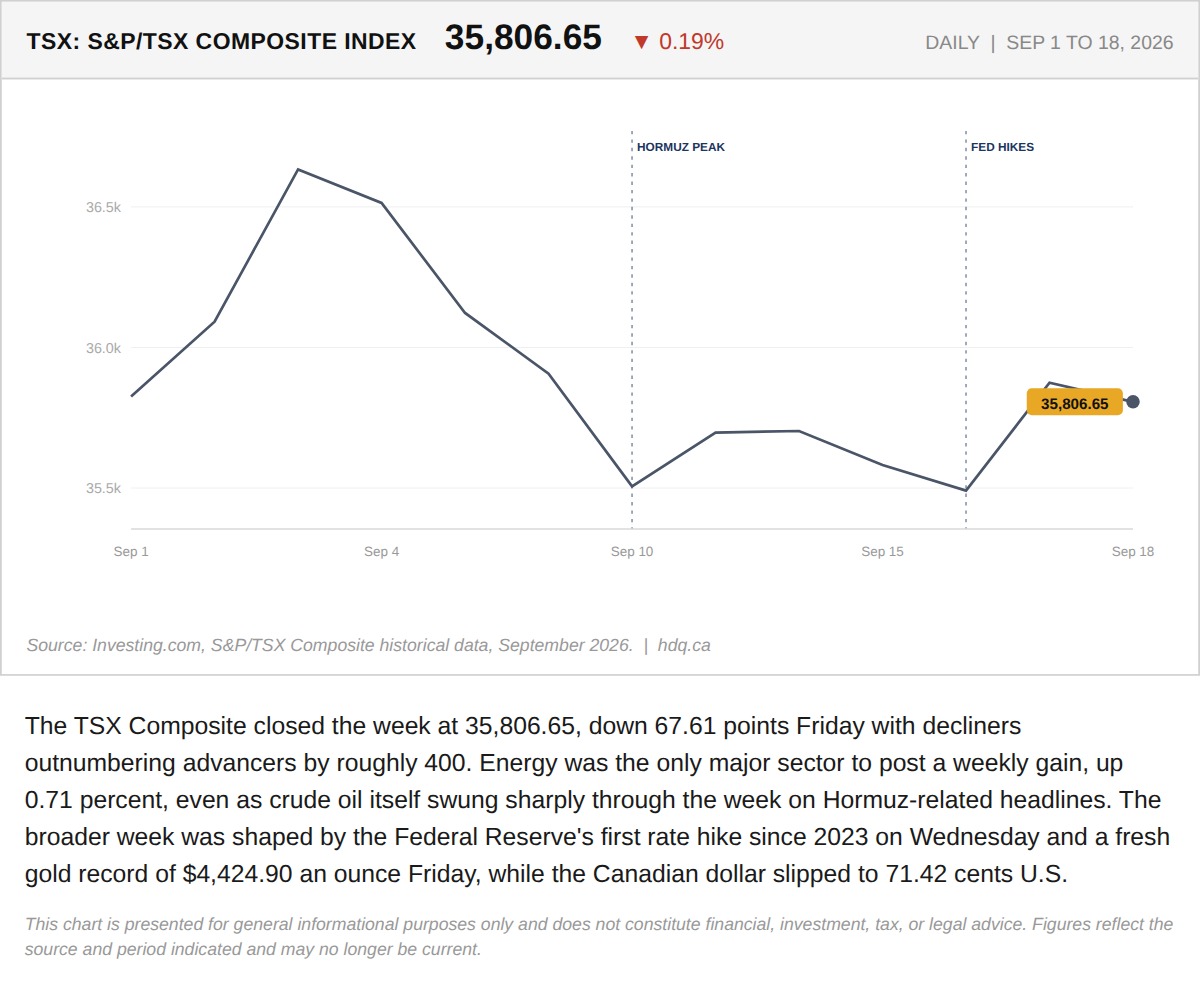
The TSX Composite closed the week at 35,806.65, down 67.61 points Friday with decliners outnumbering advancers by roughly 400.
The TSX Closed a Volatile Week at 35,806.65. Energy Was the Only Sector That Actually Held.
September 21, 2026
View chart & download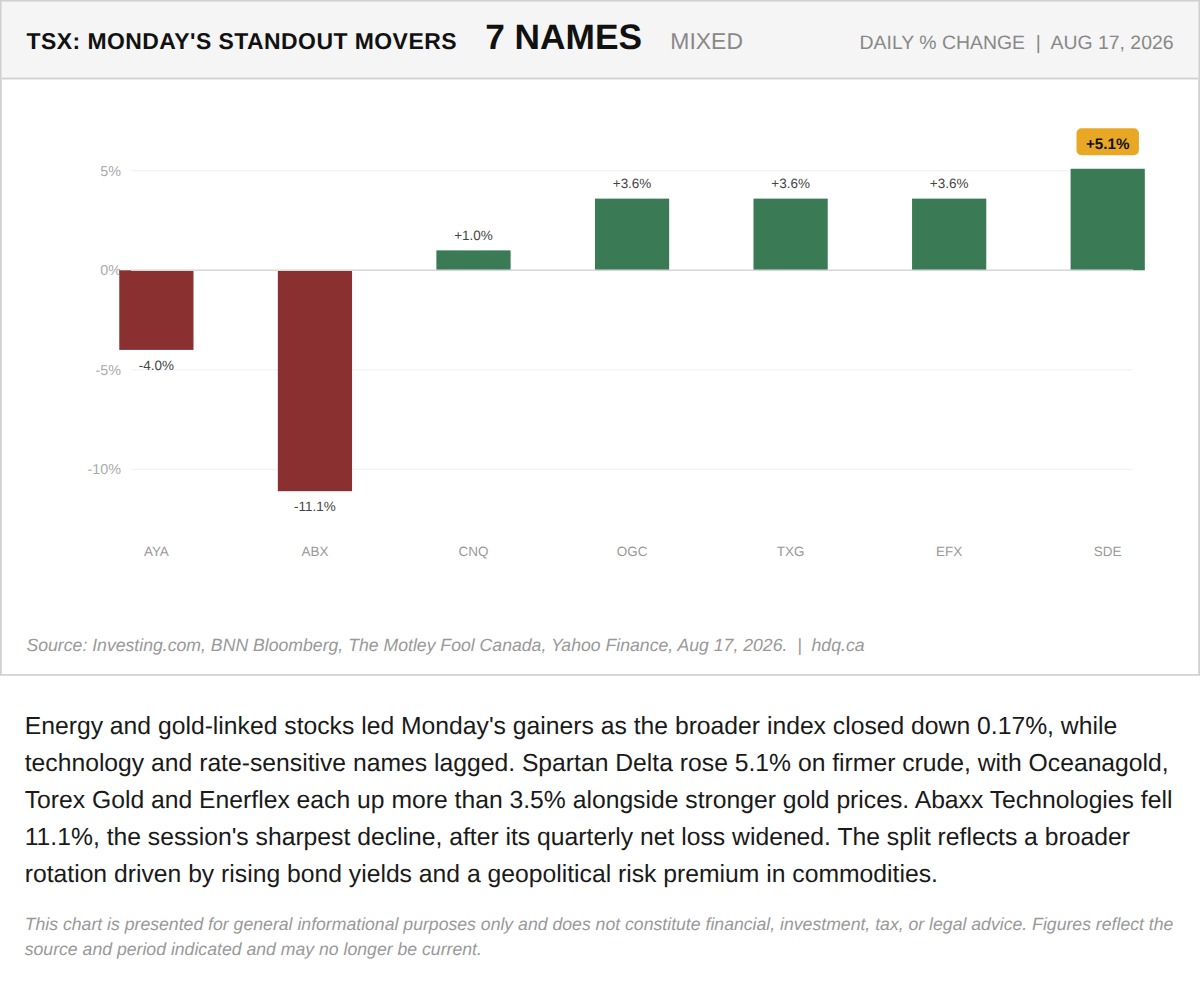
Energy and gold-linked stocks led Monday's gainers as the broader index closed down 0.17%, while technology and rate-sensitive names lagged.
Energy and Gold Names Lead Monday's TSX Movers
August 18, 2026
View chart & download
The S&P/TSX Composite closed July at 35,226, up 1.06% for the month, a modest headline figure that conceals sharp intra-month swings.
S&P/TSX Composite closes July up 1.06% after a volatile month
July 31, 2026
View chart & download
Brent and WTI crude both surged in July, with WTI ending the month at $85.47, up 23.0%, after round-tripping from a five-month low near $68.74.
WTI and Brent crude surge in July as the Iran ceasefire collapses
July 31, 2026
View chart & download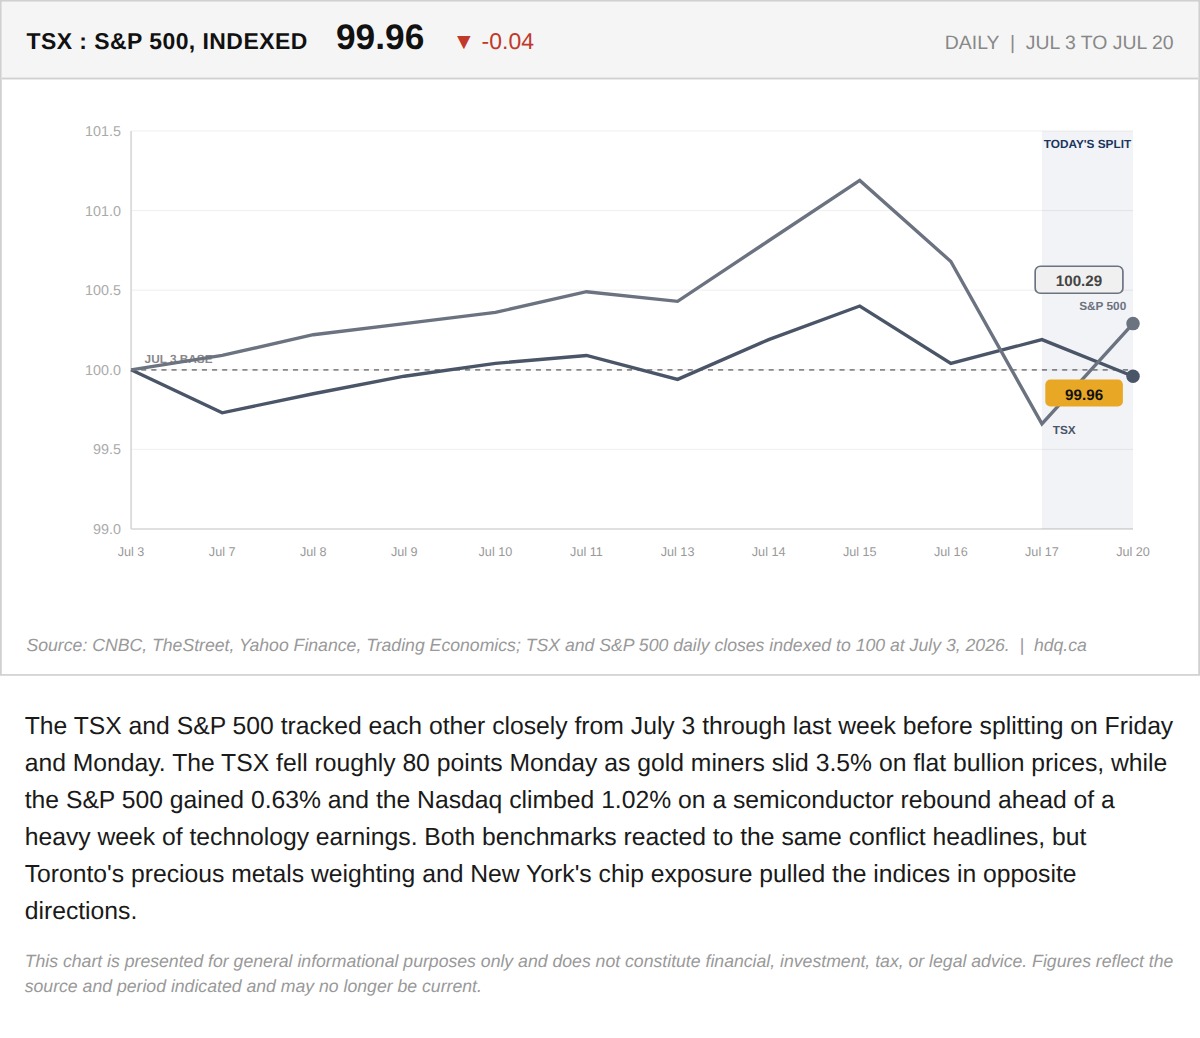
The TSX and S&P 500 tracked each other closely from July 3 through last week before splitting on Friday and Monday.
TSX Falls 80 Points as Gold Miners Slide 3.5%. The S&P 500 Rose 0.6% on the Exact Same Day.
July 20, 2026
View chart & download
Brent was the only one of the three to finish above its starting level, while the index and gold both fell.
Brent, TSX and Gold Rebased to the August 31 Close
September 30, 2026
View chart & download