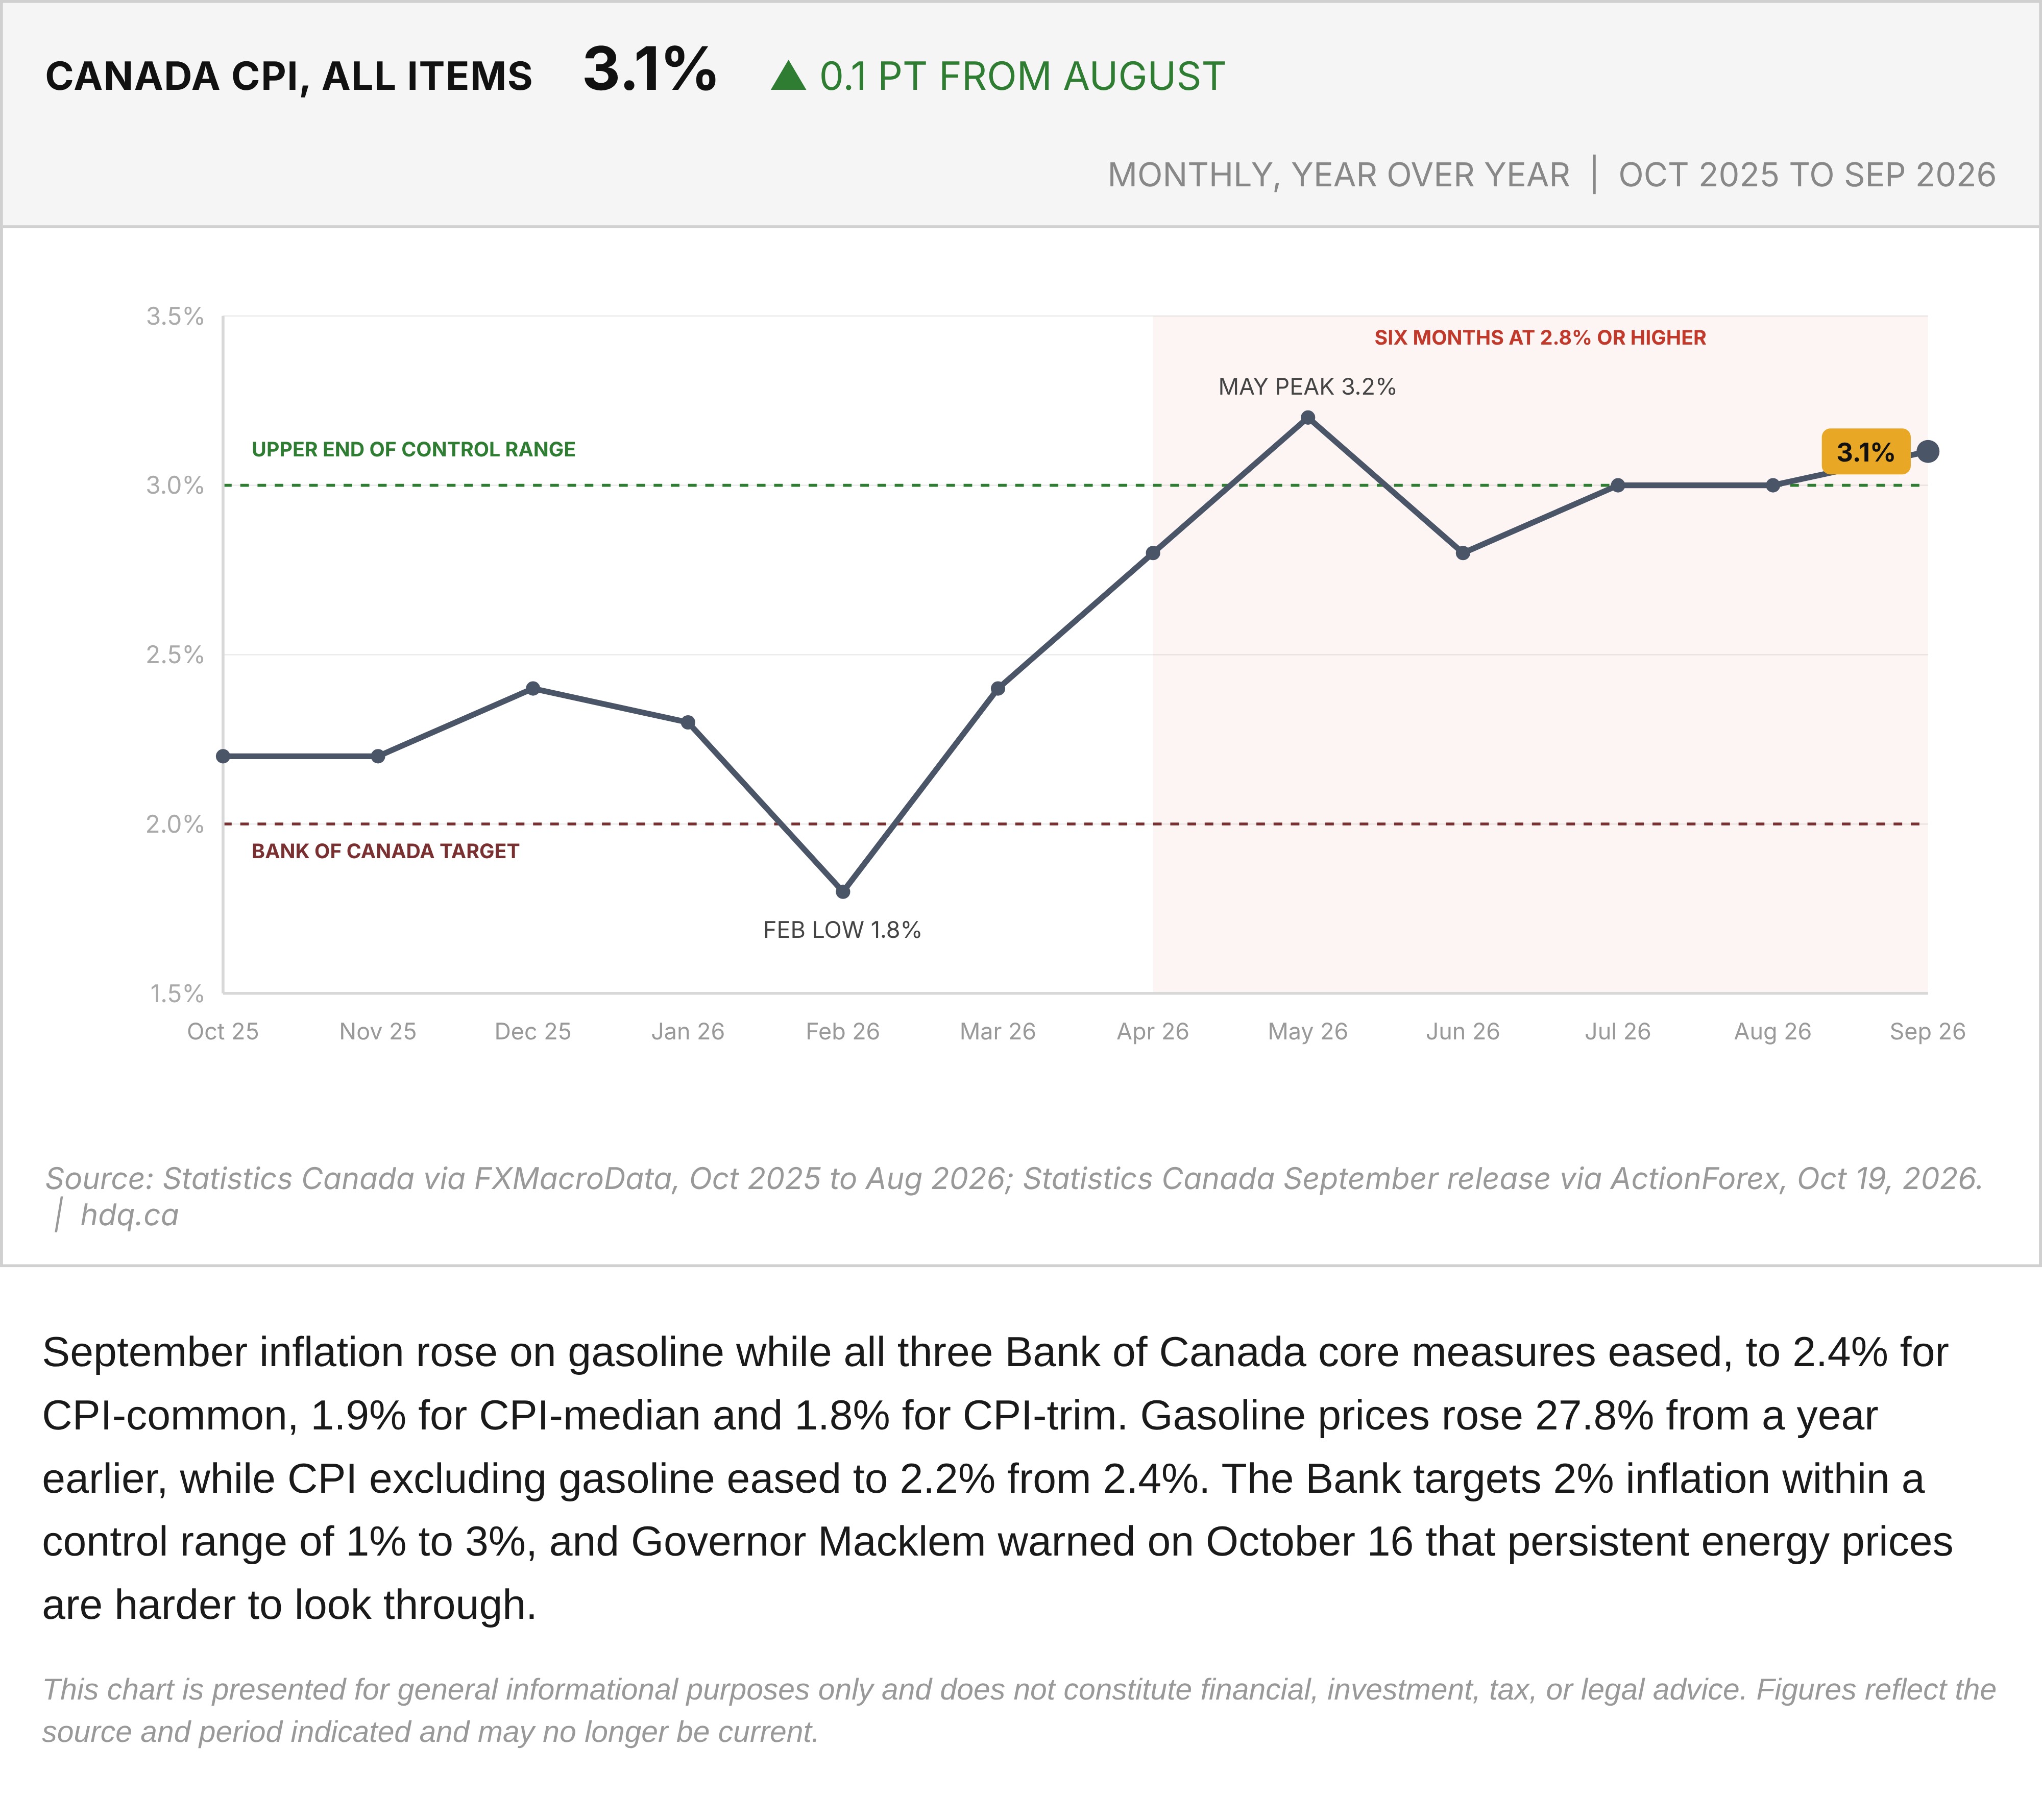
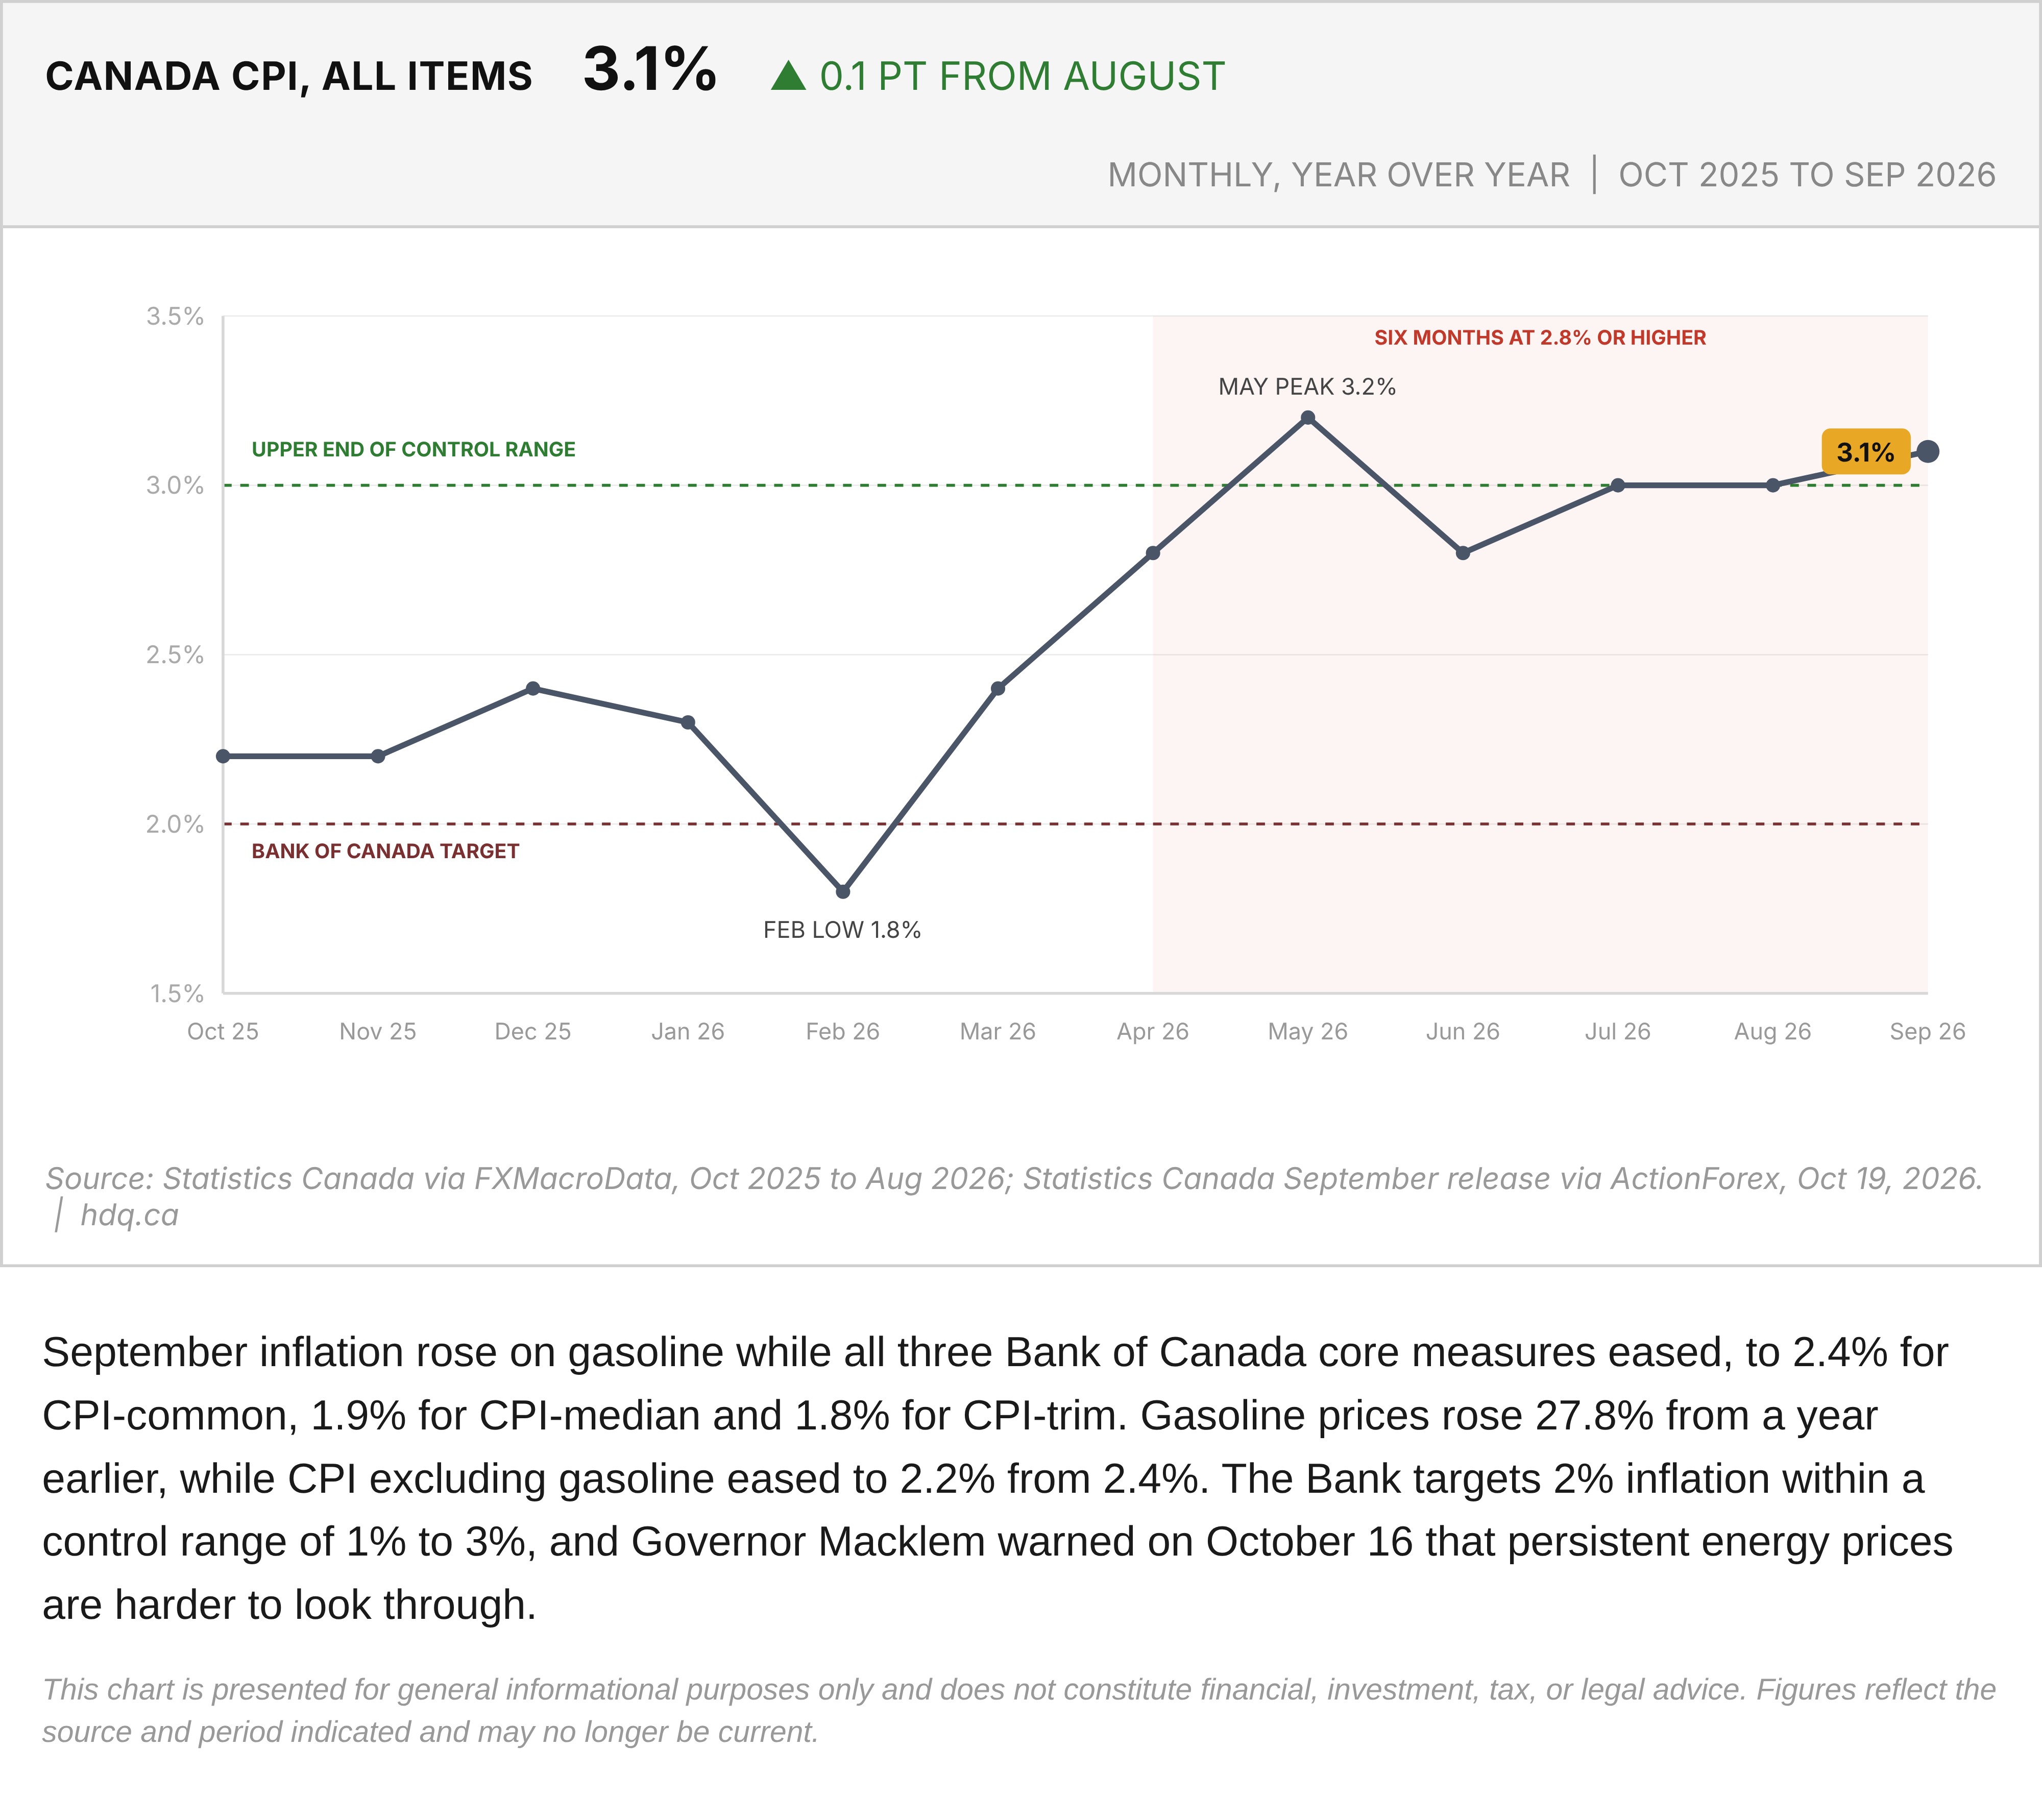
September inflation rose on gasoline while all three Bank of Canada core measures eased, to 2.4% for CPI-common, 1.9% for CPI-median and 1.8% for CPI-trim. Gasoline prices rose 27.8% from a year earlier, while CPI excluding gasoline eased to 2.2% from 2.4%. The Bank targets 2% inflation within a control range of 1% to 3%, and Governor Macklem warned on October 16 that persistent energy prices are harder to look through.
This chart is presented for general informational purposes only and does not constitute financial, investment, tax, or legal advice. Figures reflect the source and period indicated and may no longer be current.
Related charts
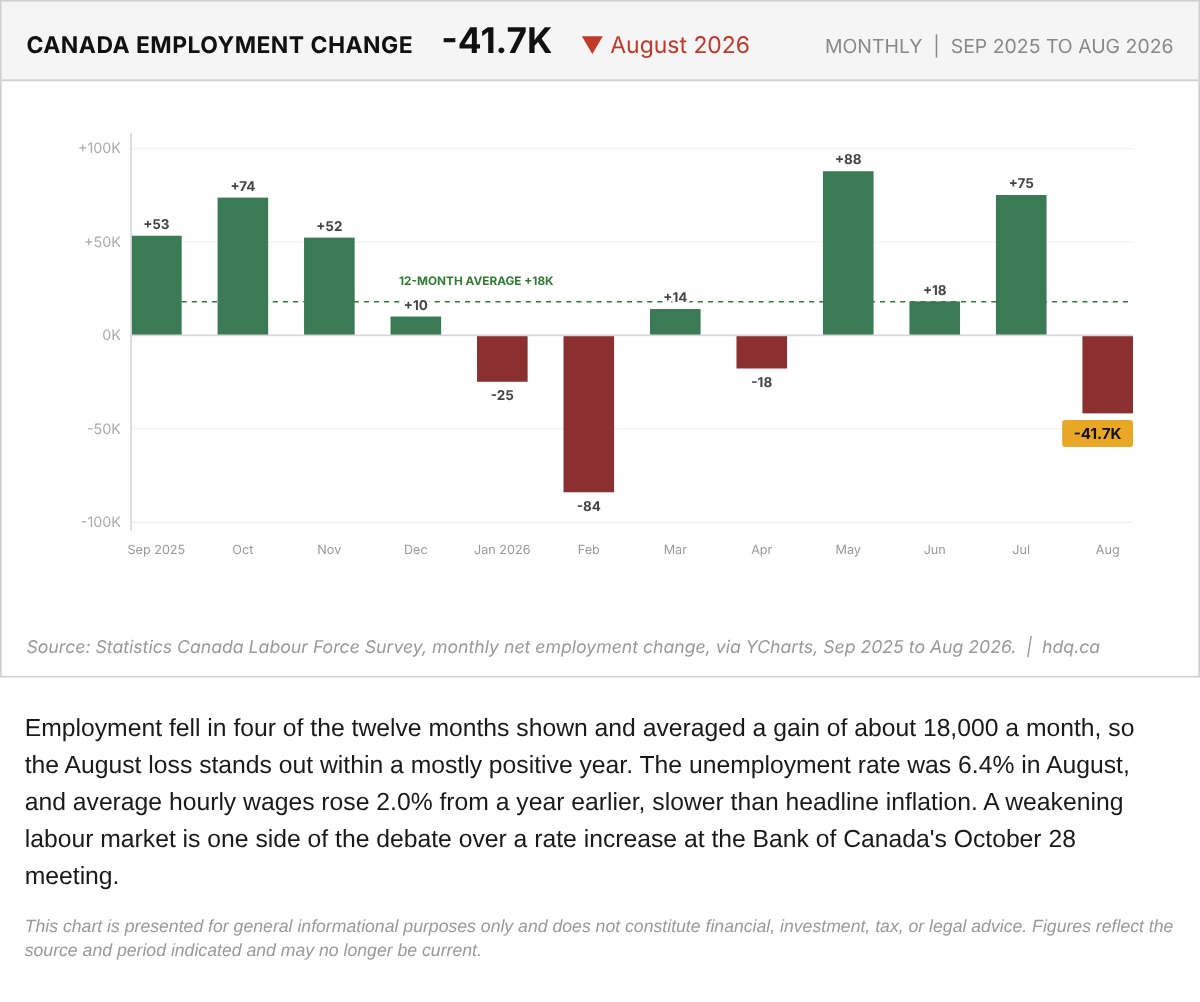
Employment fell in four of the twelve months shown and averaged a gain of about 18,000 a month, so the August loss stands out within a mostly positive year.
Canada Monthly Net Employment Change, September 2025 to August 2026
October 6, 2026
View chart & download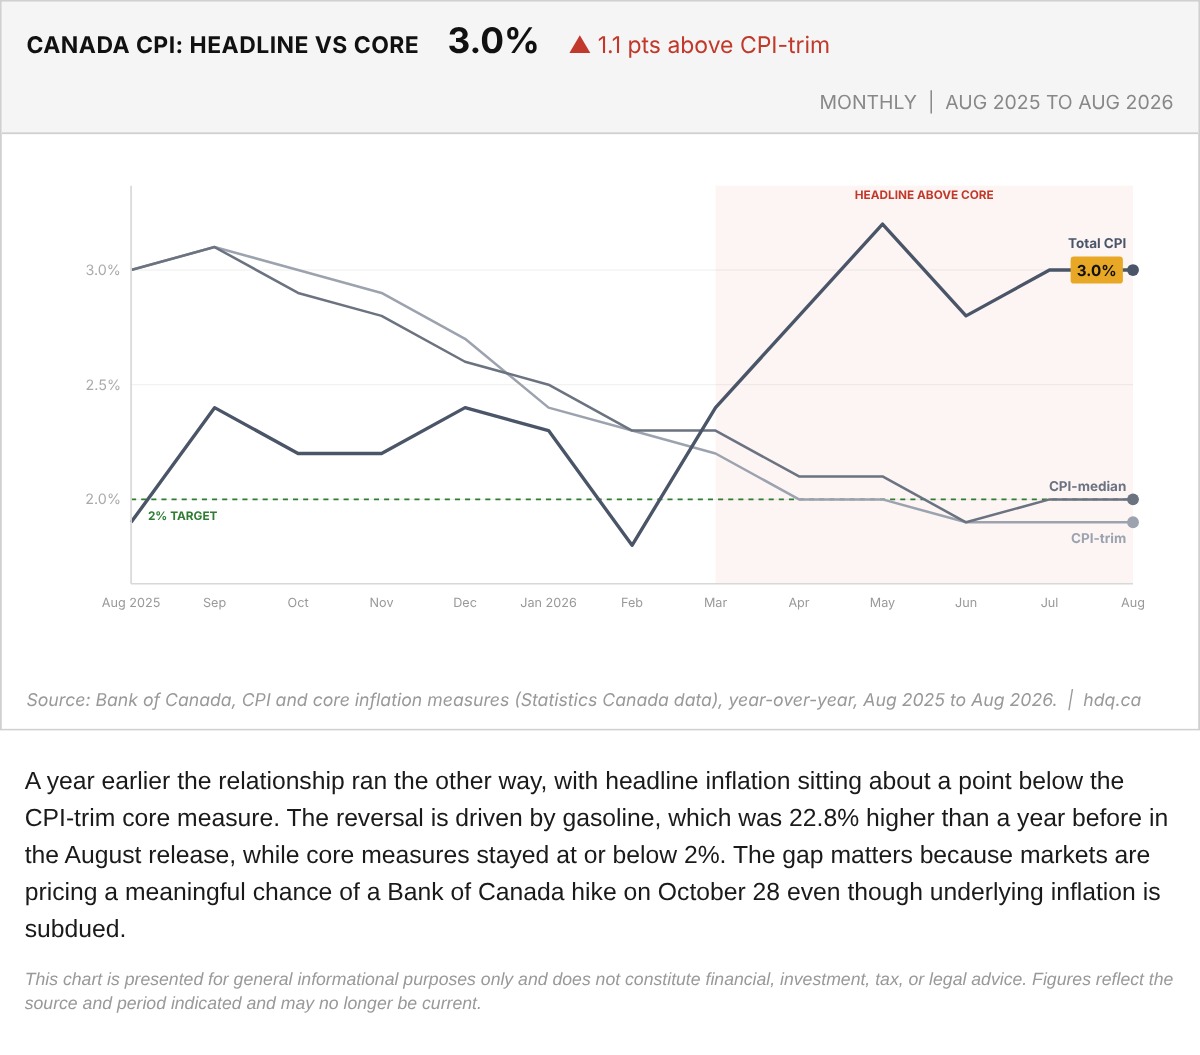
A year earlier the relationship ran the other way, with headline inflation sitting about a point below the CPI-trim core measure.
Canada Headline CPI Against Bank of Canada Core Measures, August 2026
October 6, 2026
View chart & download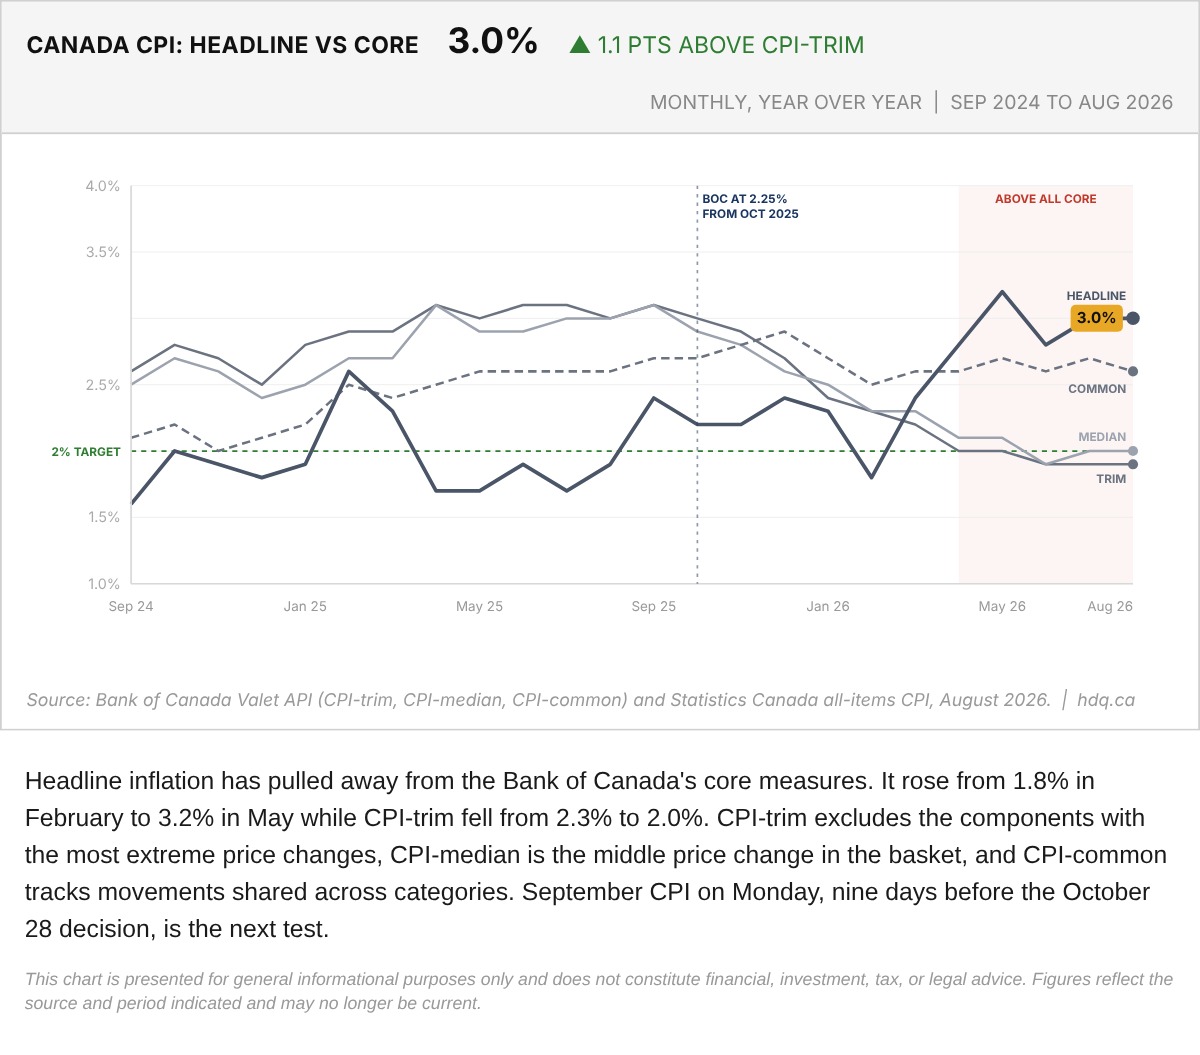
Headline inflation has pulled away from the Bank of Canada's core measures.
Canada CPI: Headline vs. Core Measures, September 2024 to August 2026
October 16, 2026
View chart & download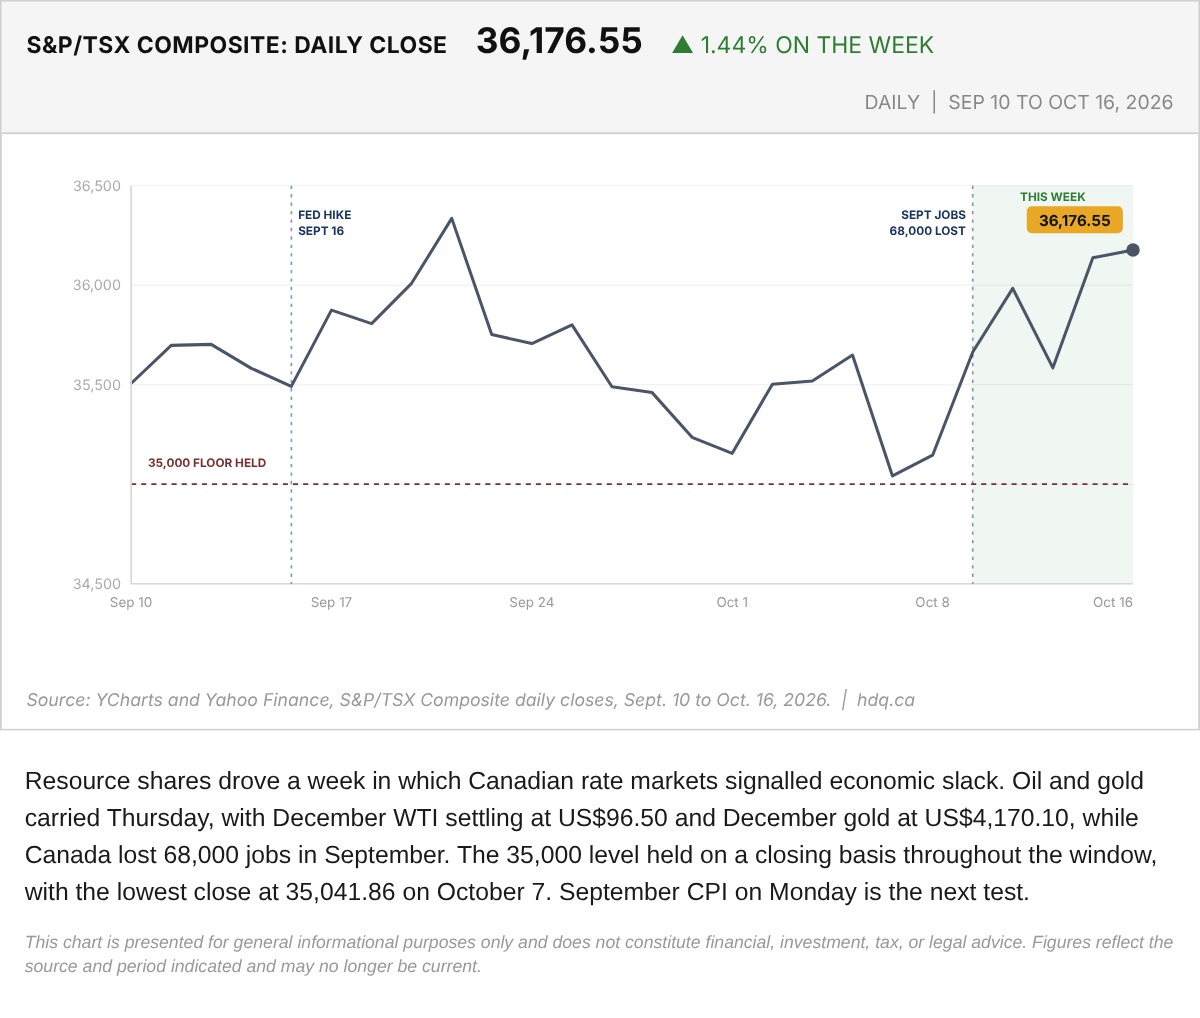
Resource shares drove a week in which Canadian rate markets signalled economic slack.
S&P/TSX Composite Daily Close, September 10 to October 16, 2026
October 16, 2026
View chart & download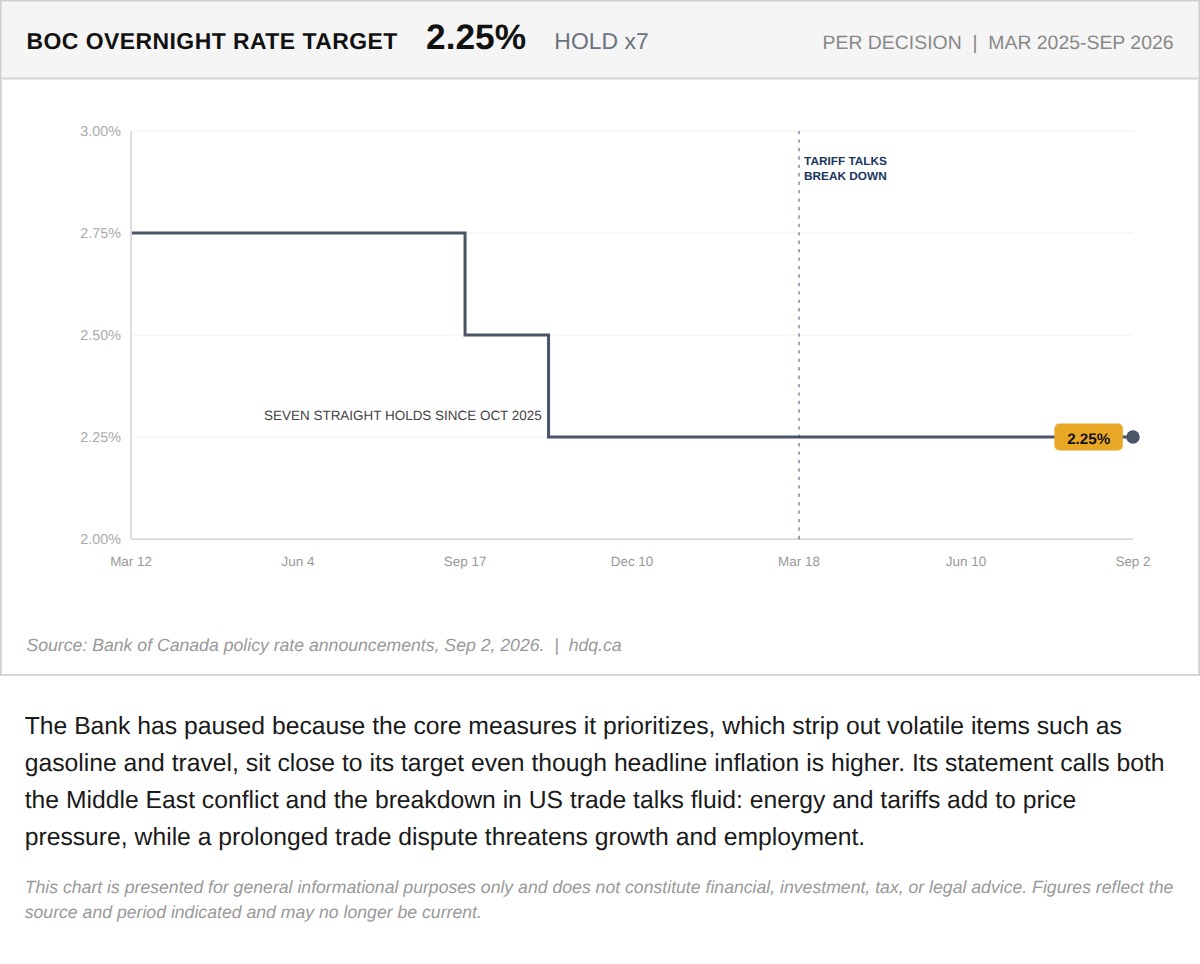
The Bank has paused because the core measures it prioritizes, which strip out volatile items such as gasoline and travel, sit close to its…
Bank of Canada Holds Its Rate for a Seventh Straight Decision
September 28, 2026
View chart & download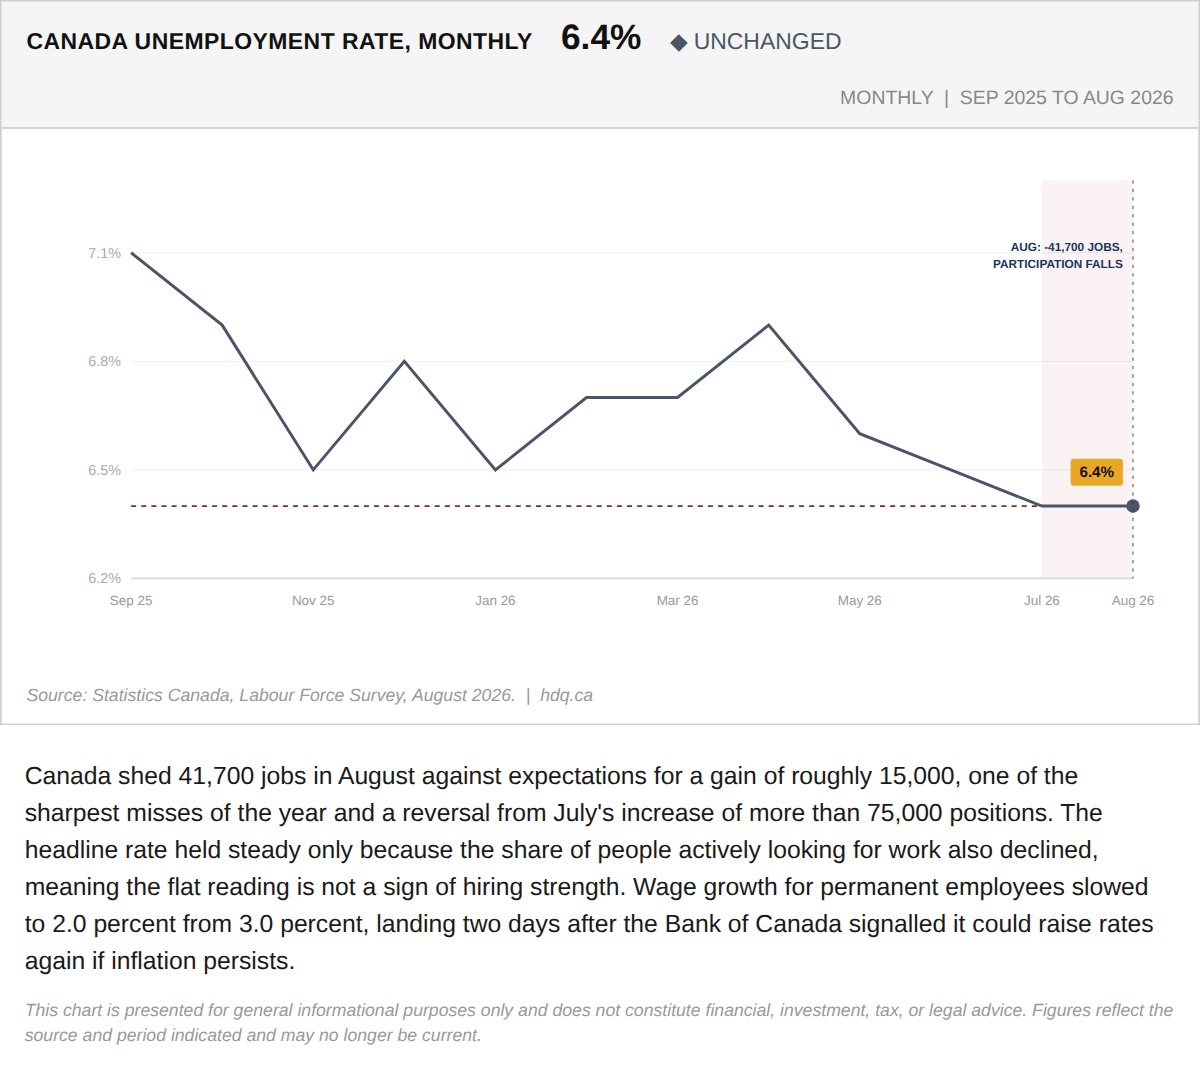
Canada shed 41,700 jobs in August against expectations for a gain of roughly 15,000, one of the sharpest misses of the year and a reversal…
Canada Lost 41,700 Jobs in August, Two Days After the Bank of Canada Signalled It Might Hike
September 4, 2026
View chart & download