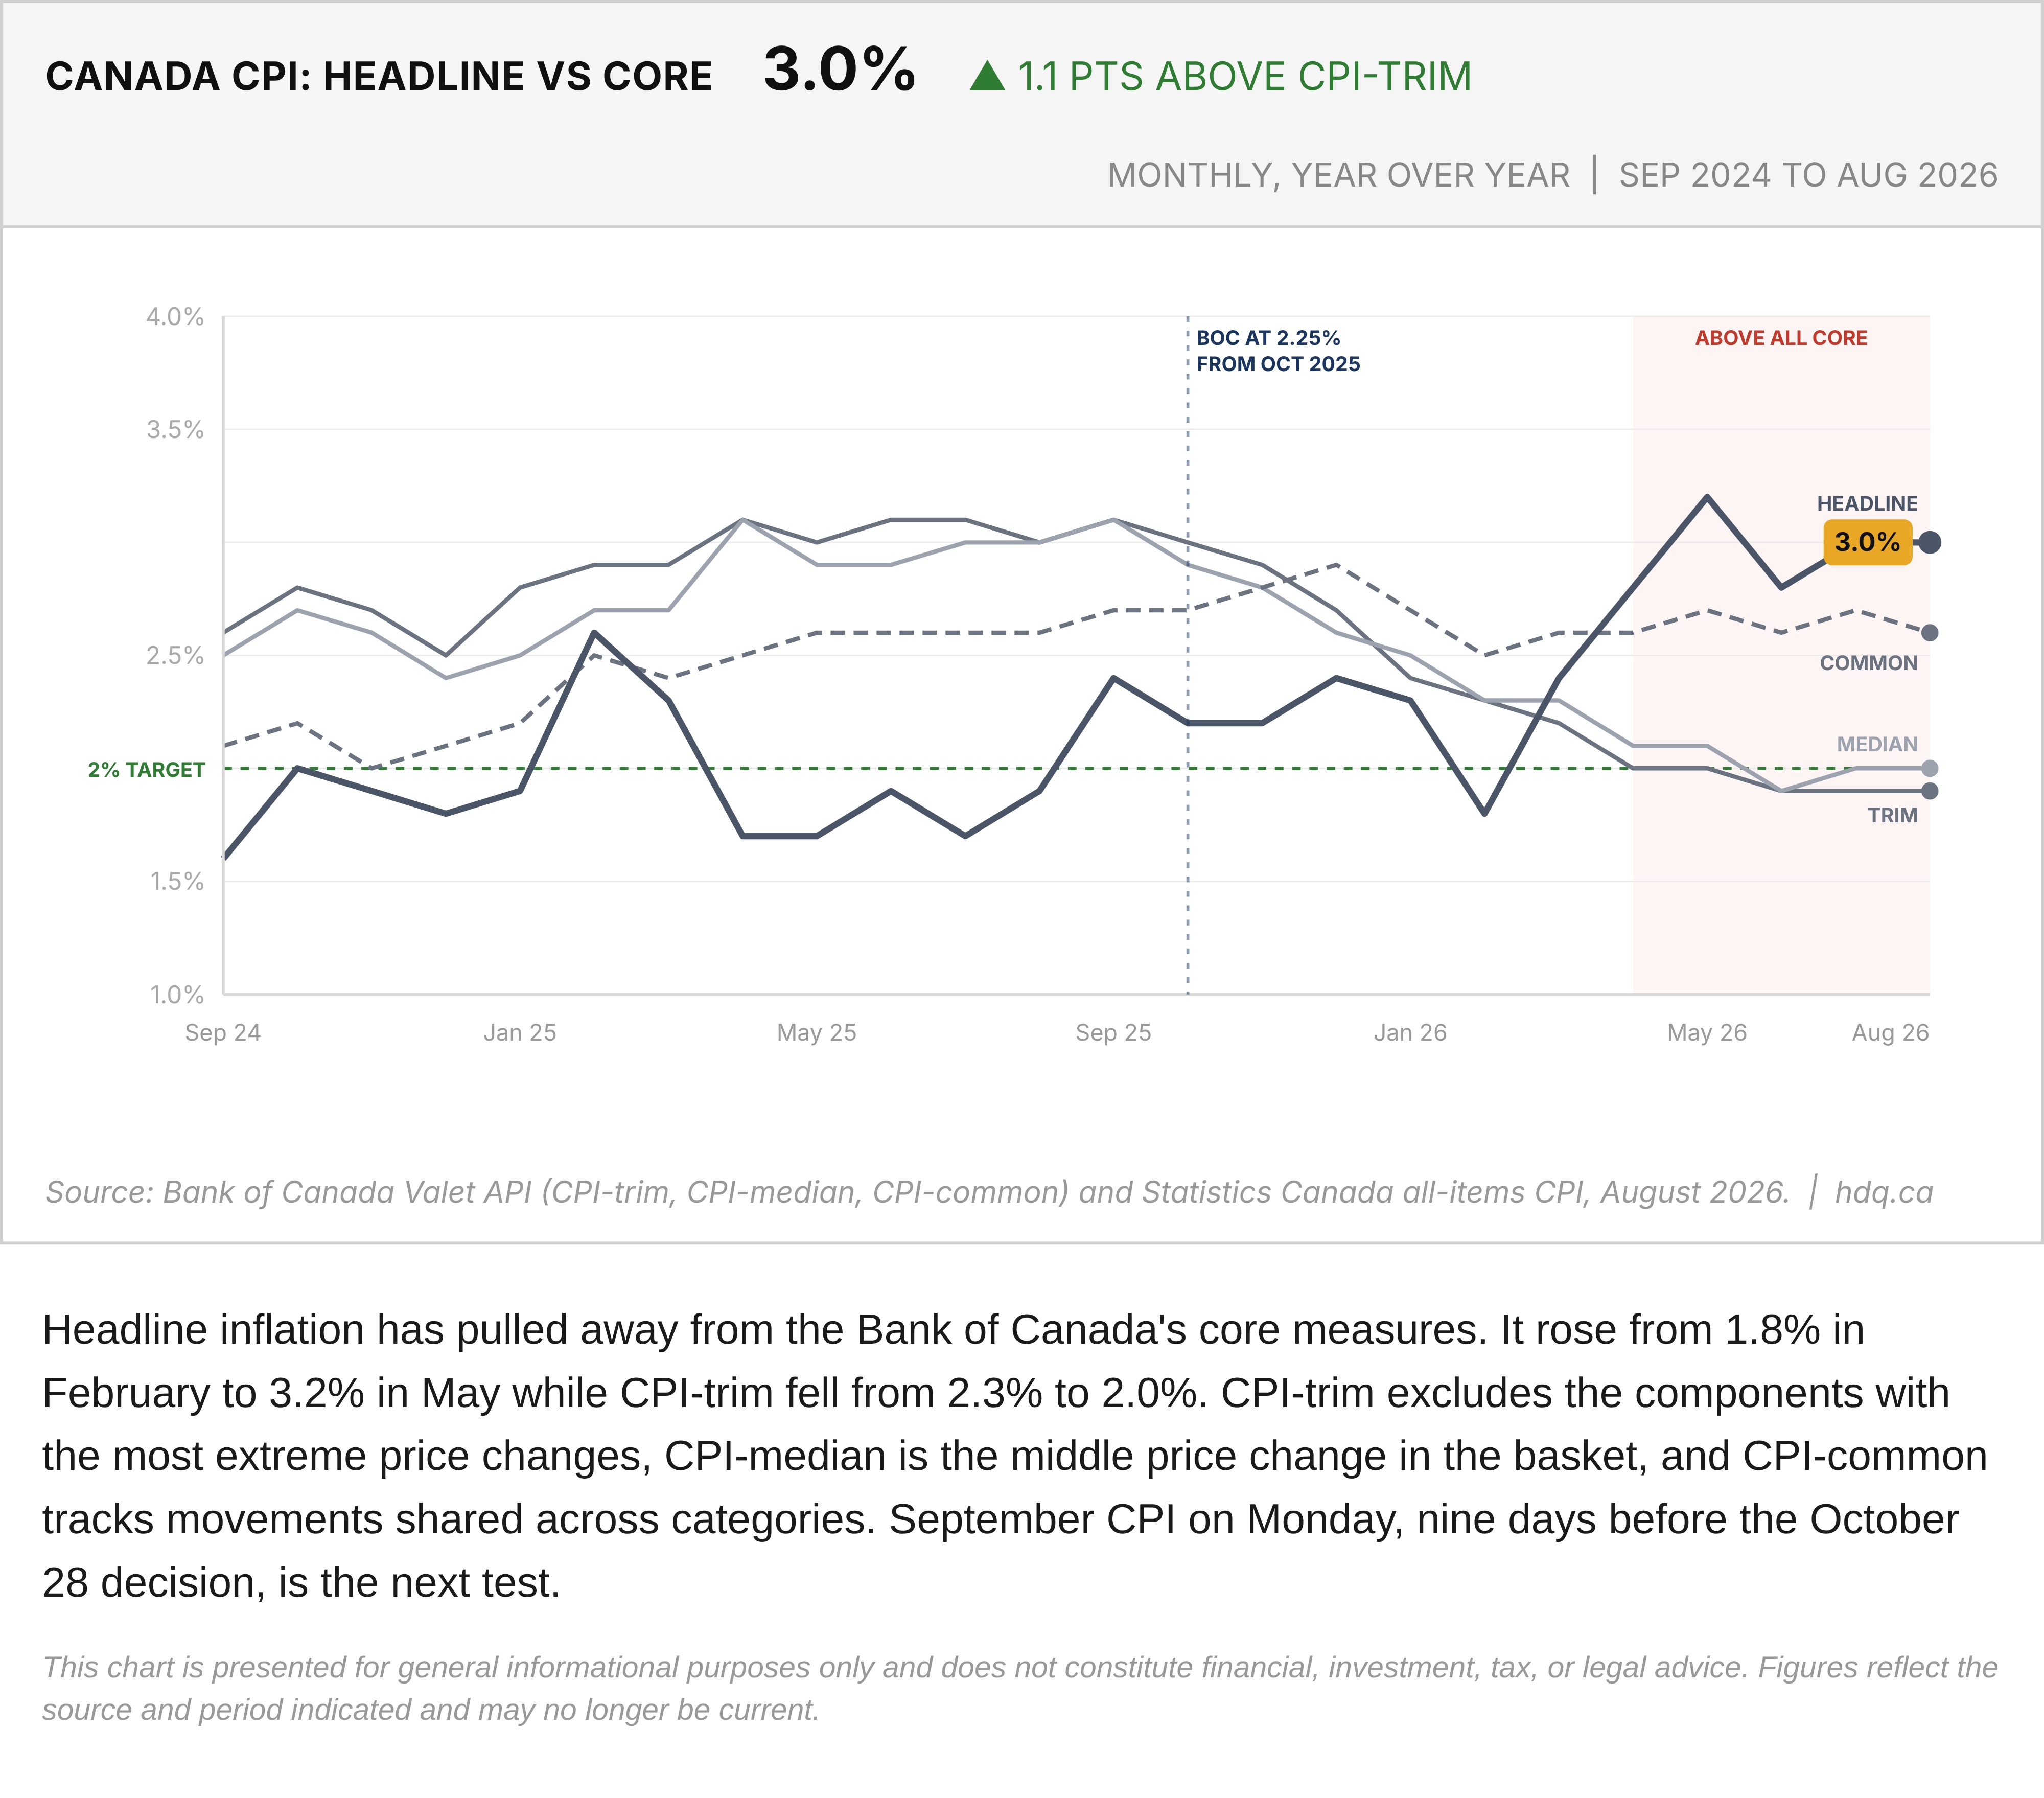
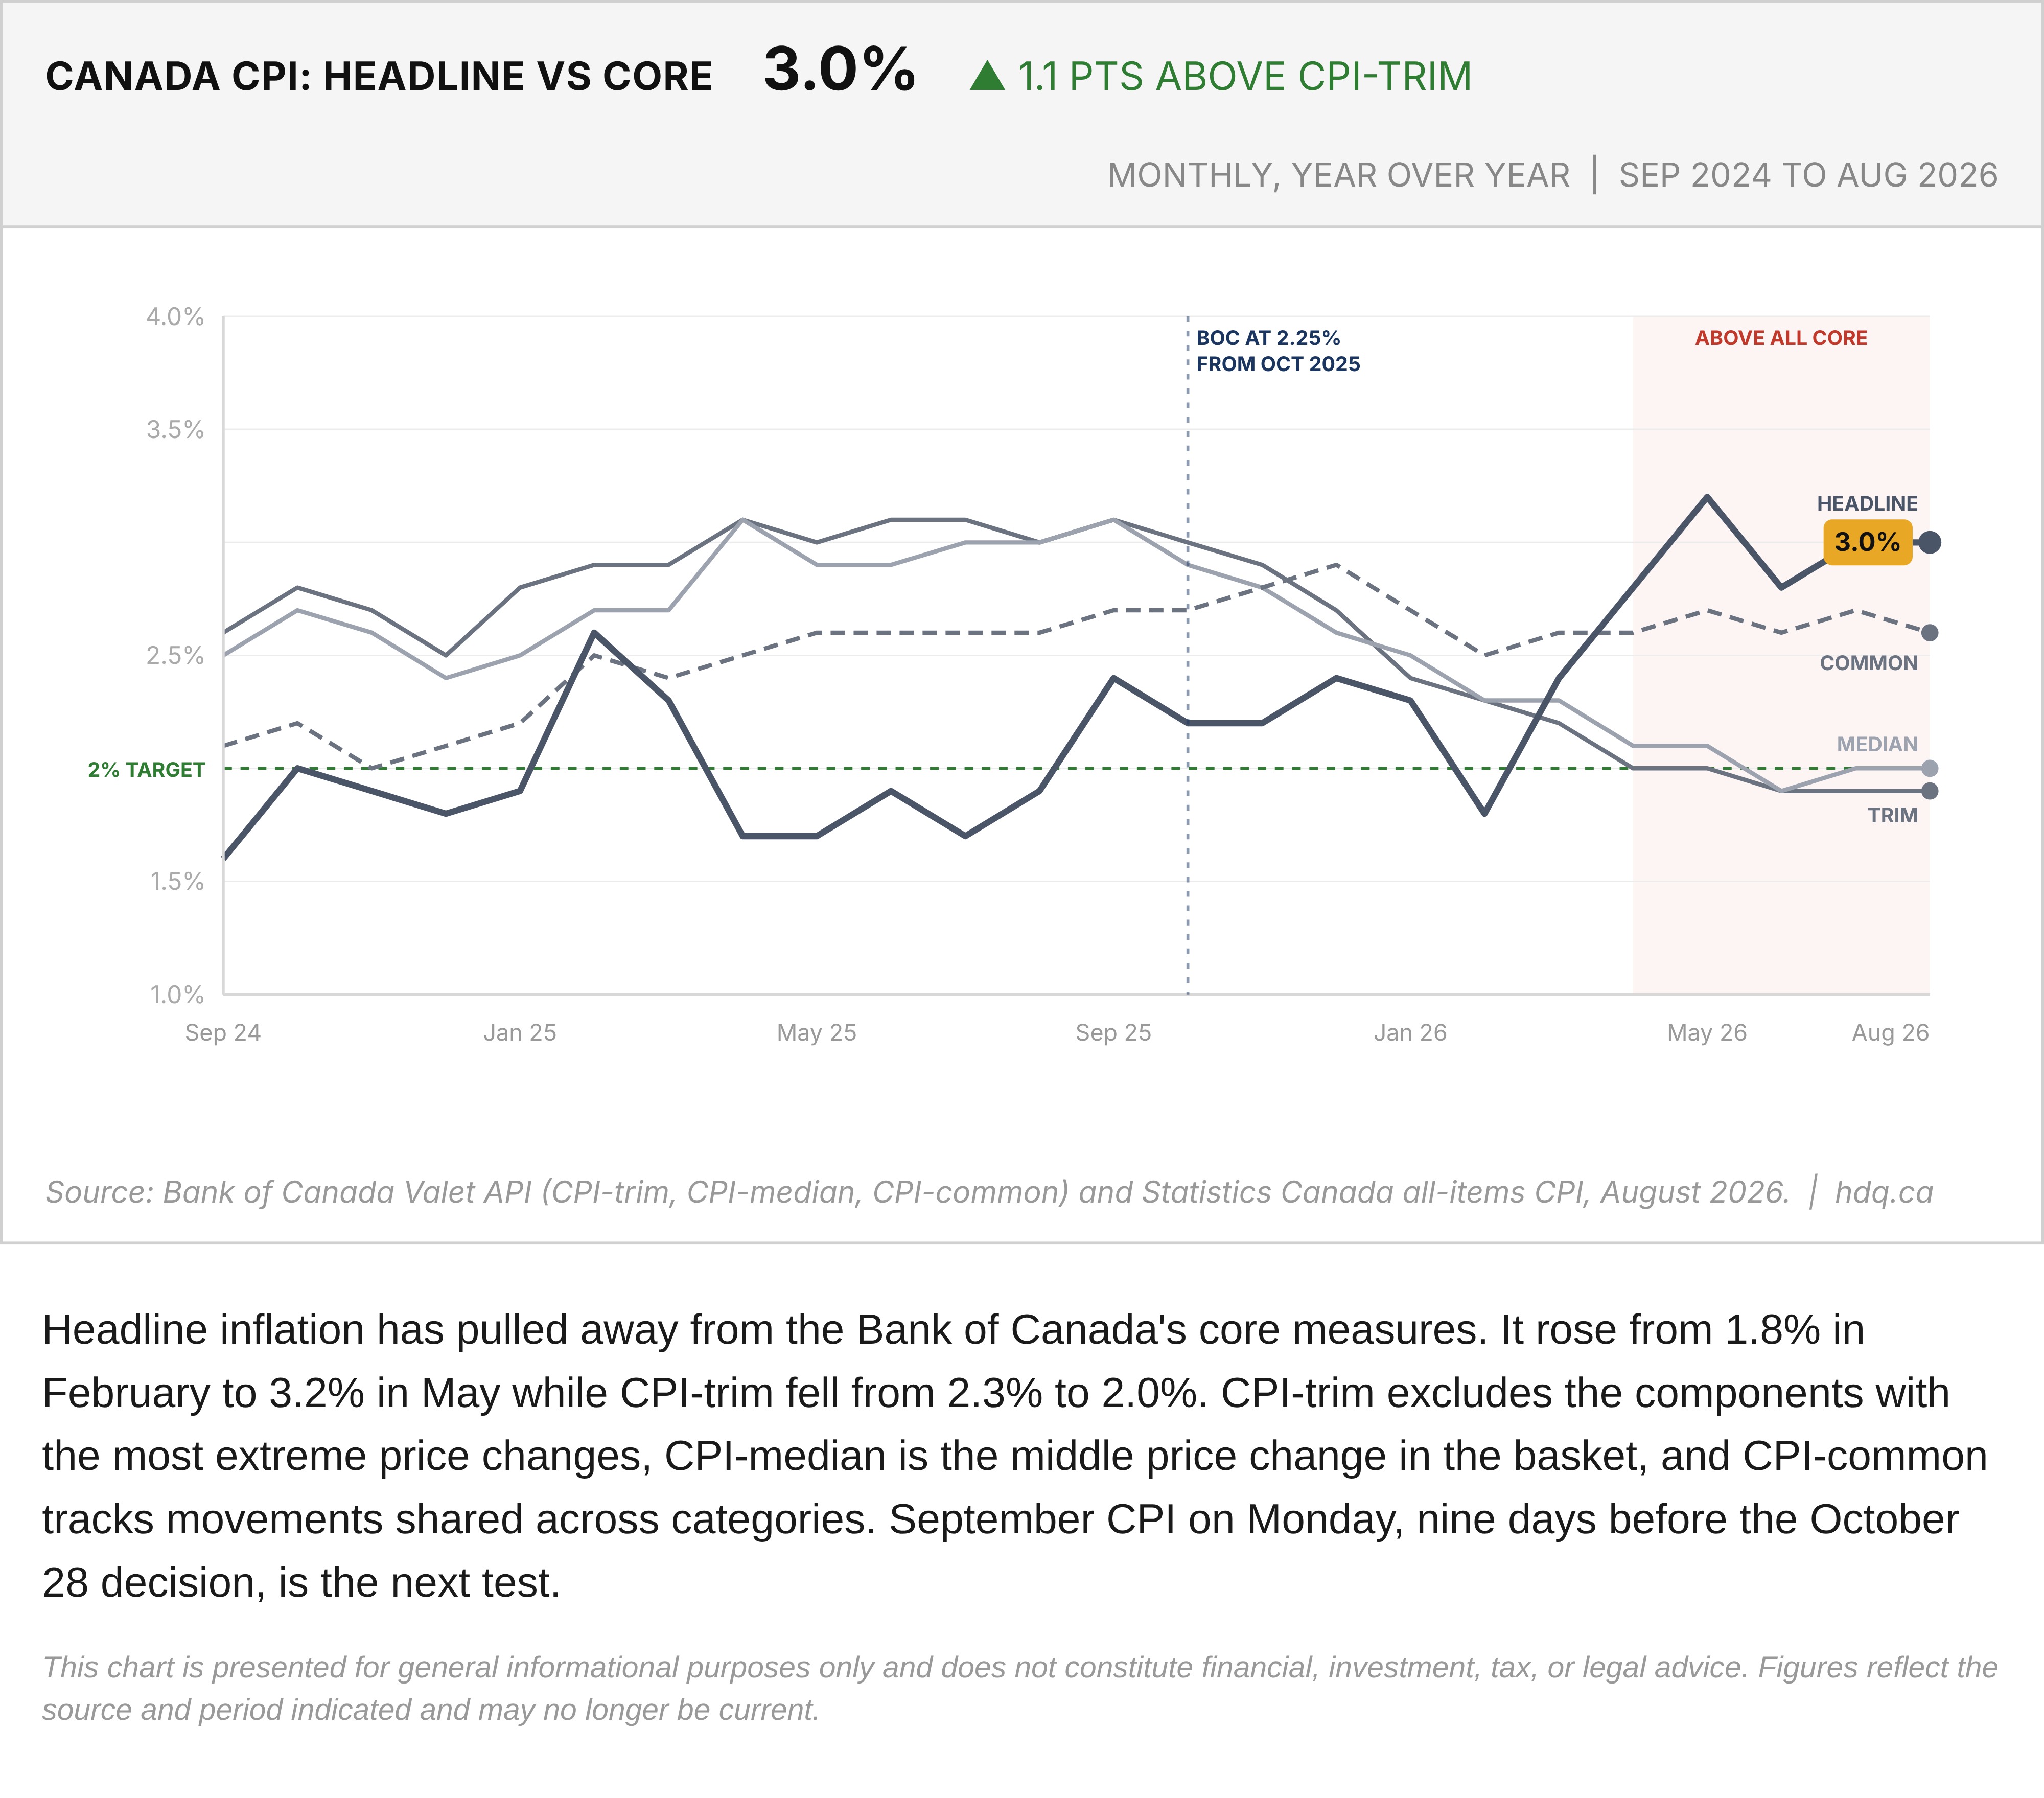
Headline inflation has pulled away from the Bank of Canada's core measures. It rose from 1.8% in February to 3.2% in May while CPI-trim fell from 2.3% to 2.0%. CPI-trim excludes the components with the most extreme price changes, CPI-median is the middle price change in the basket, and CPI-common tracks movements shared across categories. September CPI on Monday, nine days before the October 28 decision, is the next test.
This chart is presented for general informational purposes only and does not constitute financial, investment, tax, or legal advice. Figures reflect the source and period indicated and may no longer be current.
Related charts
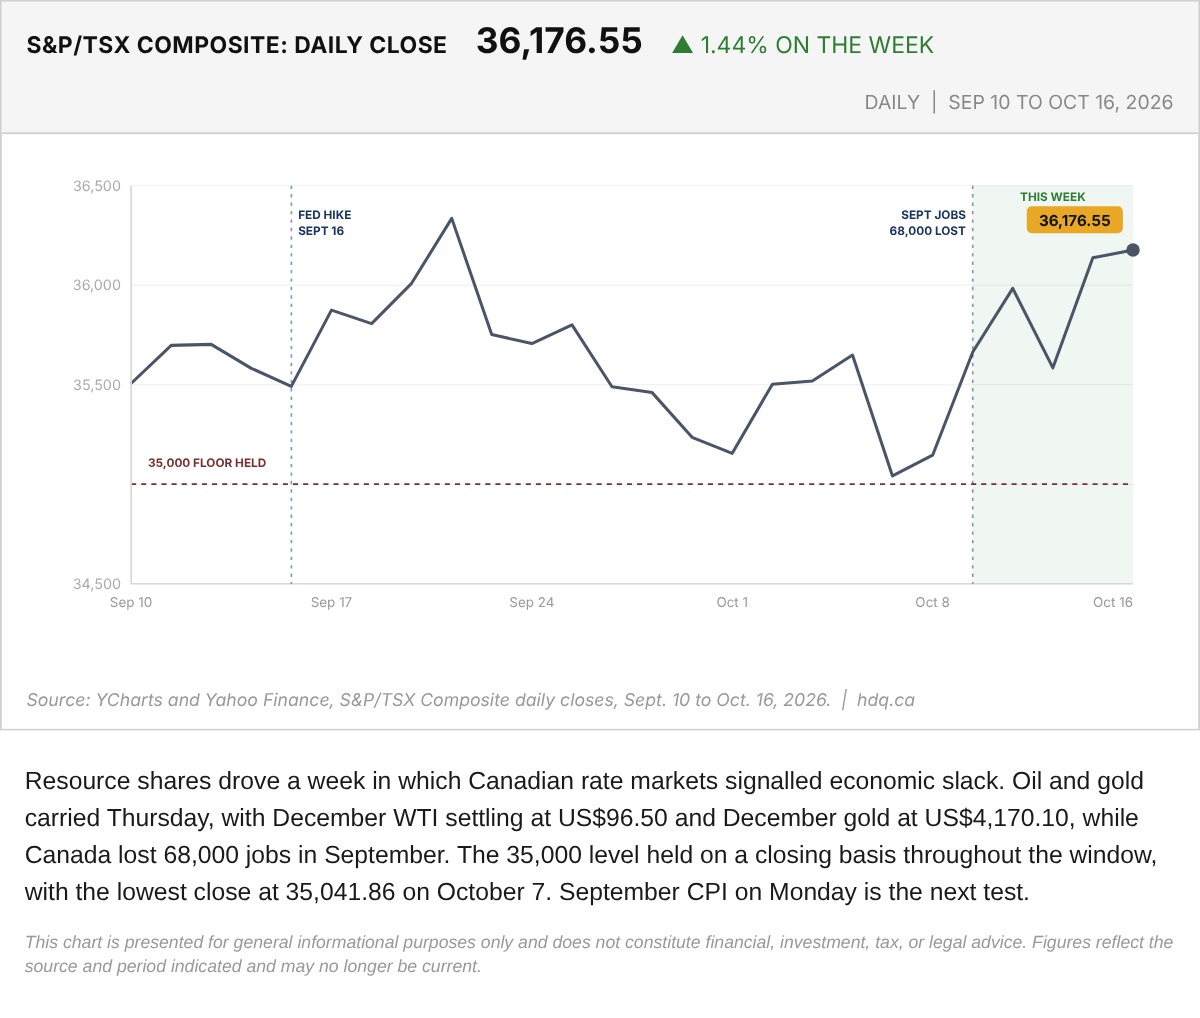
Resource shares drove a week in which Canadian rate markets signalled economic slack.
S&P/TSX Composite Daily Close, September 10 to October 16, 2026
October 16, 2026
View chart & download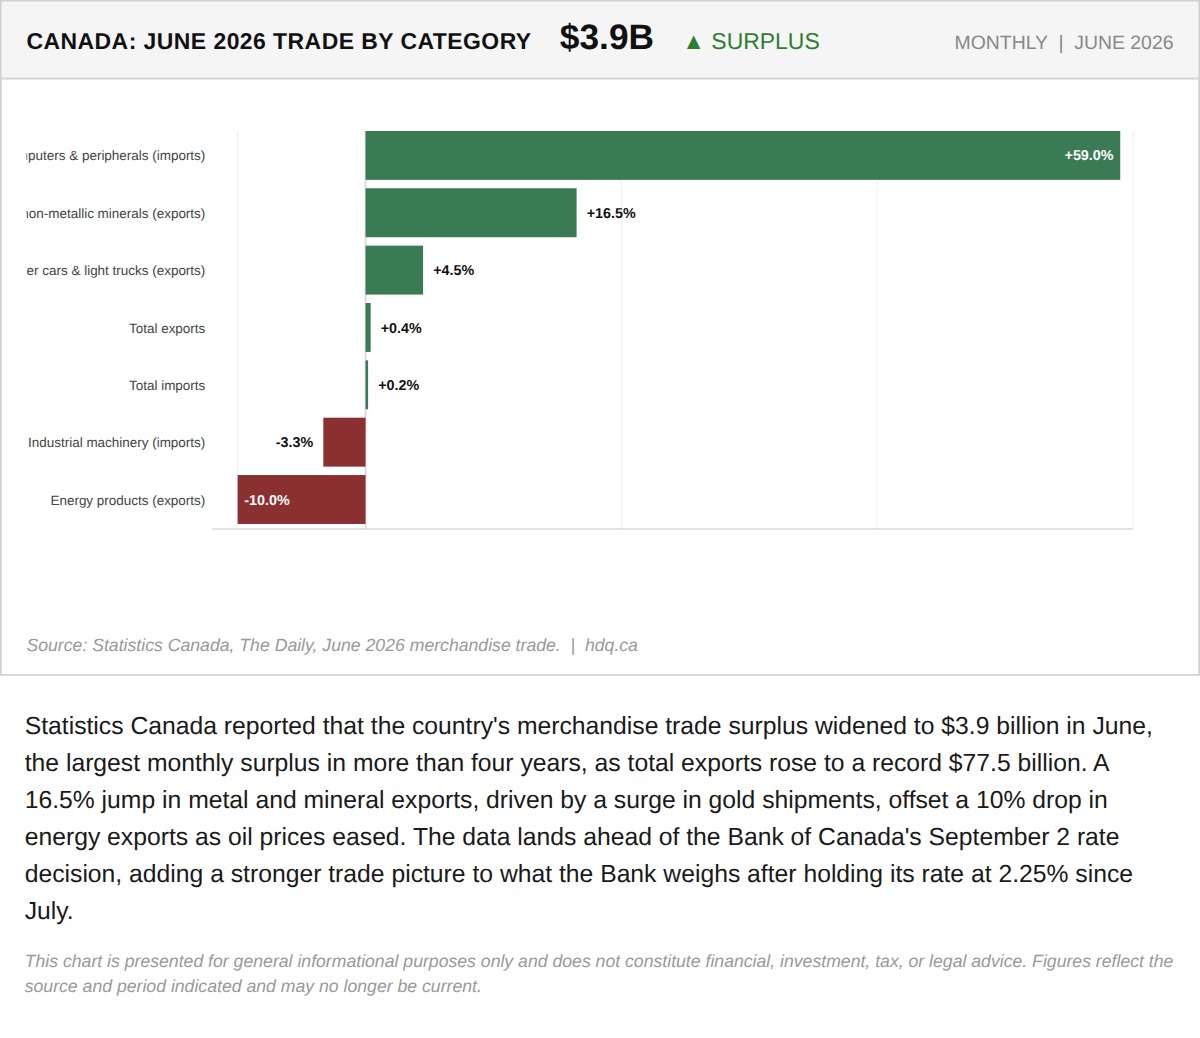
Statistics Canada reported that the country's merchandise trade surplus widened to $3.9 billion in June, the largest monthly surplus in…
Canada's Trade Surplus Widens to a Four-Year High in June
June 1, 2026
View chart & download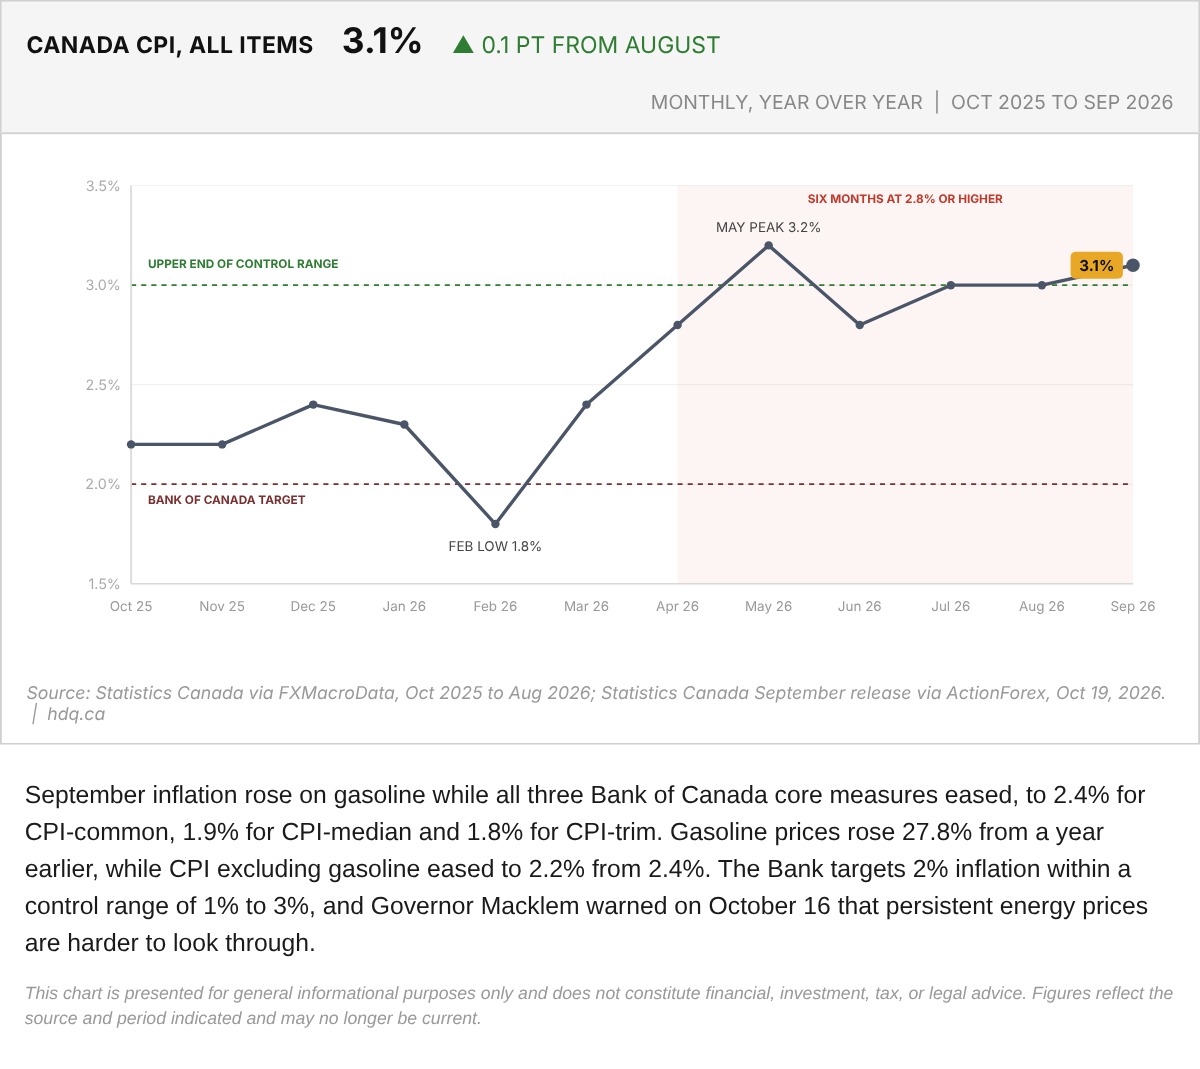
September inflation rose on gasoline while all three Bank of Canada core measures eased, to 2.4% for CPI-common, 1.9% for CPI-median and 1.8% for CPI-trim.
Canada All-Items CPI, October 2025 to September 2026
October 19, 2026
View chart & download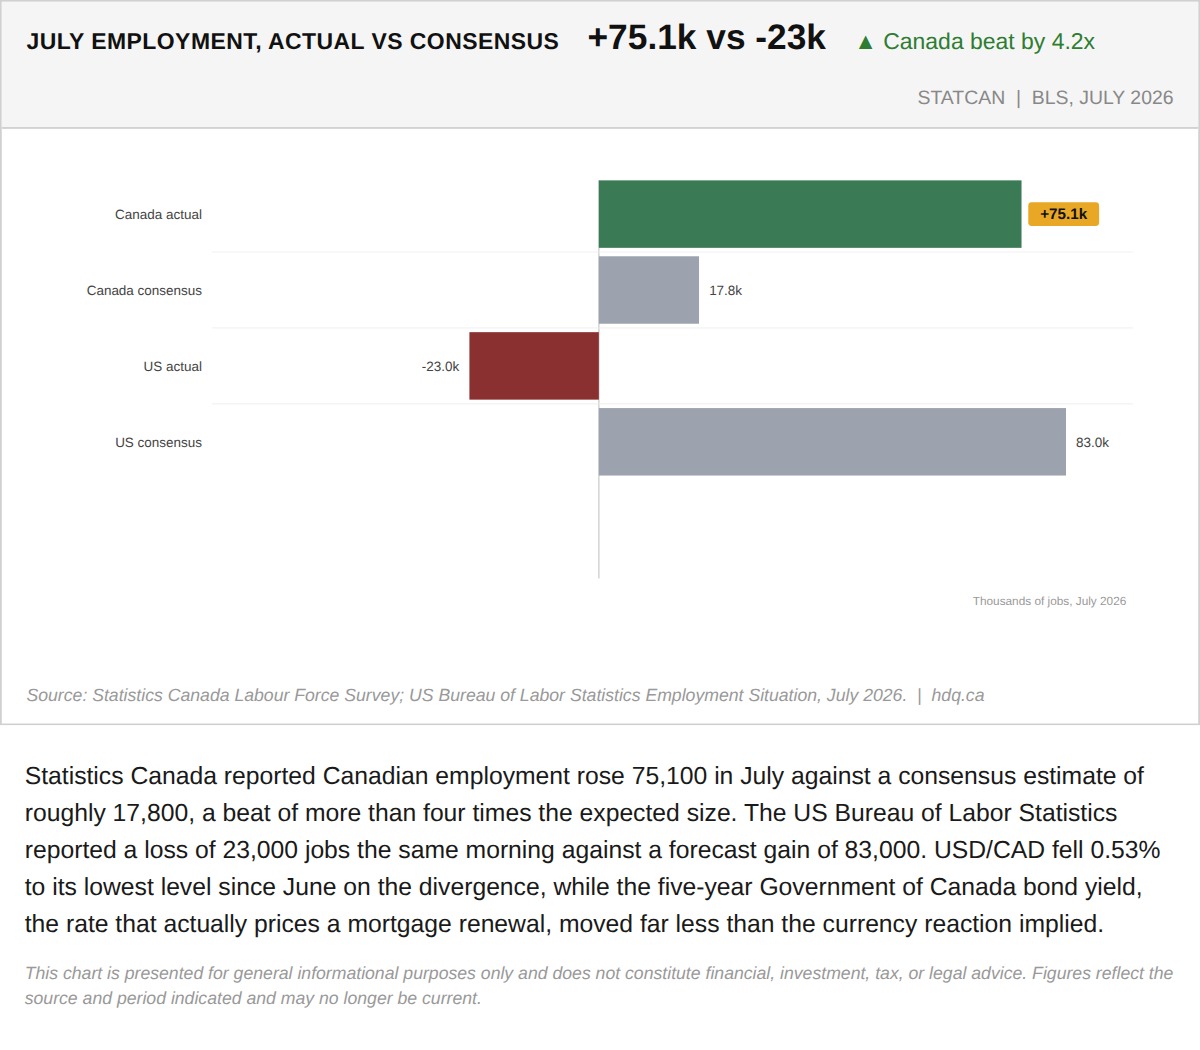
Statistics Canada reported Canadian employment rose 75,100 in July against a consensus estimate of roughly 17,800, a beat of more than four times the expected size.
Canada's July Jobs Beat Consensus by 4.2 Times While the US Missed Badly
August 7, 2026
View chart & download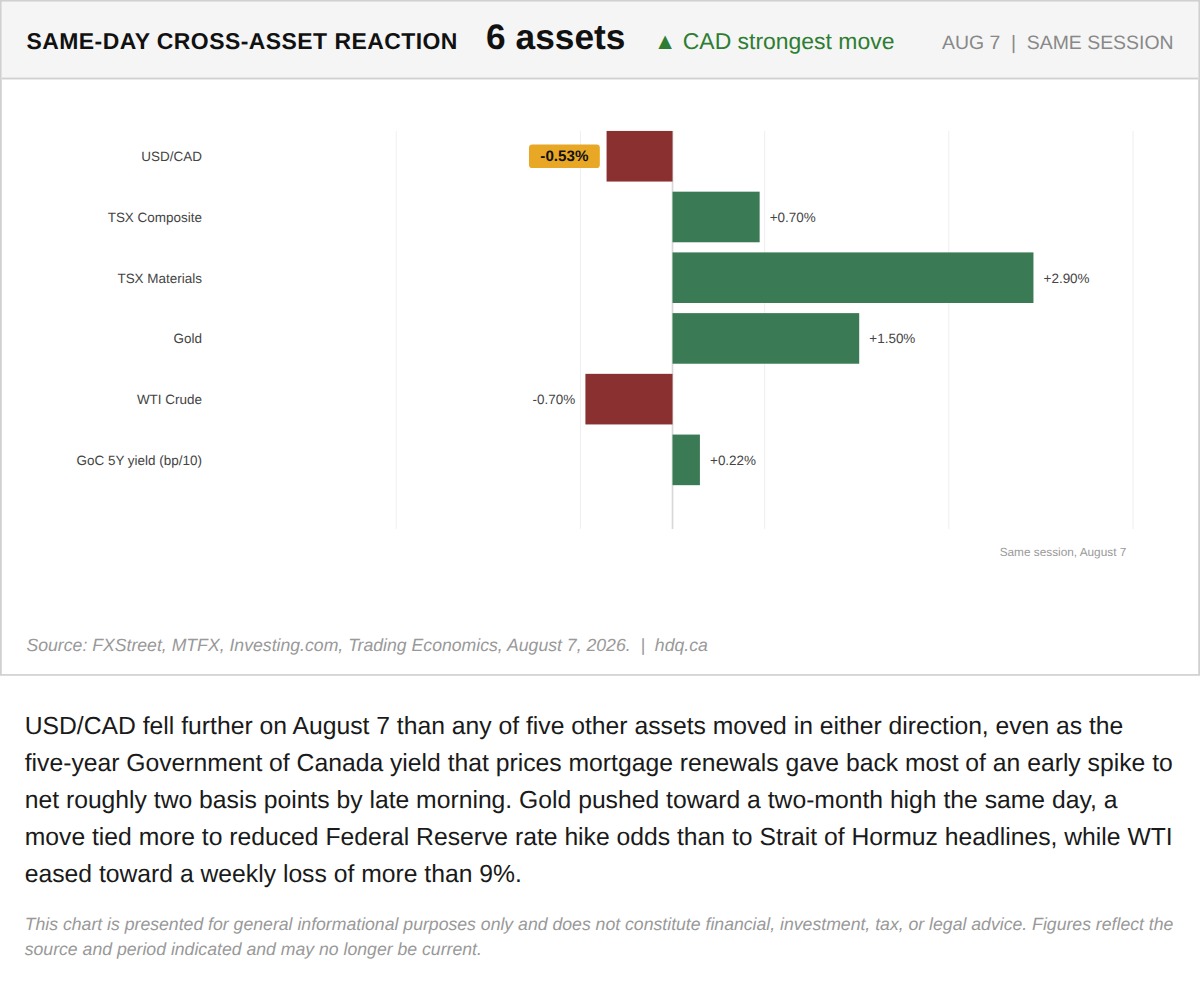
USD/CAD fell further on August 7 than any of five other assets moved in either direction, even as the five-year Government of Canada yield…
The Canadian Dollar Led a Six-Asset Reaction to the Same Jobs Data
August 7, 2026
View chart & download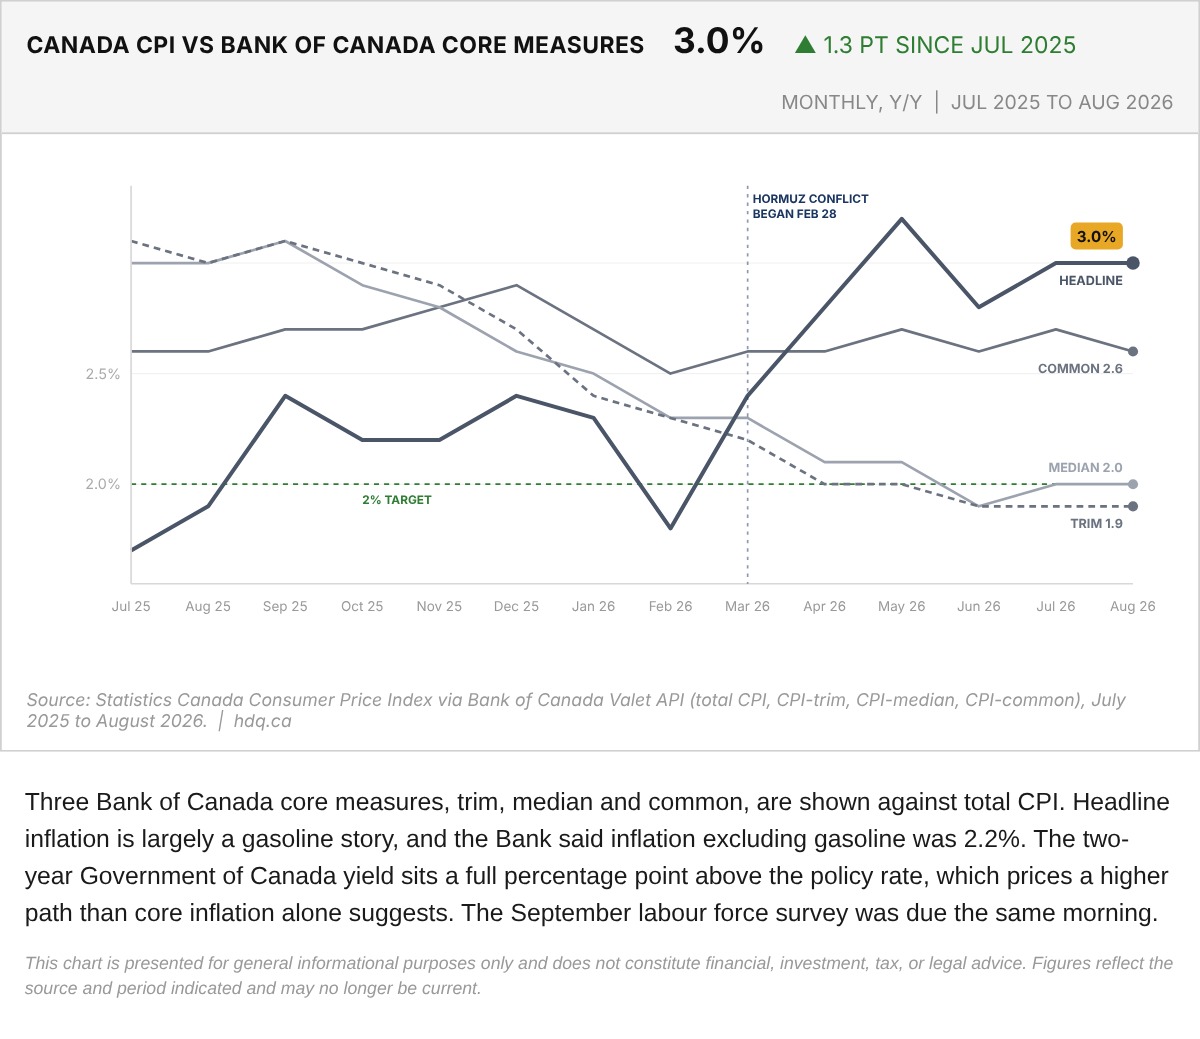
Three Bank of Canada core measures, trim, median and common, are shown against total CPI.
Canada CPI Against Bank of Canada Core Measures, July 2025 to August 2026
October 9, 2026
View chart & download