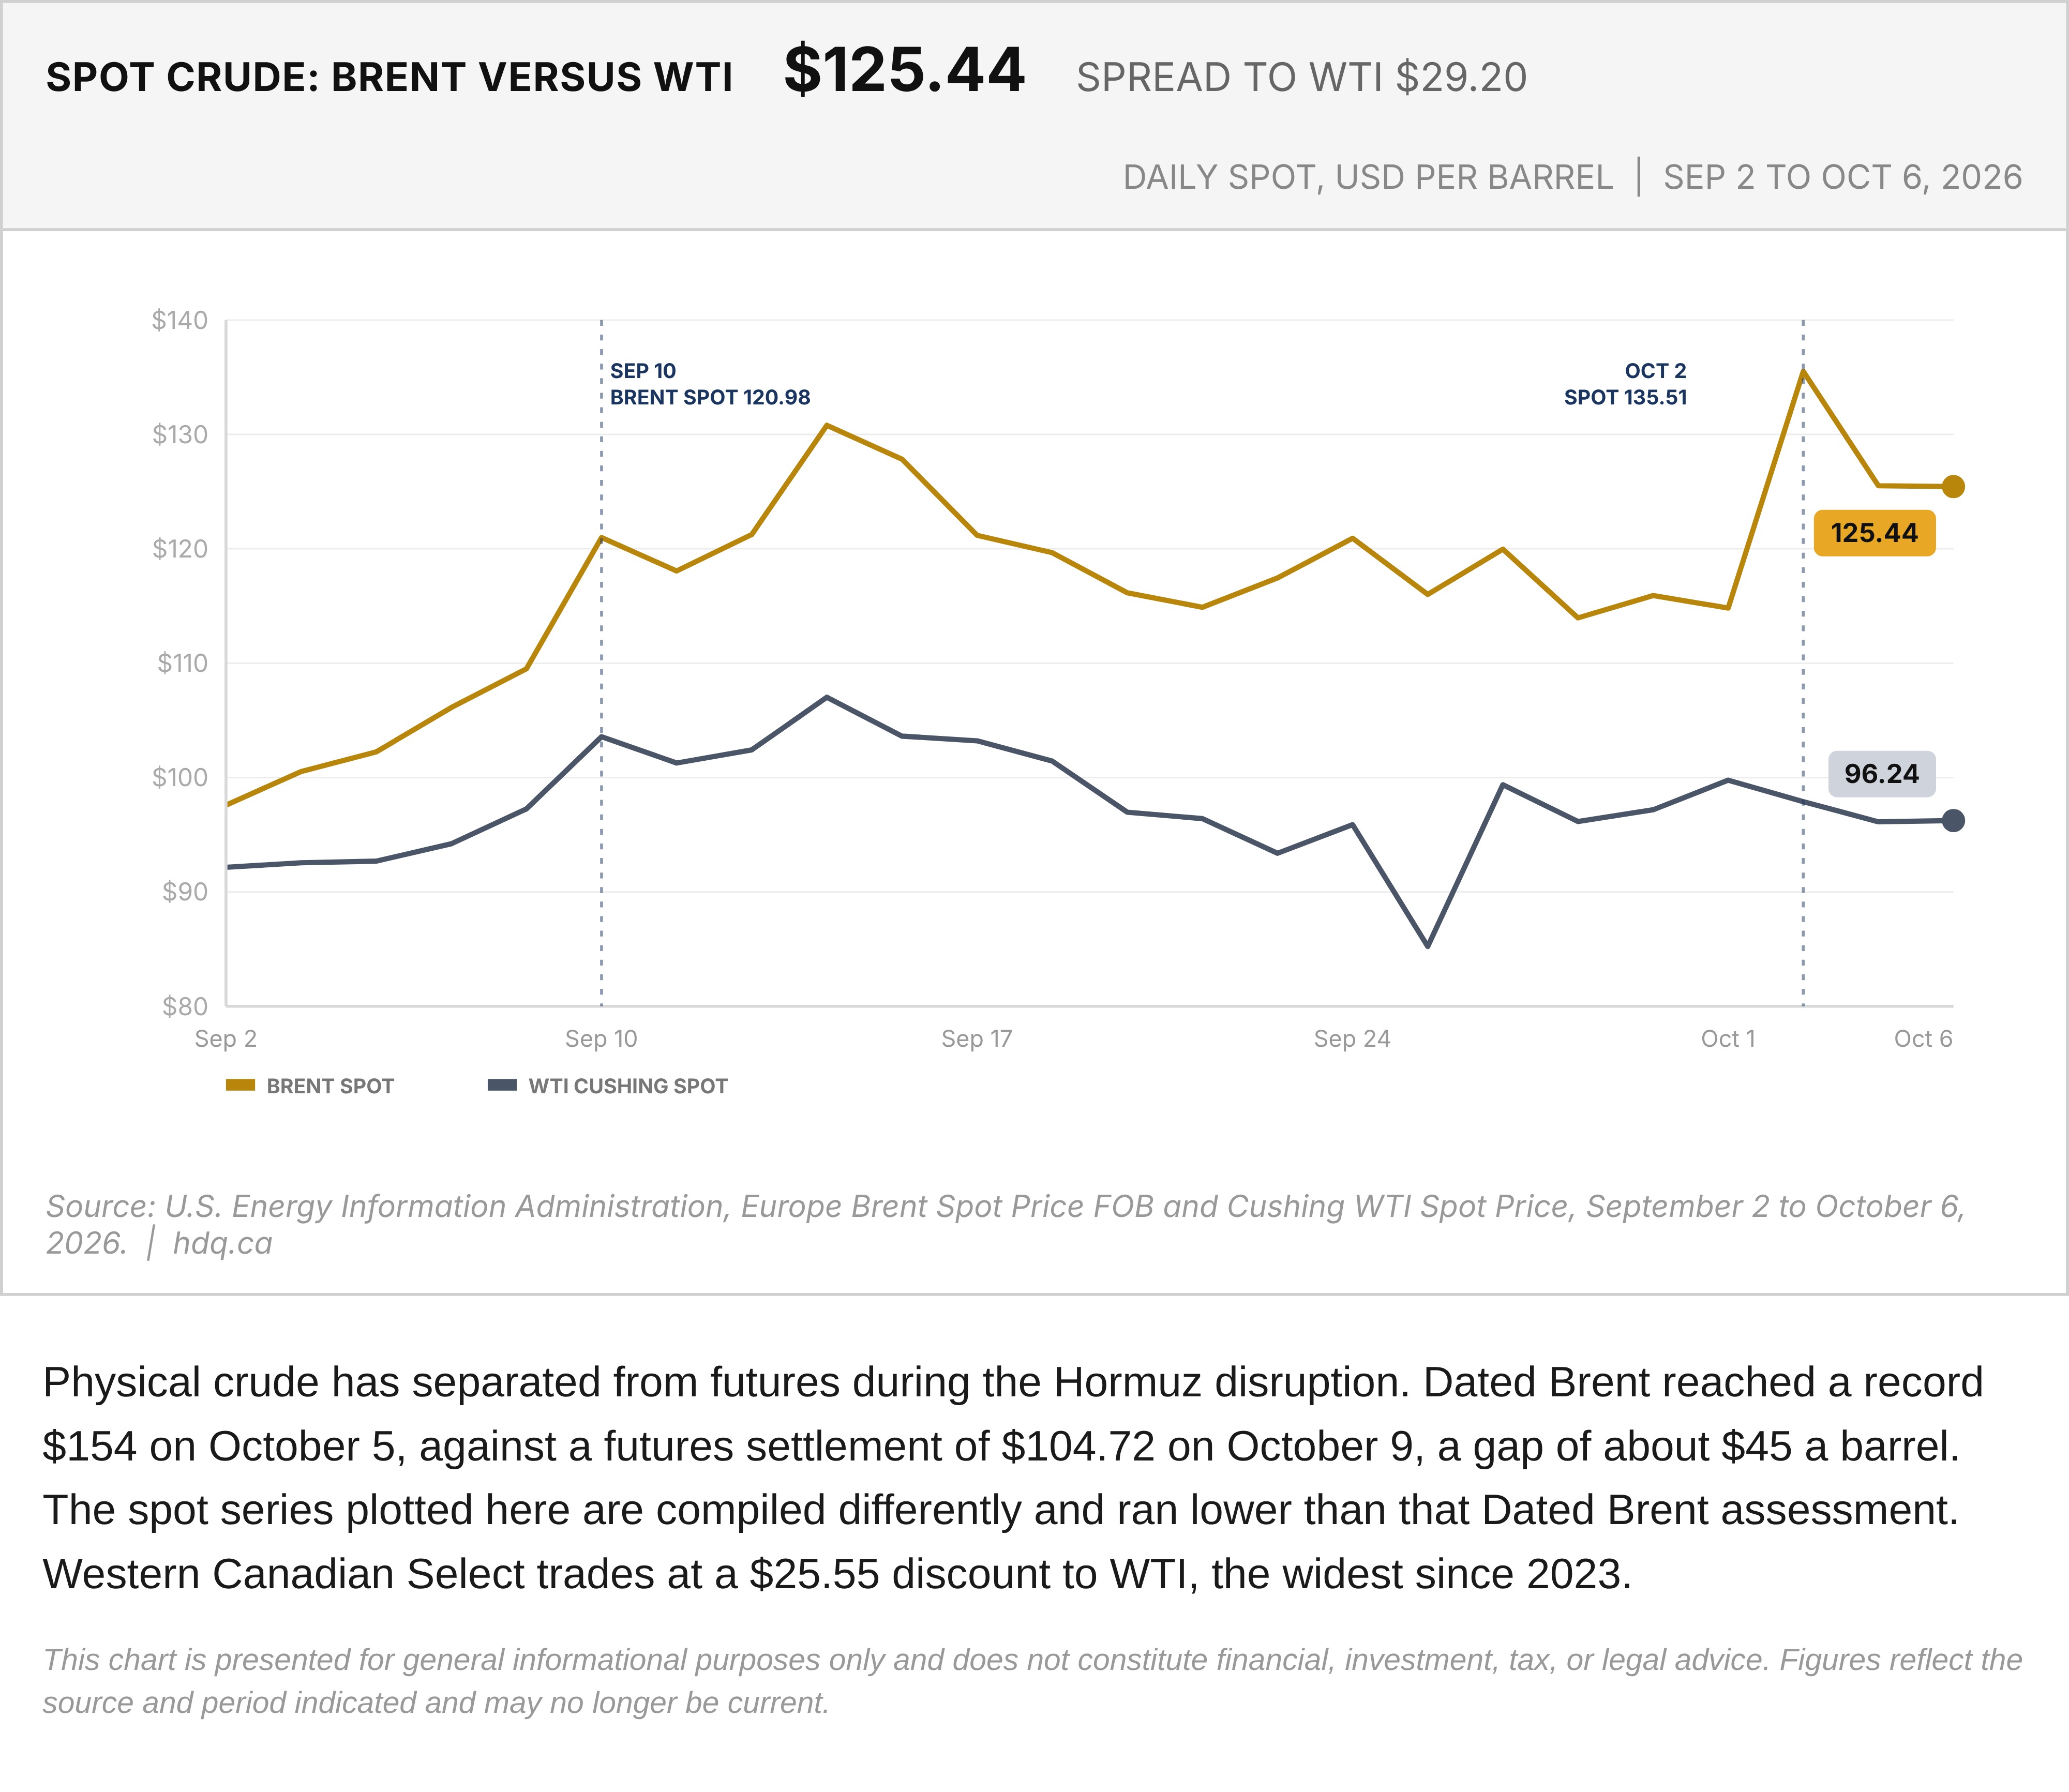
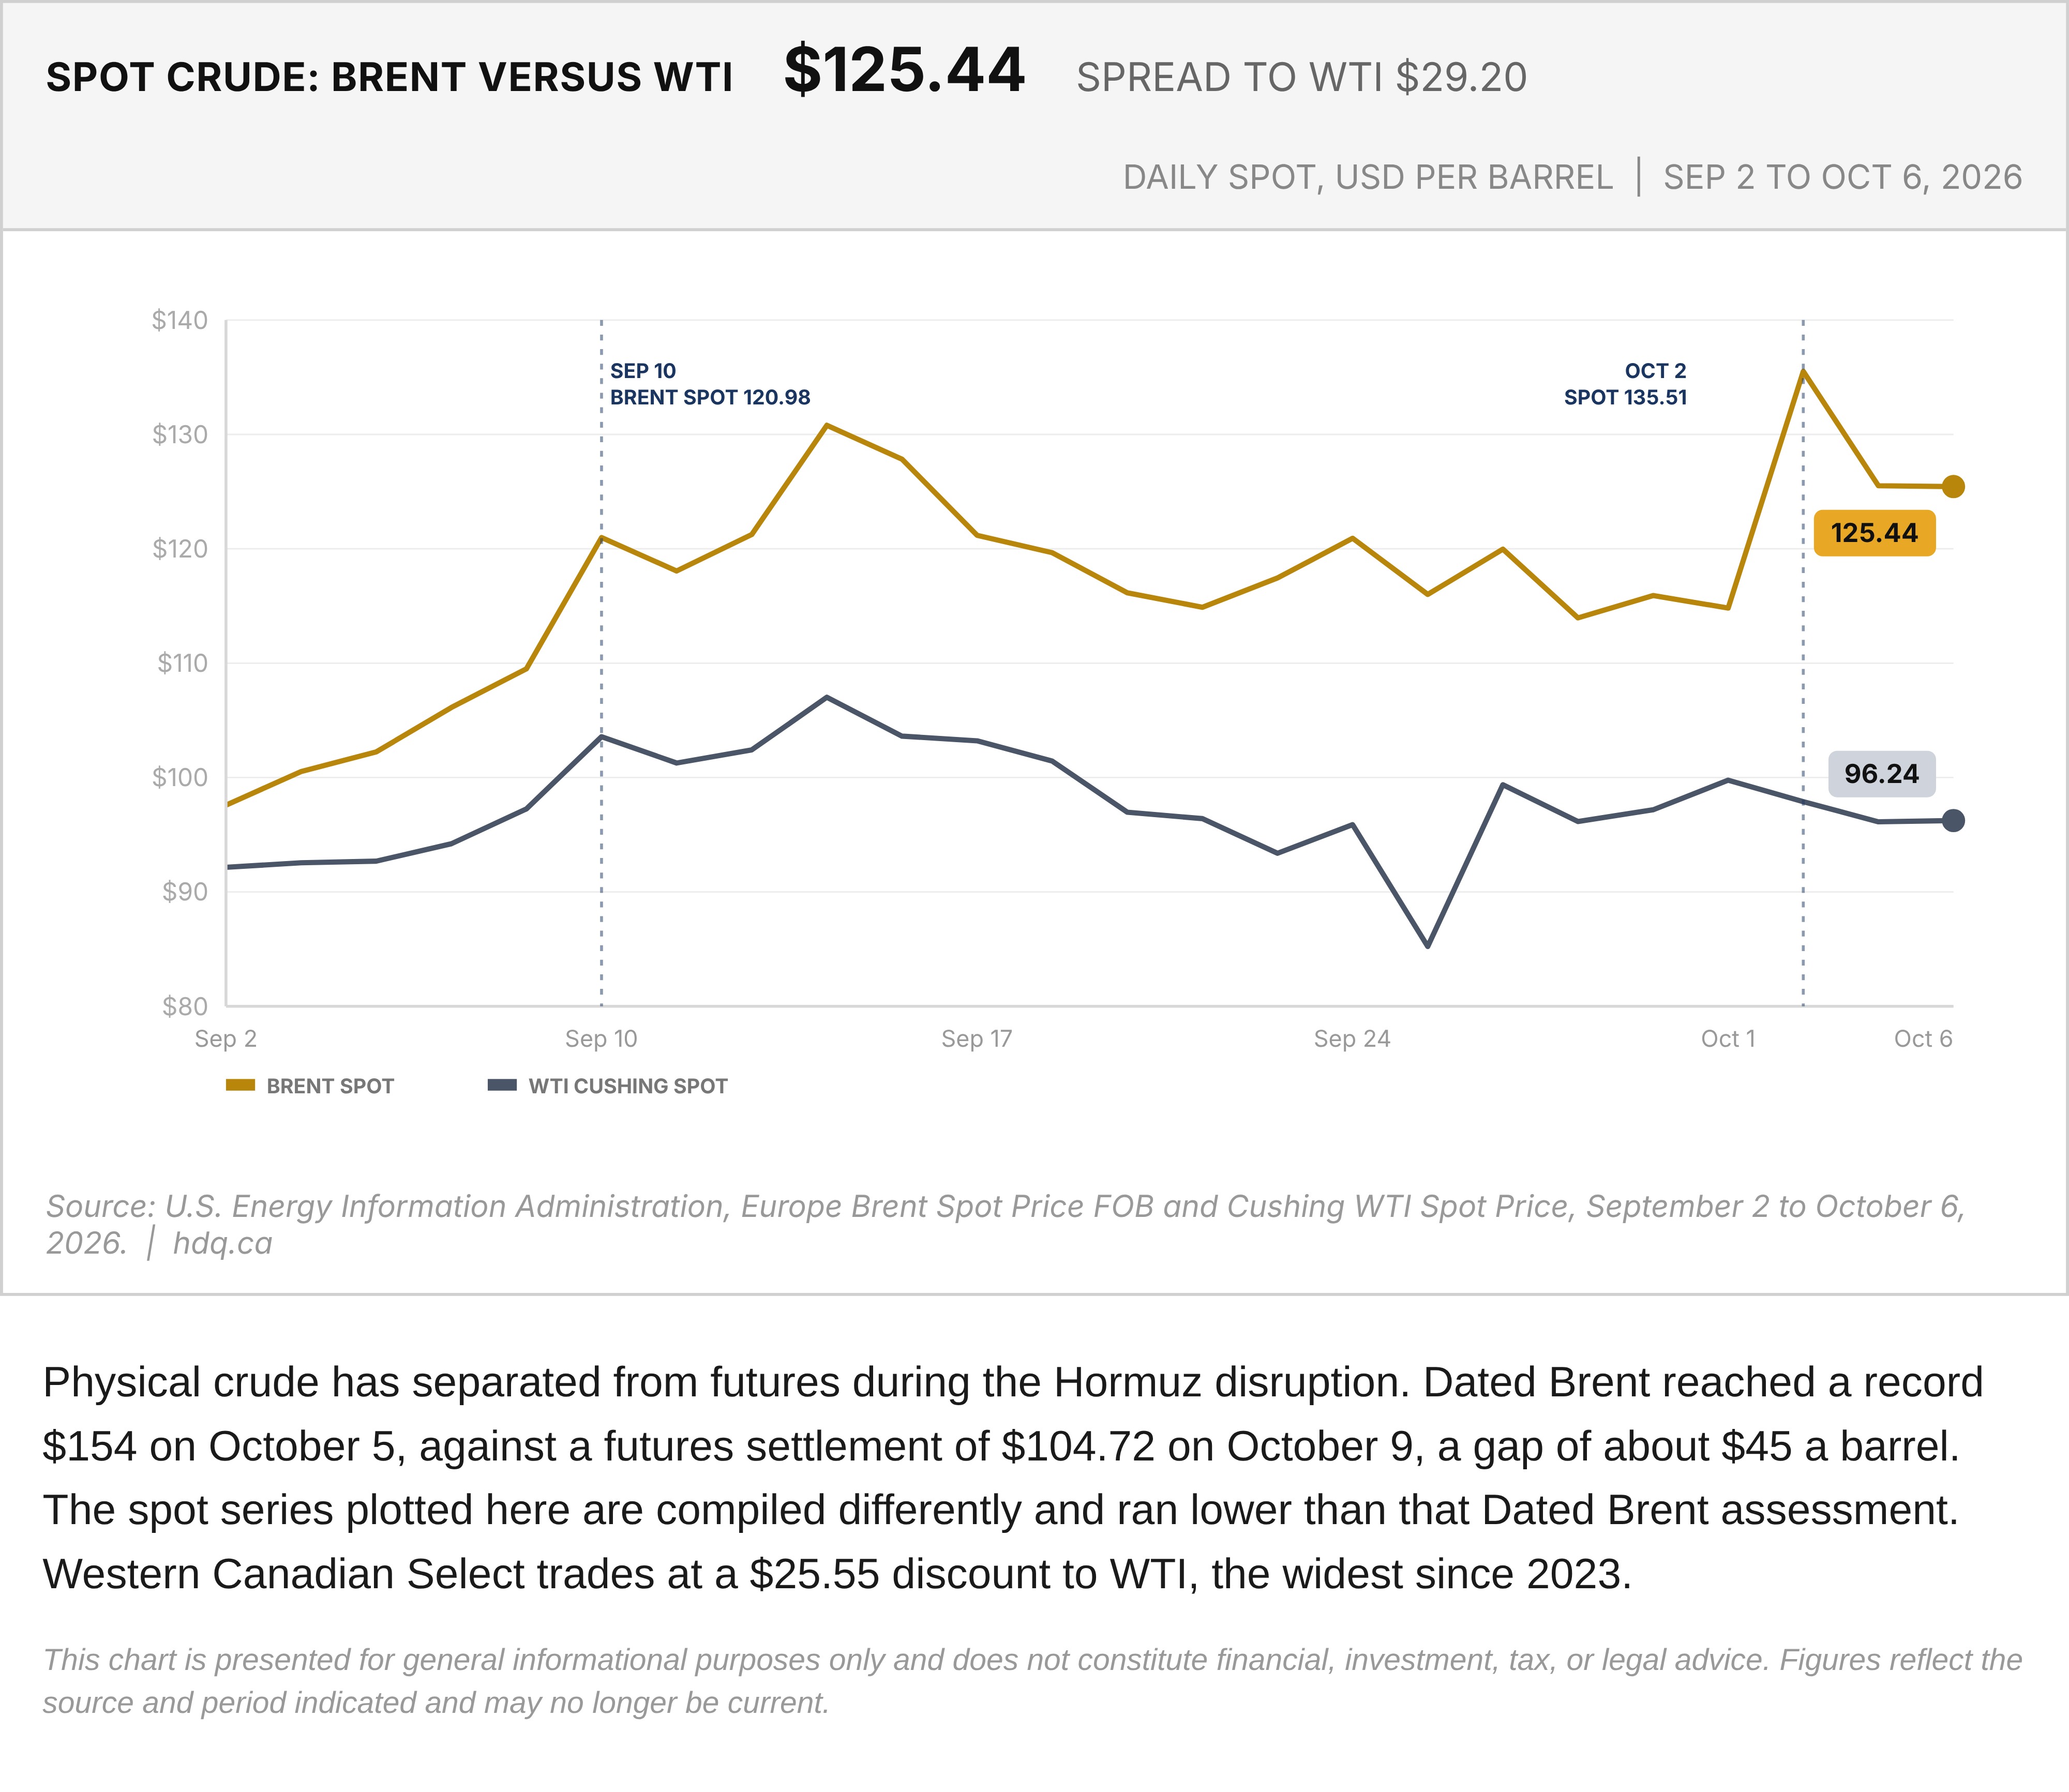
Physical crude has separated from futures during the Hormuz disruption. Dated Brent reached a record $154 on October 5, against a futures settlement of $104.72 on October 9, a gap of about $45 a barrel. The spot series plotted here are compiled differently and ran lower than that Dated Brent assessment. Western Canadian Select trades at a $25.55 discount to WTI, the widest since 2023.
This chart is presented for general informational purposes only and does not constitute financial, investment, tax, or legal advice. Figures reflect the source and period indicated and may no longer be current.
Related charts
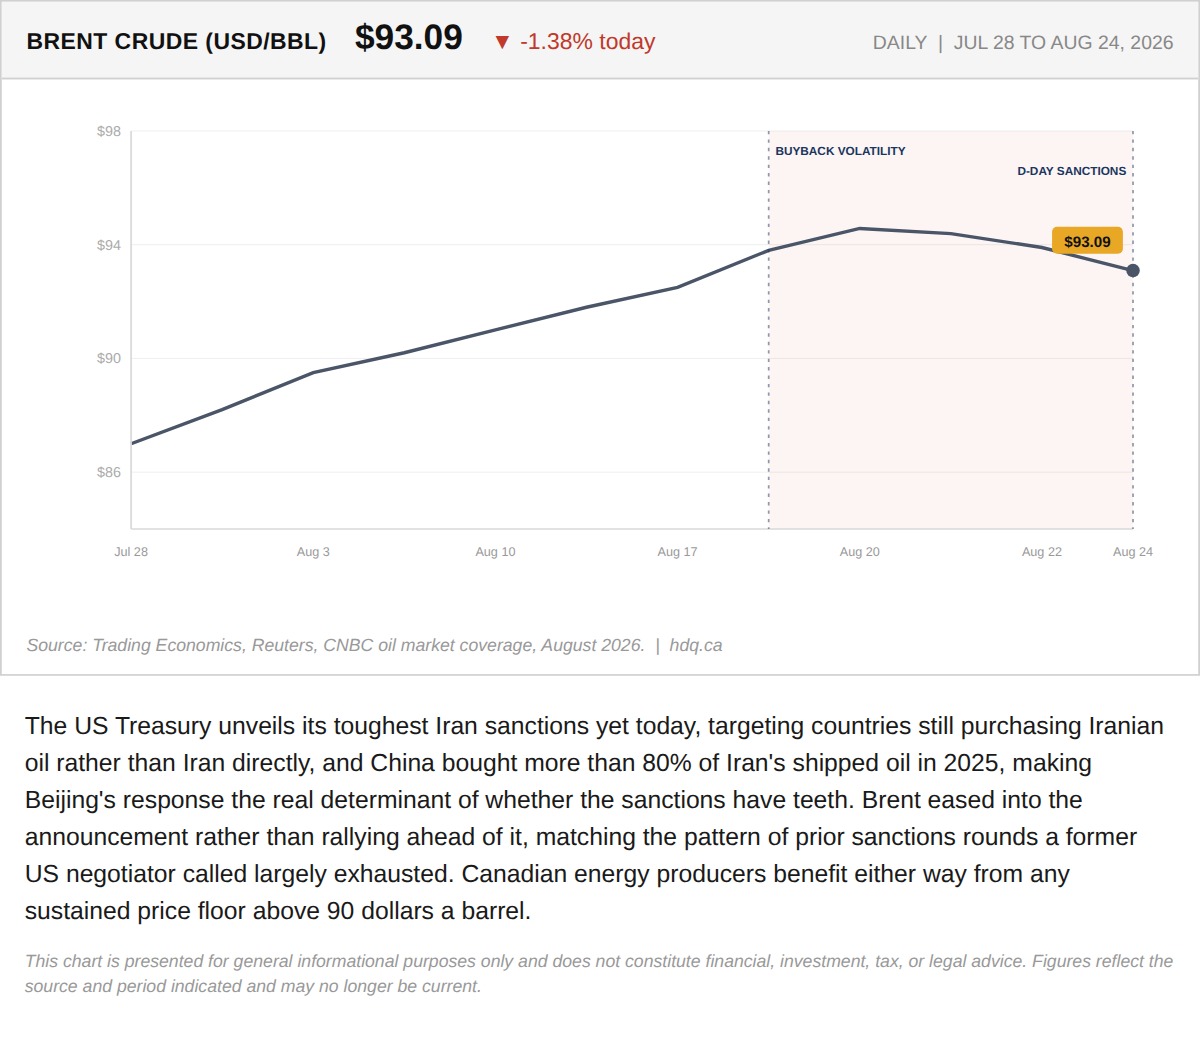
The US Treasury unveils its toughest Iran sanctions yet today, targeting countries still purchasing Iranian oil rather than Iran directly,…
Oil Is Pulling Back Into the Toughest Iran Sanctions Yet, and That's the Signal
August 24, 2026
View chart & download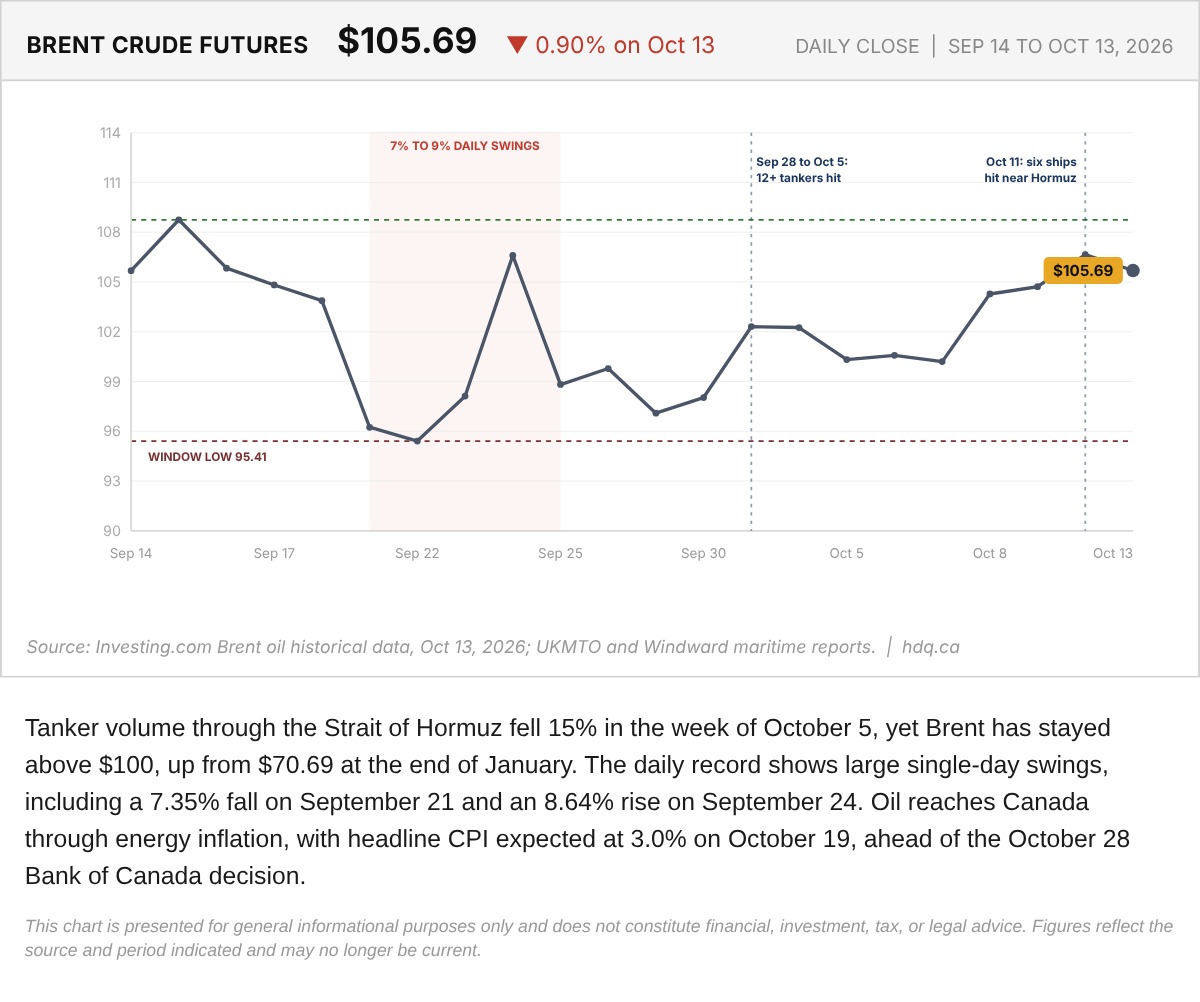
Tanker volume through the Strait of Hormuz fell 15% in the week of October 5, yet Brent has stayed above $100, up from $70.69 at the end of January.
Brent Crude Oil Futures, September 14 to October 13, 2026
October 13, 2026
View chart & download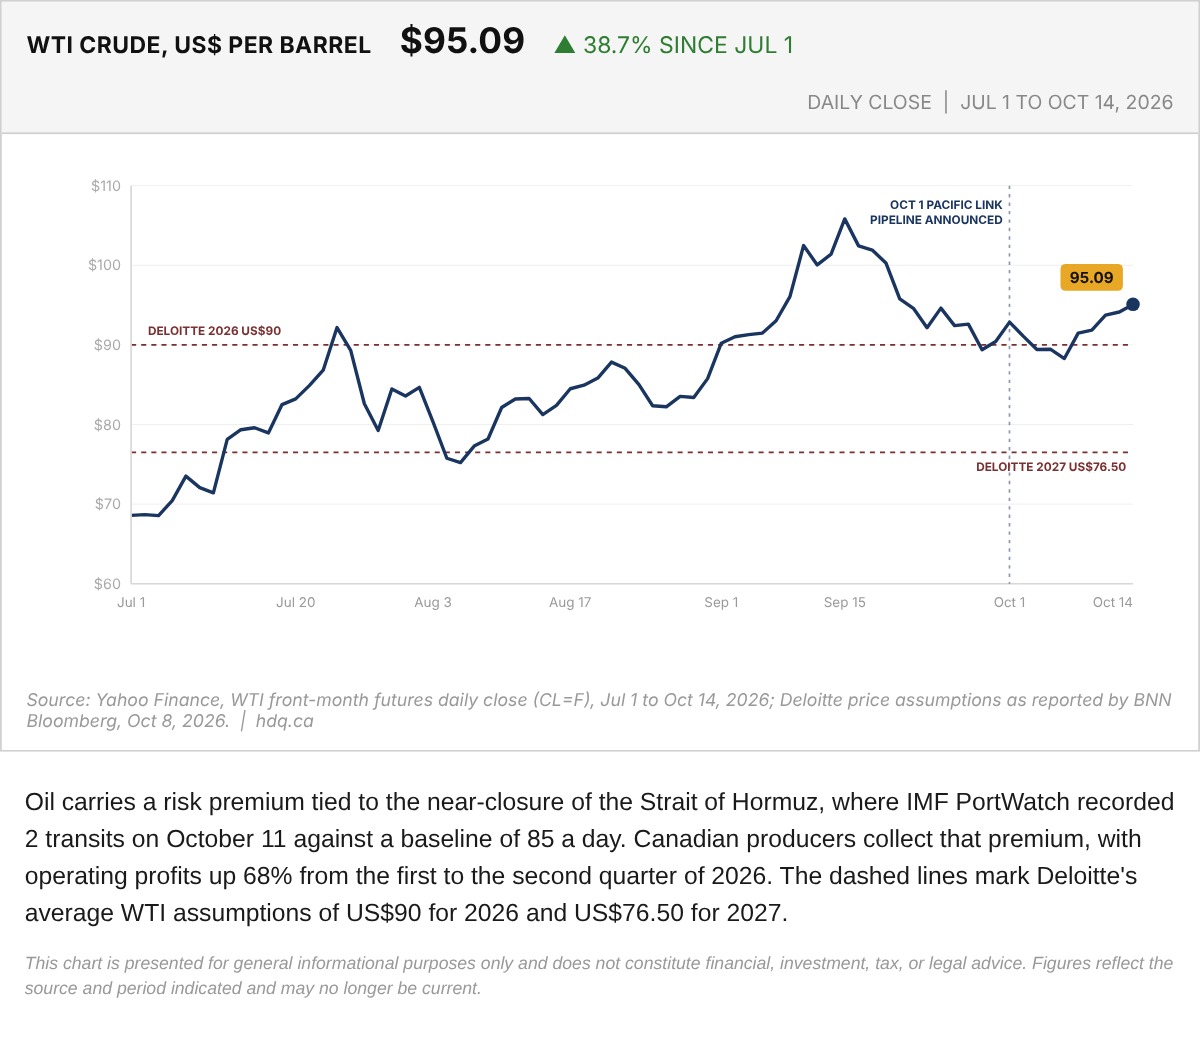
Oil carries a risk premium tied to the near-closure of the Strait of Hormuz, where IMF PortWatch recorded 2 transits on October 11 against a baseline of 85 a day.
WTI Crude Oil Price, July 1 to October 14, 2026
October 14, 2026
View chart & download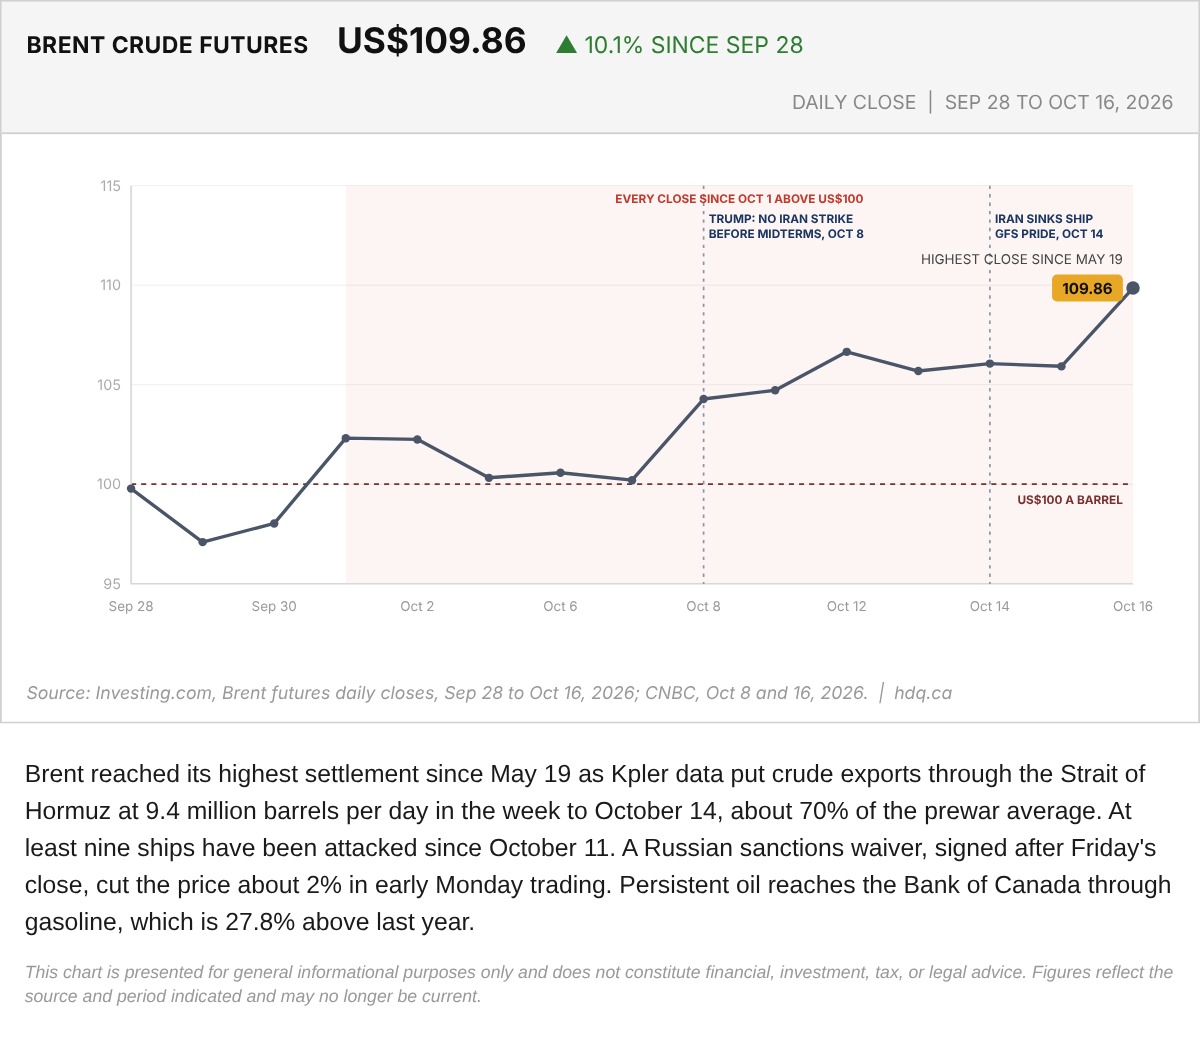
Brent reached its highest settlement since May 19 as Kpler data put crude exports through the Strait of Hormuz at 9.4 million barrels per…
Brent Crude Oil Futures, September 28 to October 16, 2026
October 16, 2026
View chart & download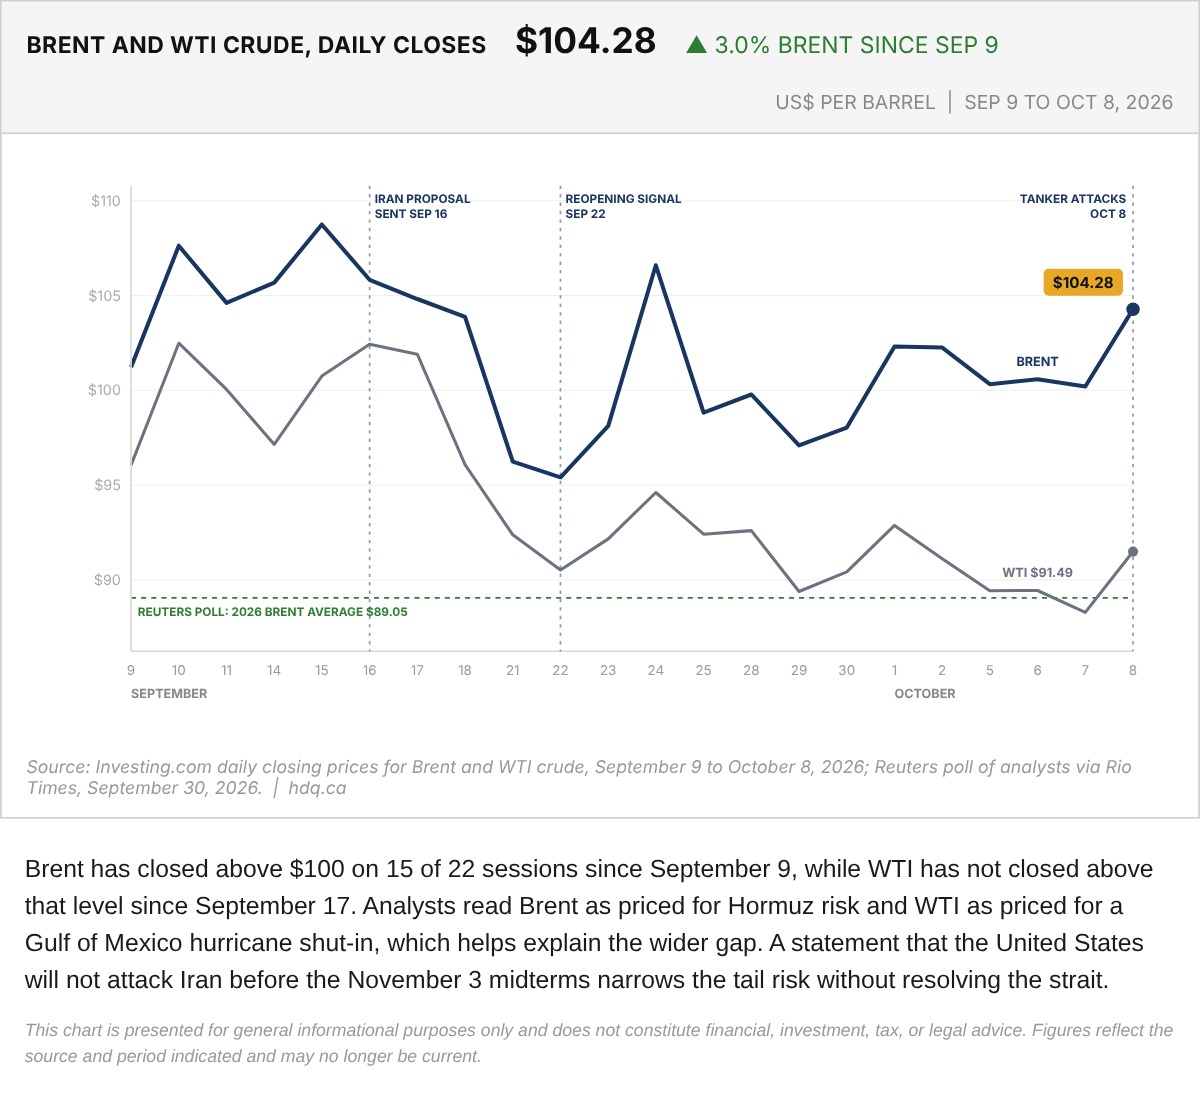
Brent has closed above $100 on 15 of 22 sessions since September 9, while WTI has not closed above that level since September 17.
Brent and WTI Crude Daily Closes, September 9 to October 8
October 9, 2026
View chart & download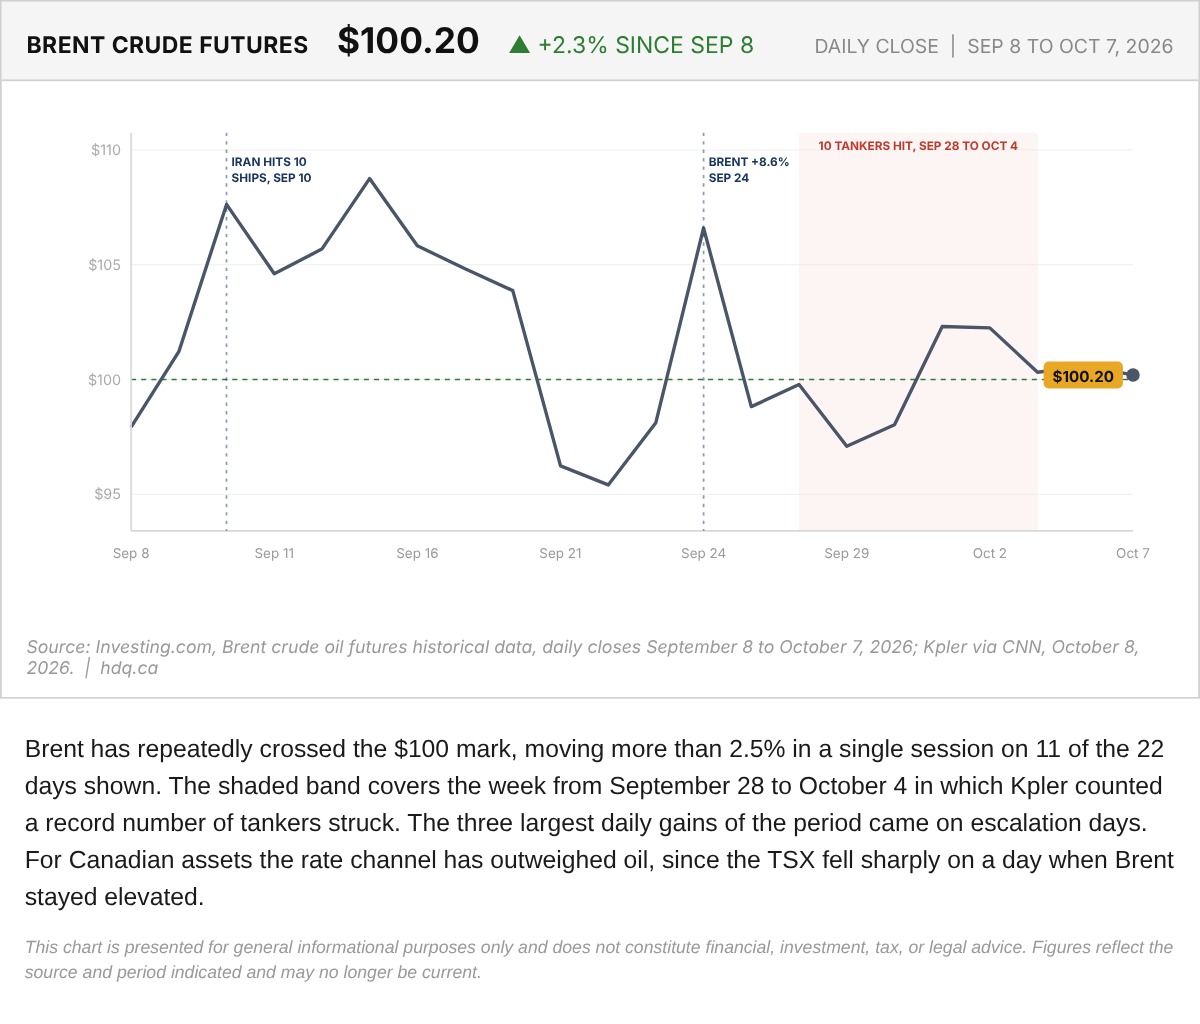
Brent has repeatedly crossed the $100 mark, moving more than 2.5% in a single session on 11 of the 22 days shown.
Brent Crude Futures Daily Close, September 8 to October 7
October 8, 2026
View chart & download