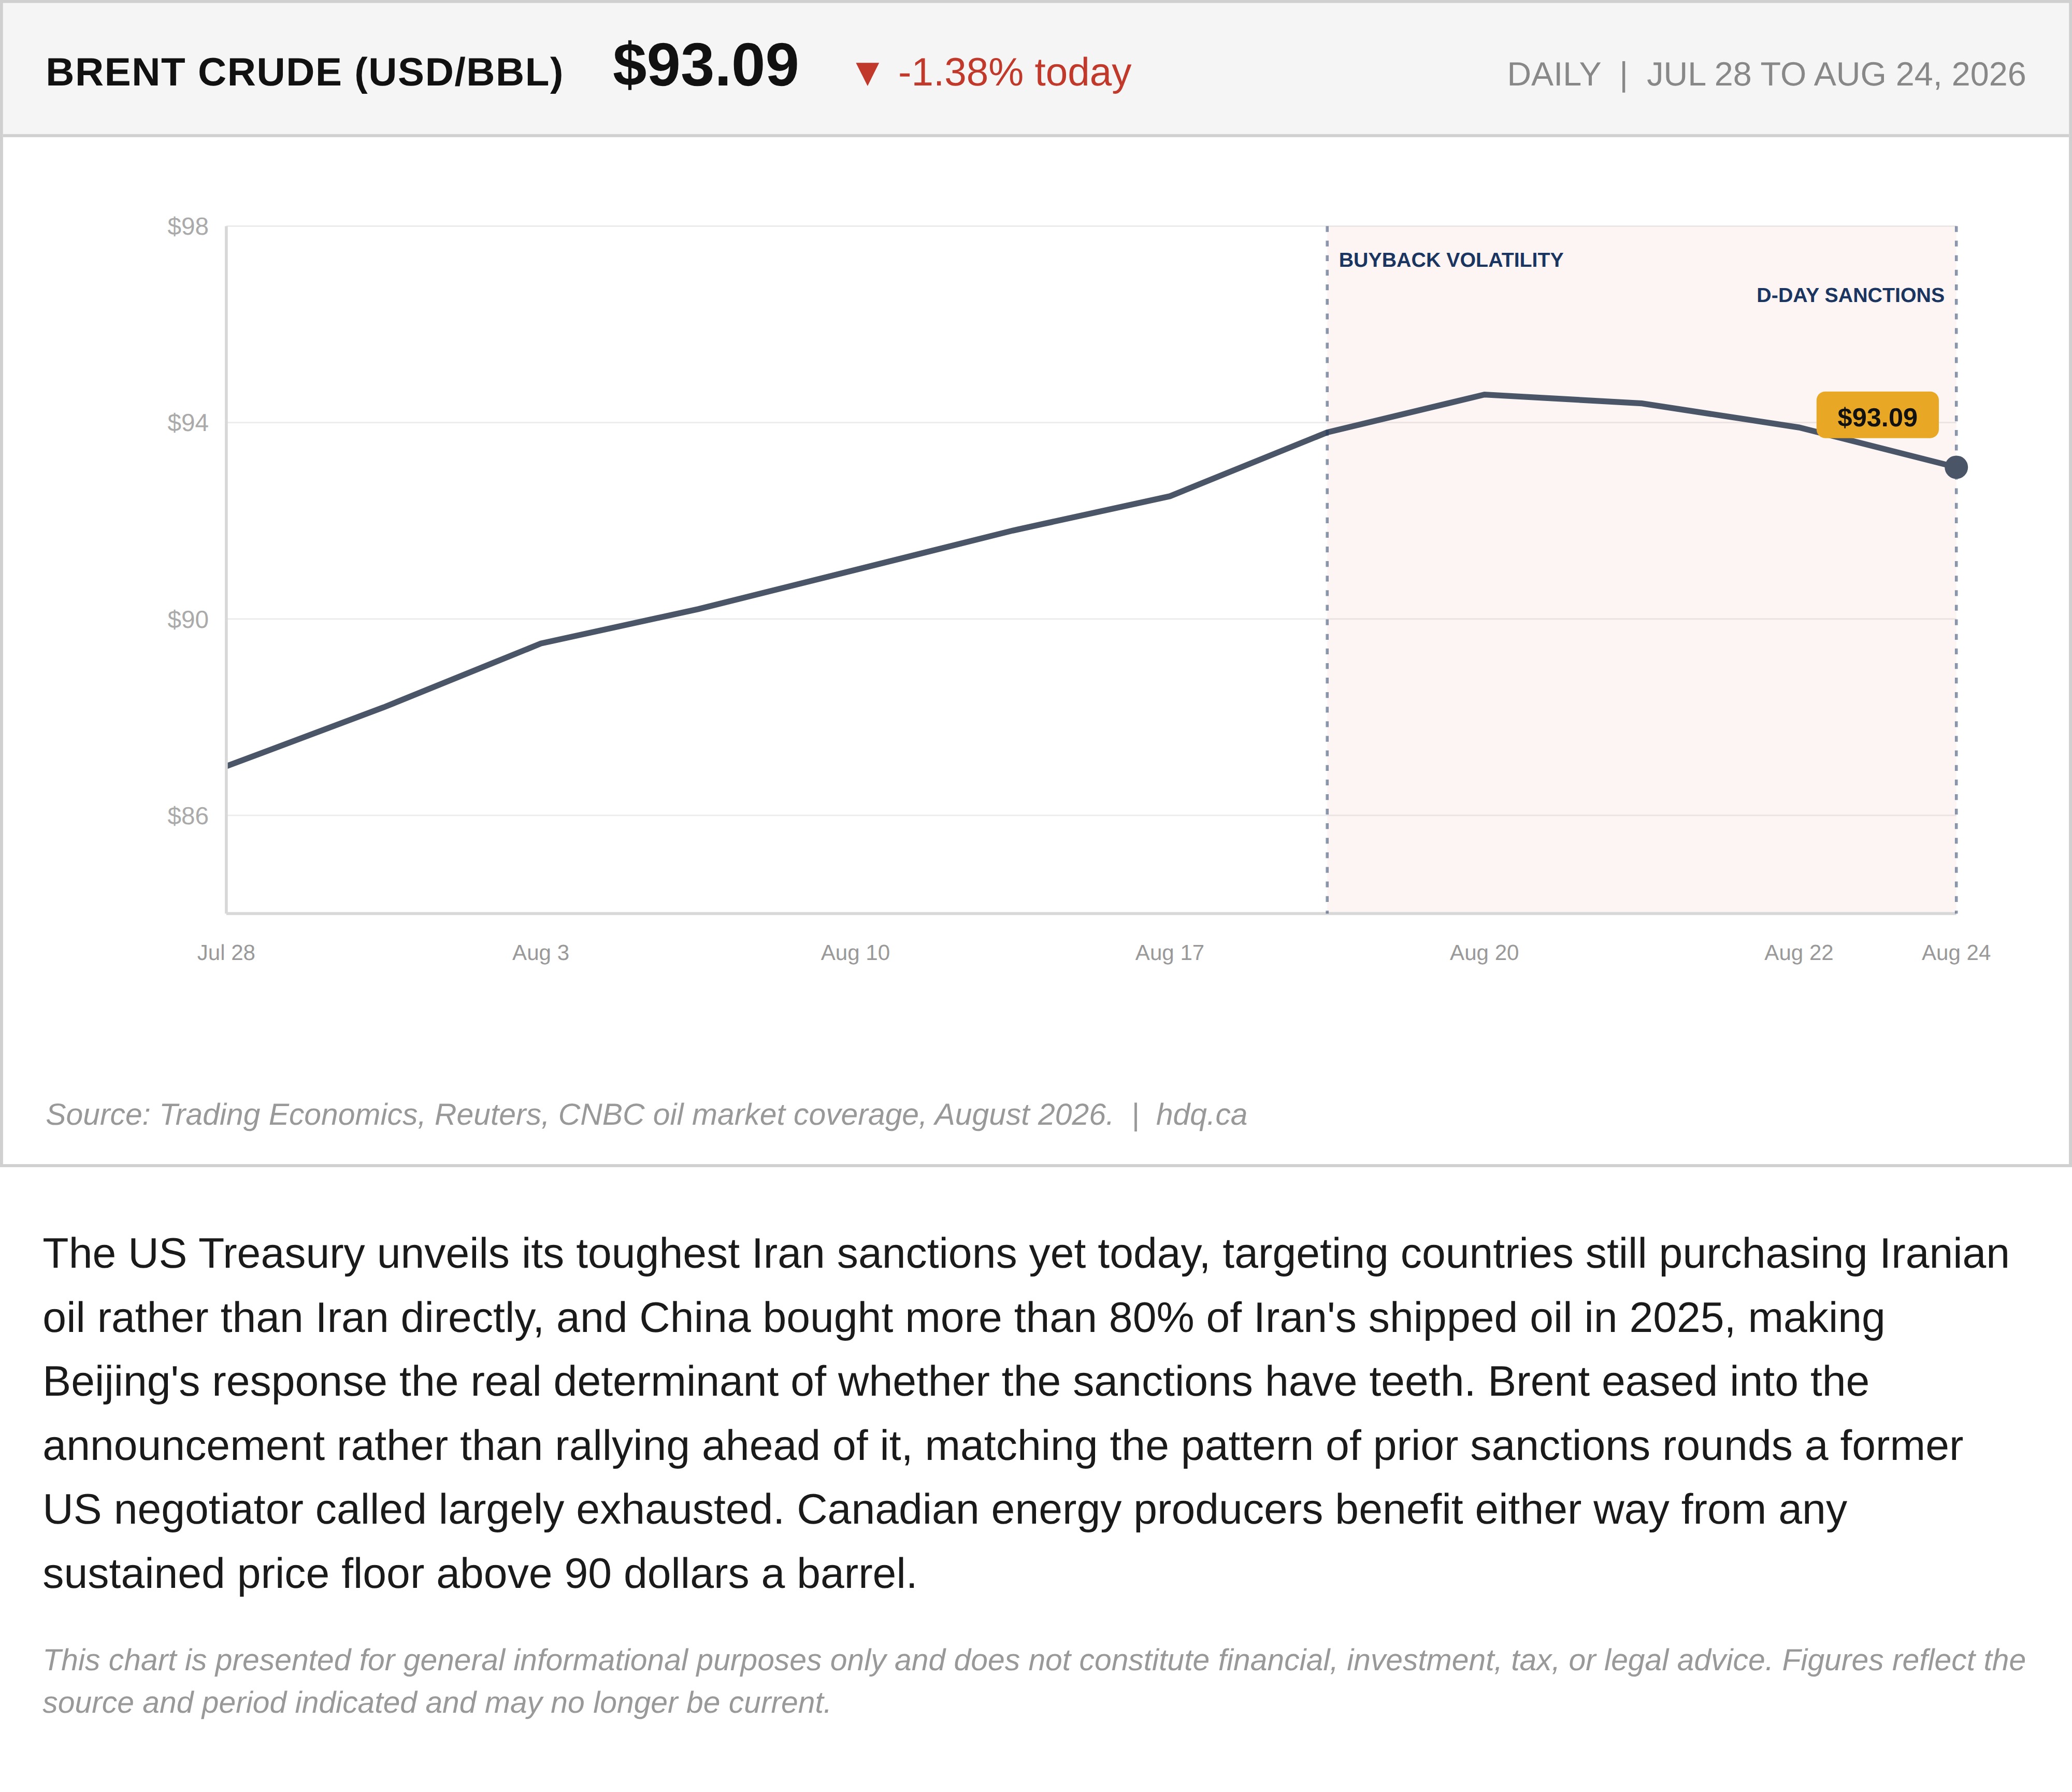
The US Treasury unveils its toughest Iran sanctions yet today, targeting countries still purchasing Iranian oil rather than Iran directly, and China bought more than 80% of Iran's shipped oil in 2025, making Beijing's response the real determinant of whether the sanctions have teeth. Brent eased into the announcement rather than rallying ahead of it, matching the pattern of prior sanctions rounds a former US negotiator called largely exhausted. Canadian energy producers benefit either way from any sustained price floor above 90 dollars a barrel.
This chart is presented for general informational purposes only and does not constitute financial, investment, tax, or legal advice. Figures reflect the source and period indicated and may no longer be current.
Related charts
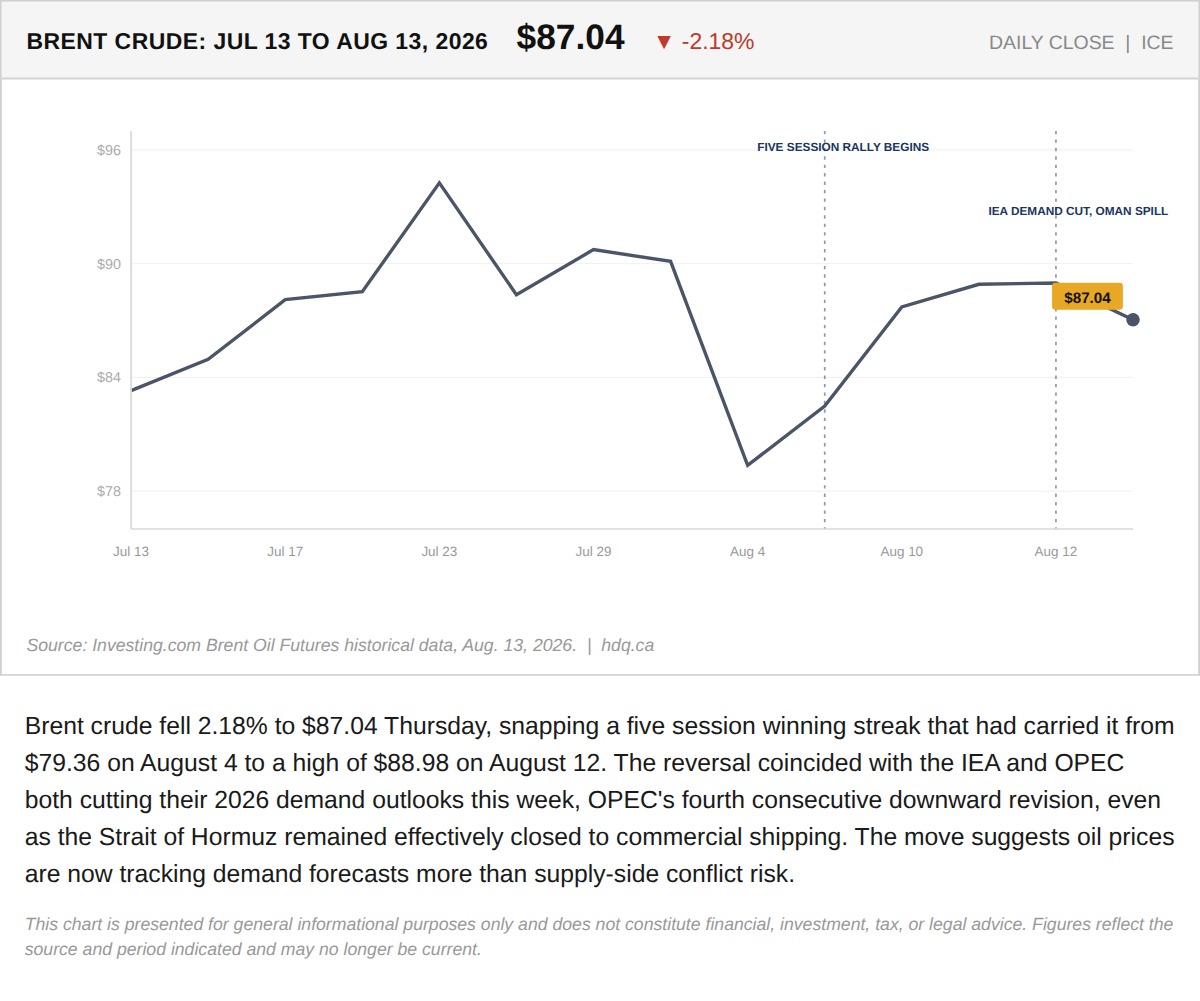
Brent crude fell 2.18% to $87.04 Thursday, snapping a five session winning streak that had carried it from $79.36 on August 4 to a high of $88.98 on August 12.
Oil Fell This Week. The Hormuz Rhetoric Didn't.
August 14, 2026
View chart & download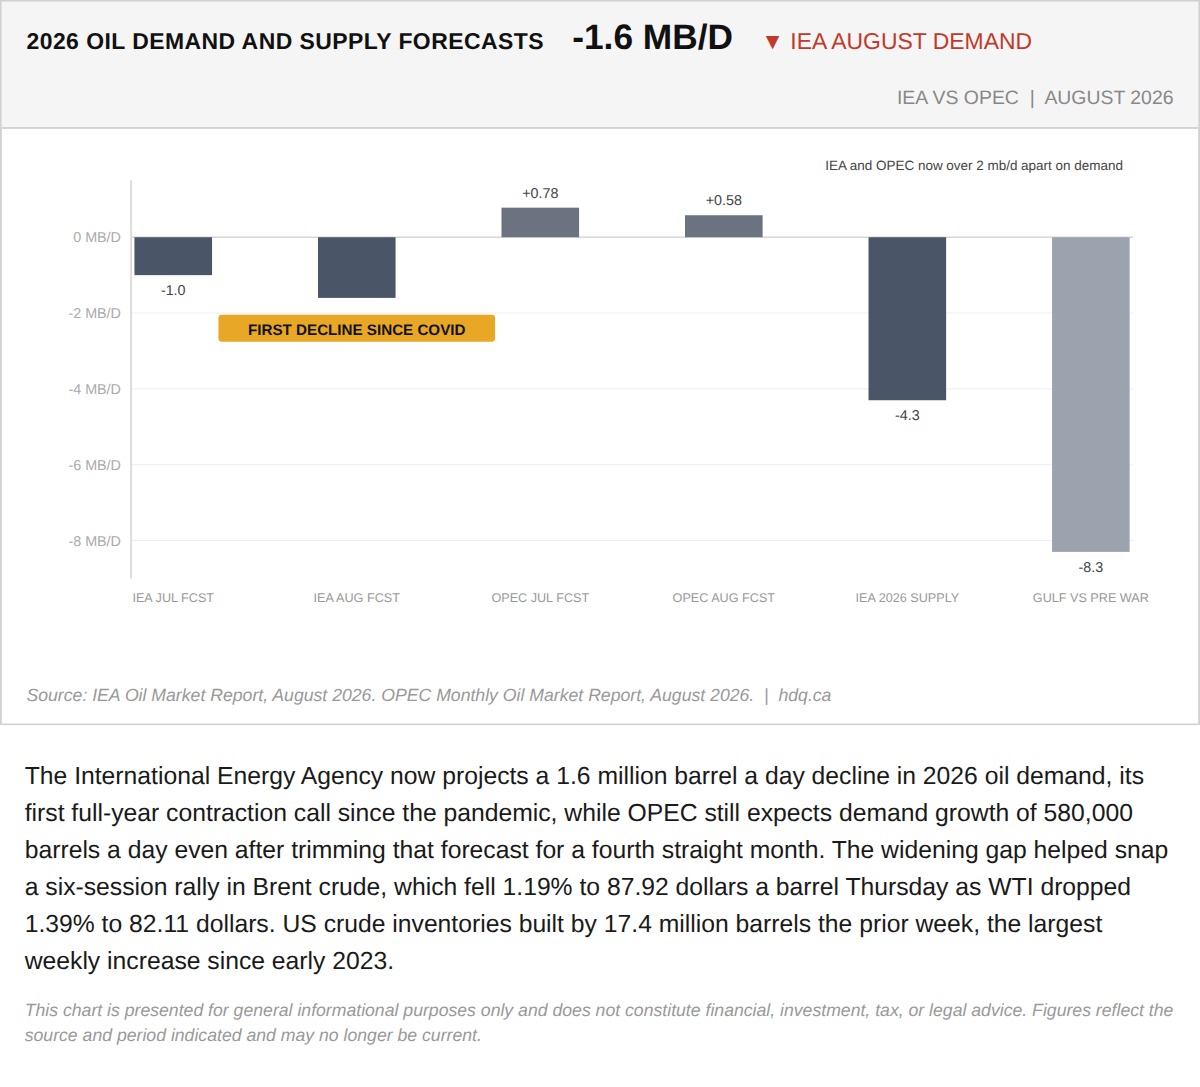
The International Energy Agency now projects a 1.6 million barrel a day decline in 2026 oil demand, its first full-year contraction call…
The IEA and OPEC Are Now Two Million Barrels Apart on Oil Demand
August 13, 2026
View chart & download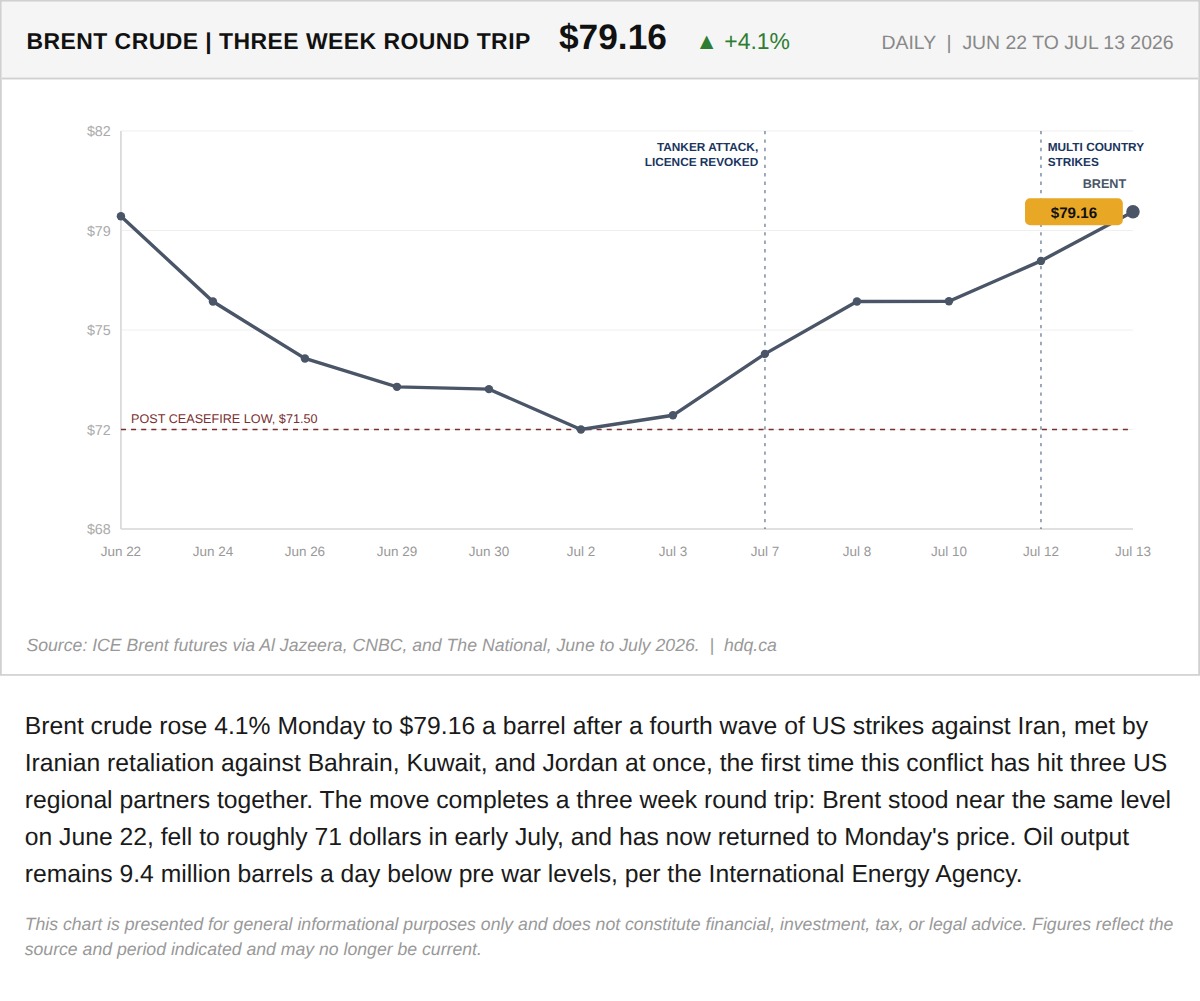
Brent crude rose 4.1% Monday to $79.16 a barrel after a fourth wave of US strikes against Iran, met by Iranian retaliation against Bahrain,…
July 13, 2026
View chart & download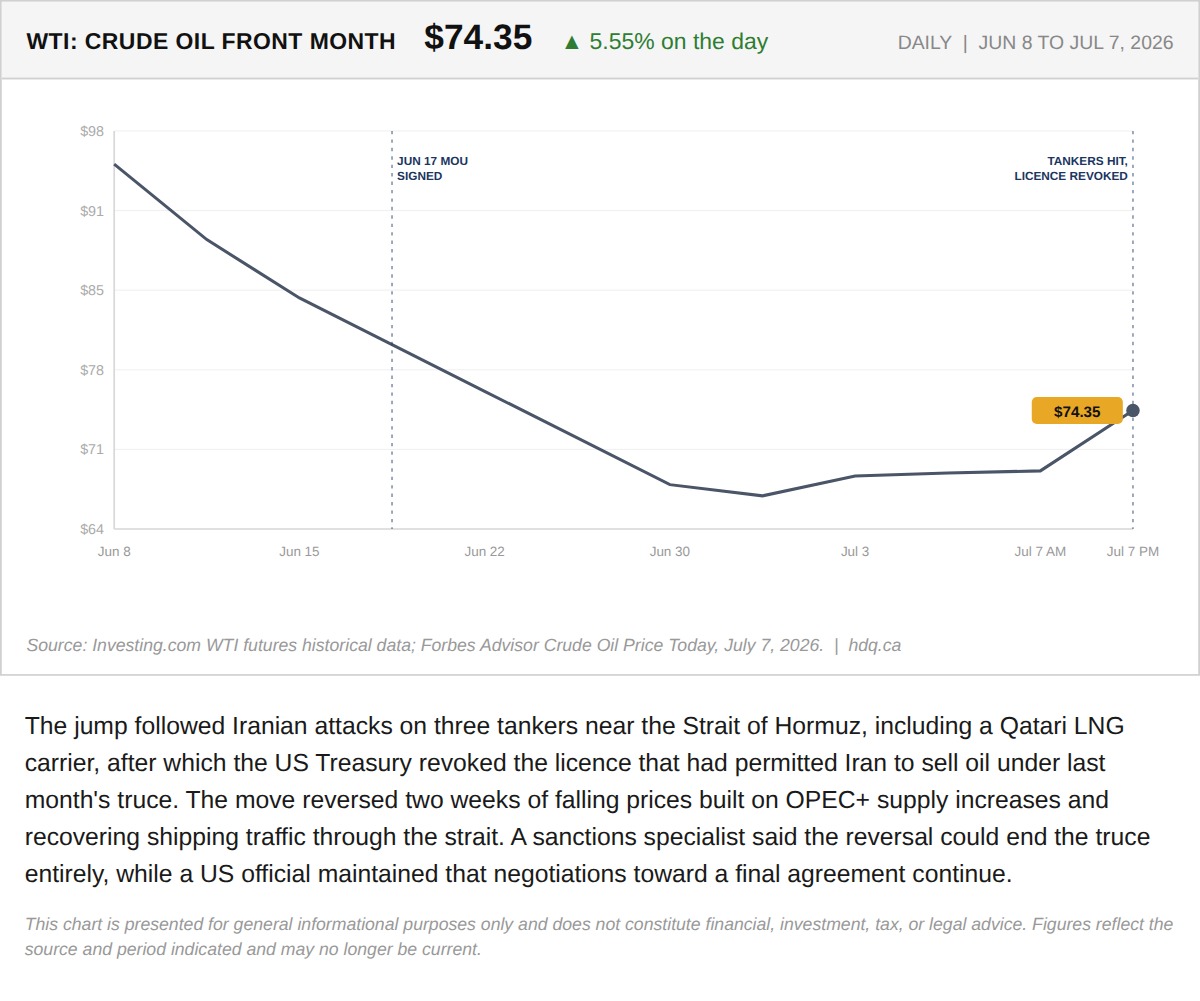
The jump followed Iranian attacks on three tankers near the Strait of Hormuz, including a Qatari LNG carrier, after which the US Treasury…
July 8, 2026
View chart & download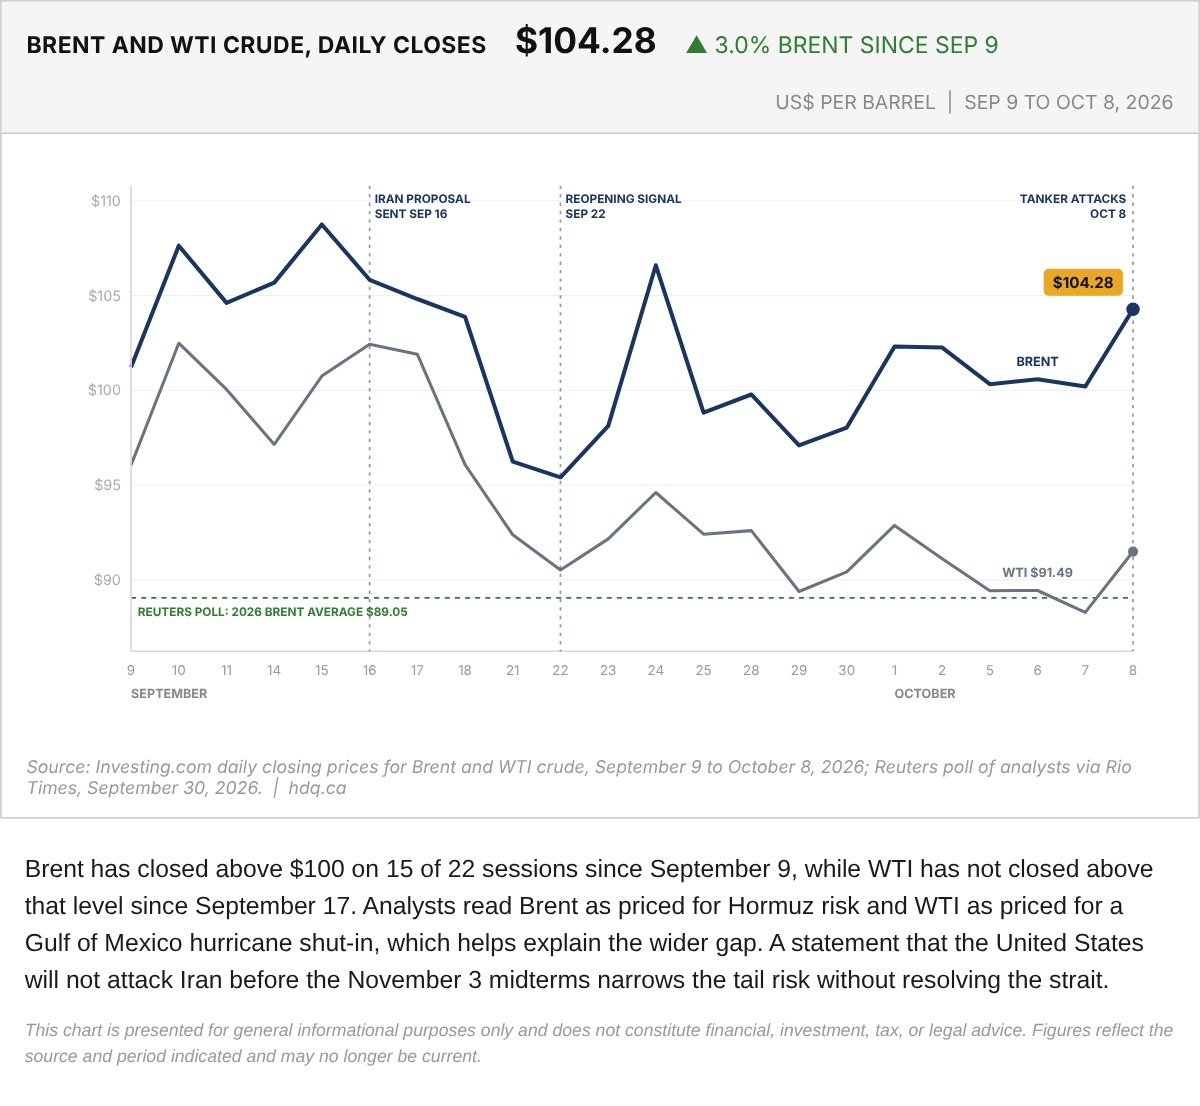
Brent has closed above $100 on 15 of 22 sessions since September 9, while WTI has not closed above that level since September 17.
Brent and WTI Crude Daily Closes, September 9 to October 8
October 9, 2026
View chart & download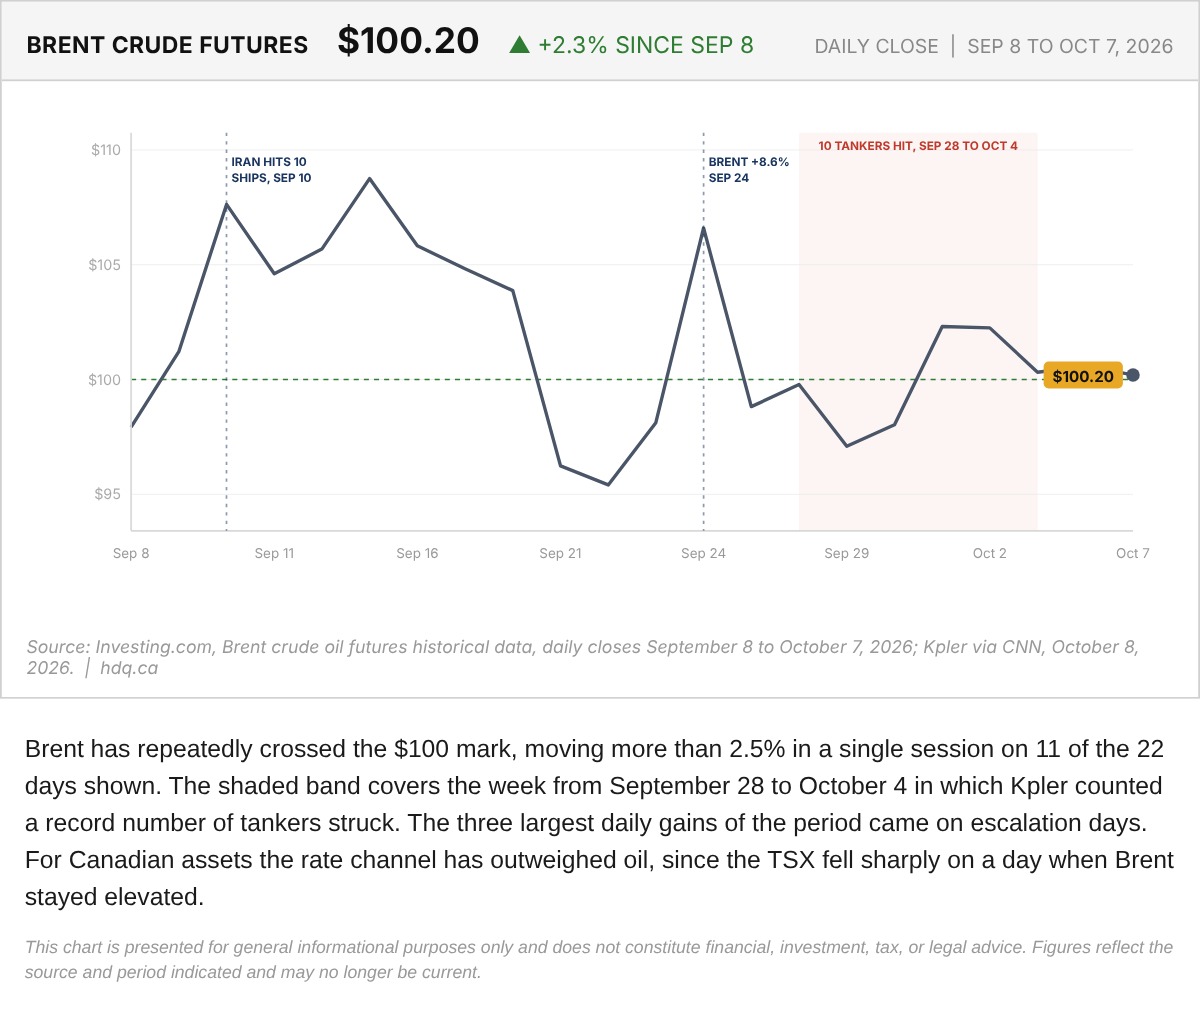
Brent has repeatedly crossed the $100 mark, moving more than 2.5% in a single session on 11 of the 22 days shown.
Brent Crude Futures Daily Close, September 8 to October 7
October 8, 2026
View chart & download