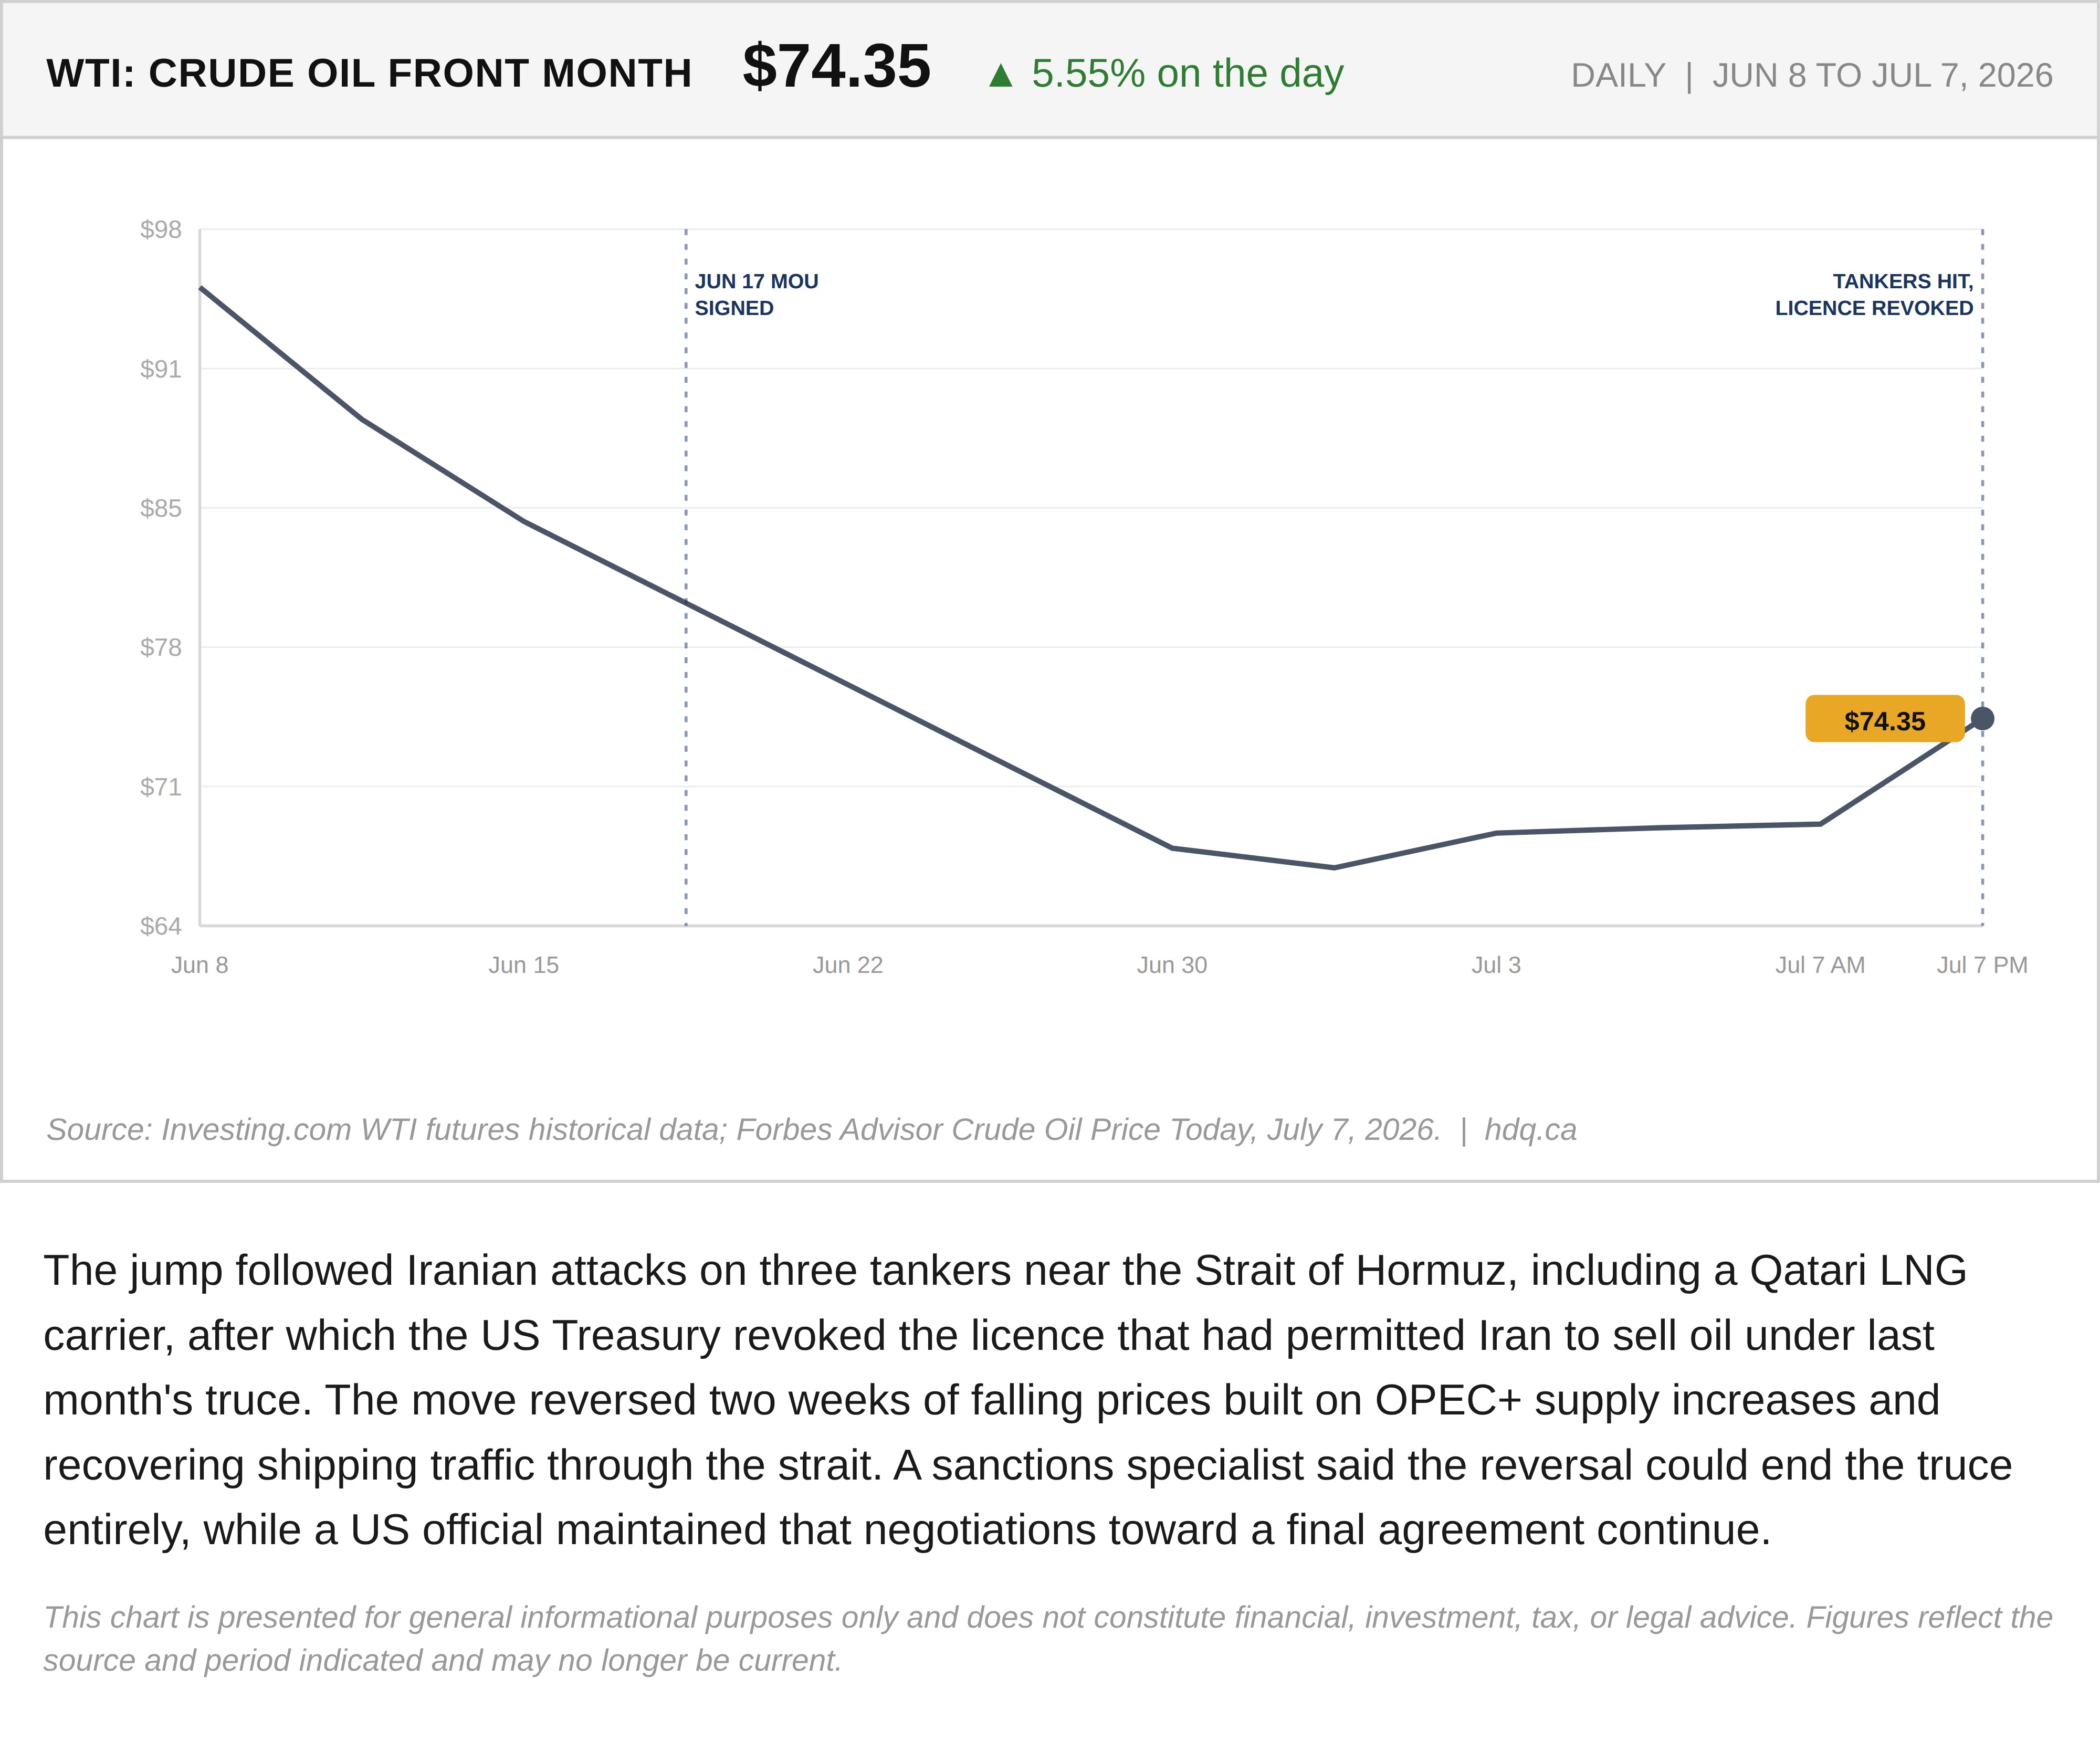
The jump followed Iranian attacks on three tankers near the Strait of Hormuz, including a Qatari LNG carrier, after which the US Treasury revoked the licence that had permitted Iran to sell oil under last month's truce. The move reversed two weeks of falling prices built on OPEC+ supply increases and recovering shipping traffic through the strait. A sanctions specialist said the reversal could end the truce entirely, while a US official maintained that negotiations toward a final agreement continue.
This chart is presented for general informational purposes only and does not constitute financial, investment, tax, or legal advice. Figures reflect the source and period indicated and may no longer be current.

Related charts
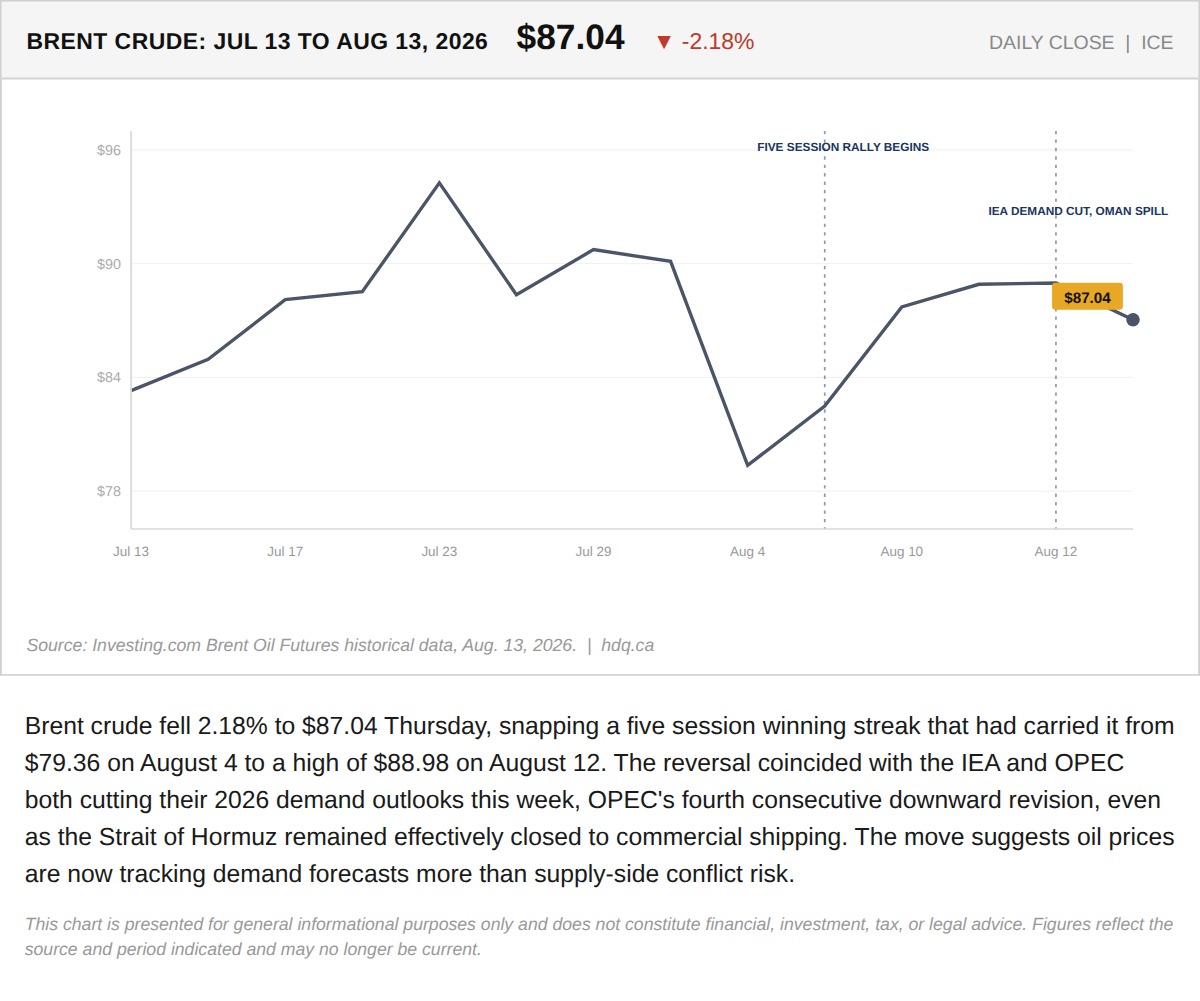
Brent crude fell 2.18% to $87.04 Thursday, snapping a five session winning streak that had carried it from $79.36 on August 4 to a high of $88.98 on August 12.
Oil Fell This Week. The Hormuz Rhetoric Didn't.
August 14, 2026
View chart & download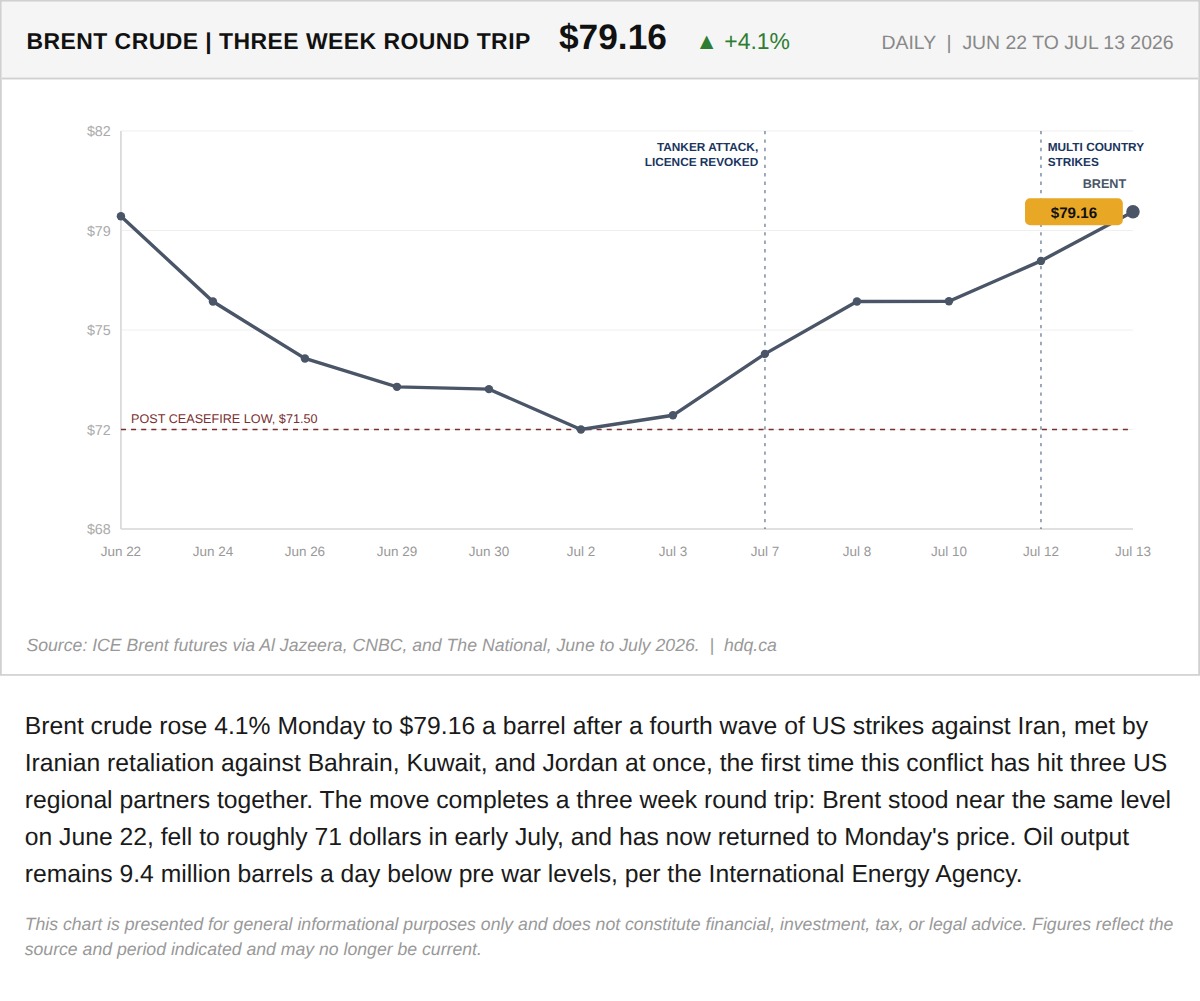
Brent crude rose 4.1% Monday to $79.16 a barrel after a fourth wave of US strikes against Iran, met by Iranian retaliation against Bahrain,…
July 13, 2026
View chart & download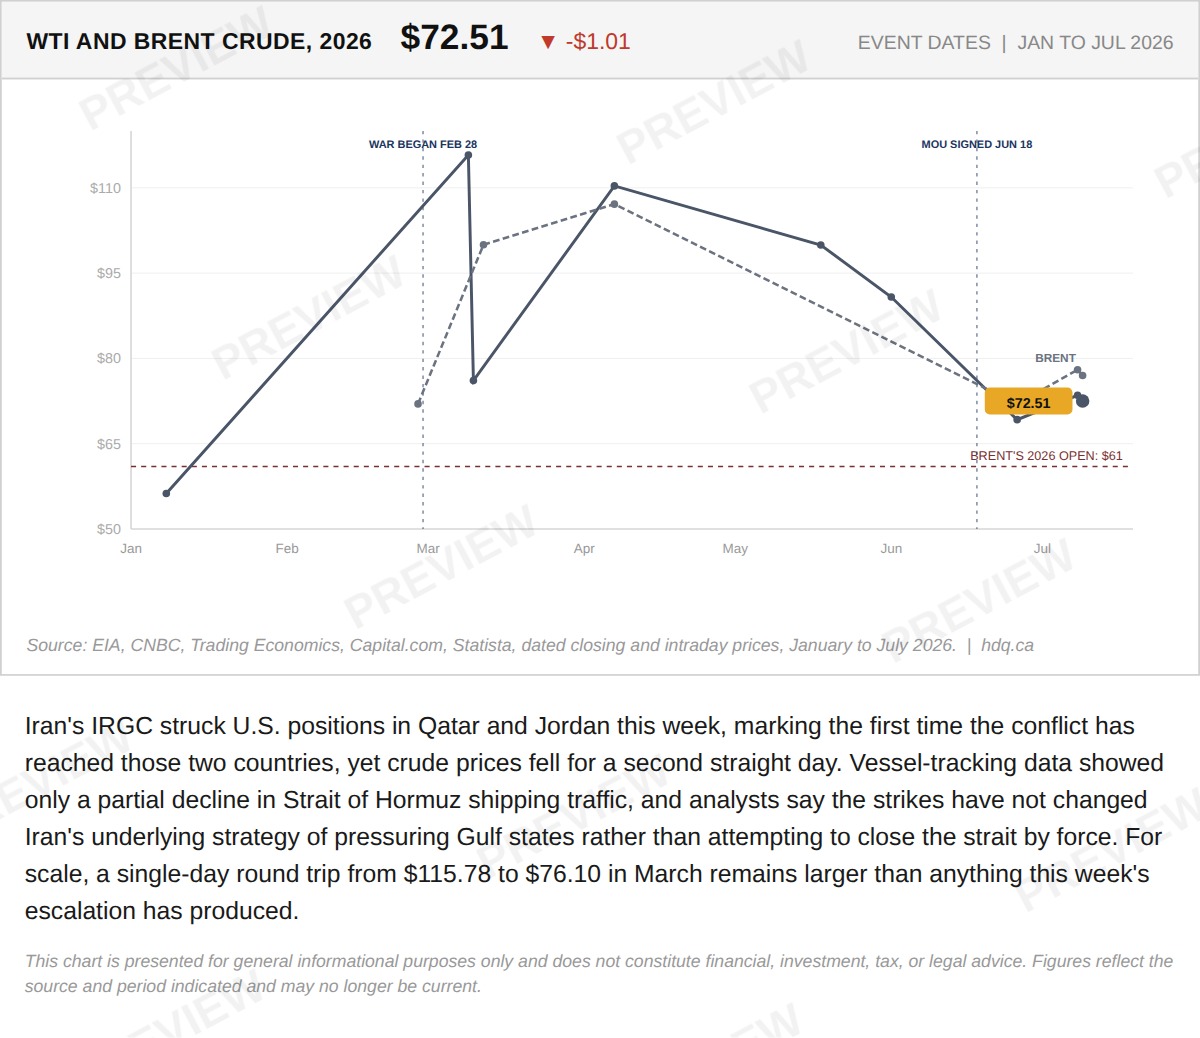
Iran's IRGC struck U.S.
The War Widened to Two New Countries. Oil Fell Anyway.
July 10, 2026
View chart & download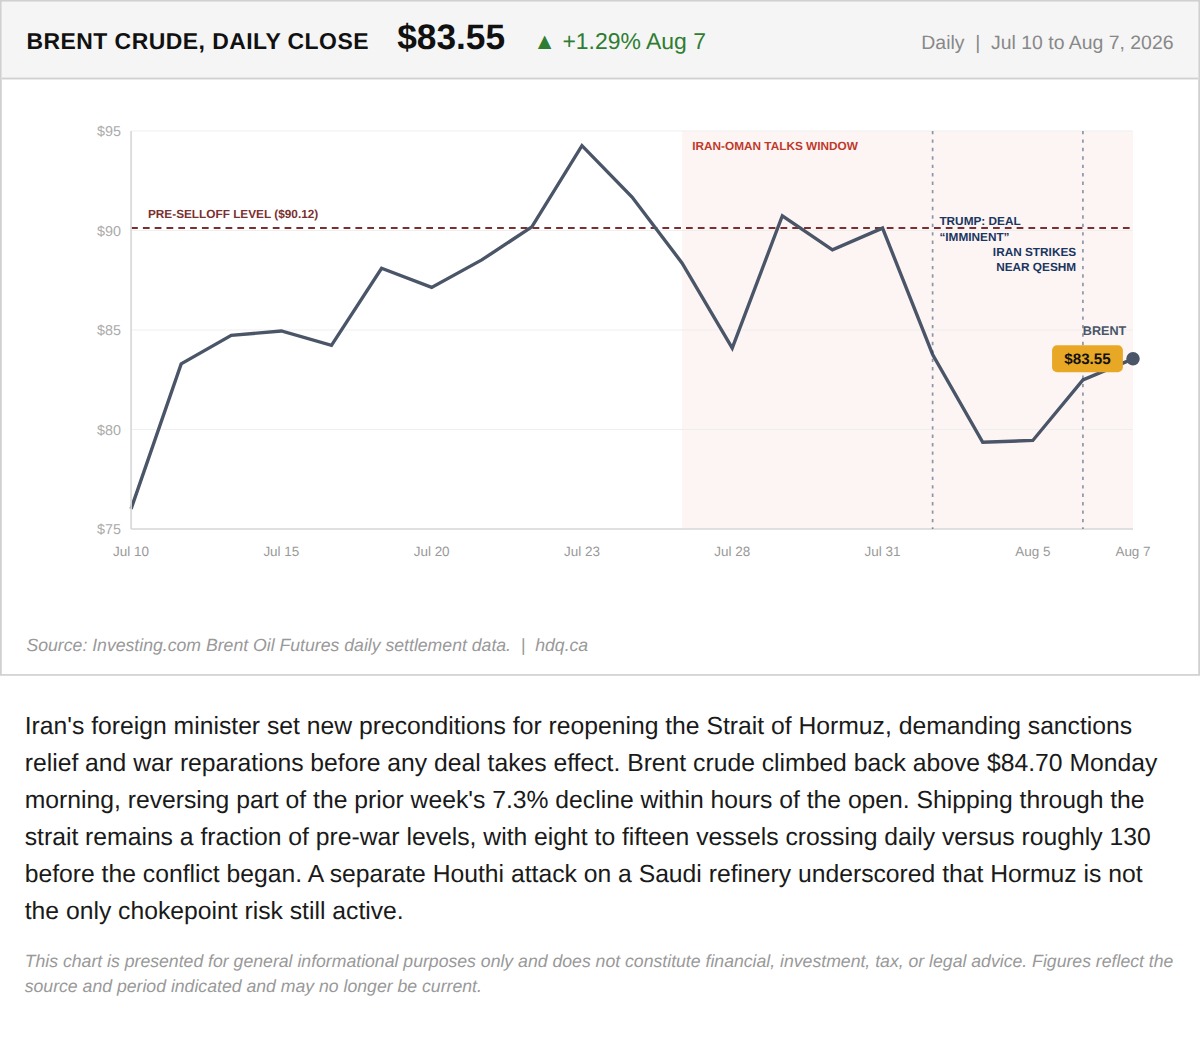
Iran's foreign minister set new preconditions for reopening the Strait of Hormuz, demanding sanctions relief and war reparations before any deal takes effect.
Iran Just Told the Market What the June MOU Actually Requires. The Market Priced Something Else.
August 10, 2026
View chart & download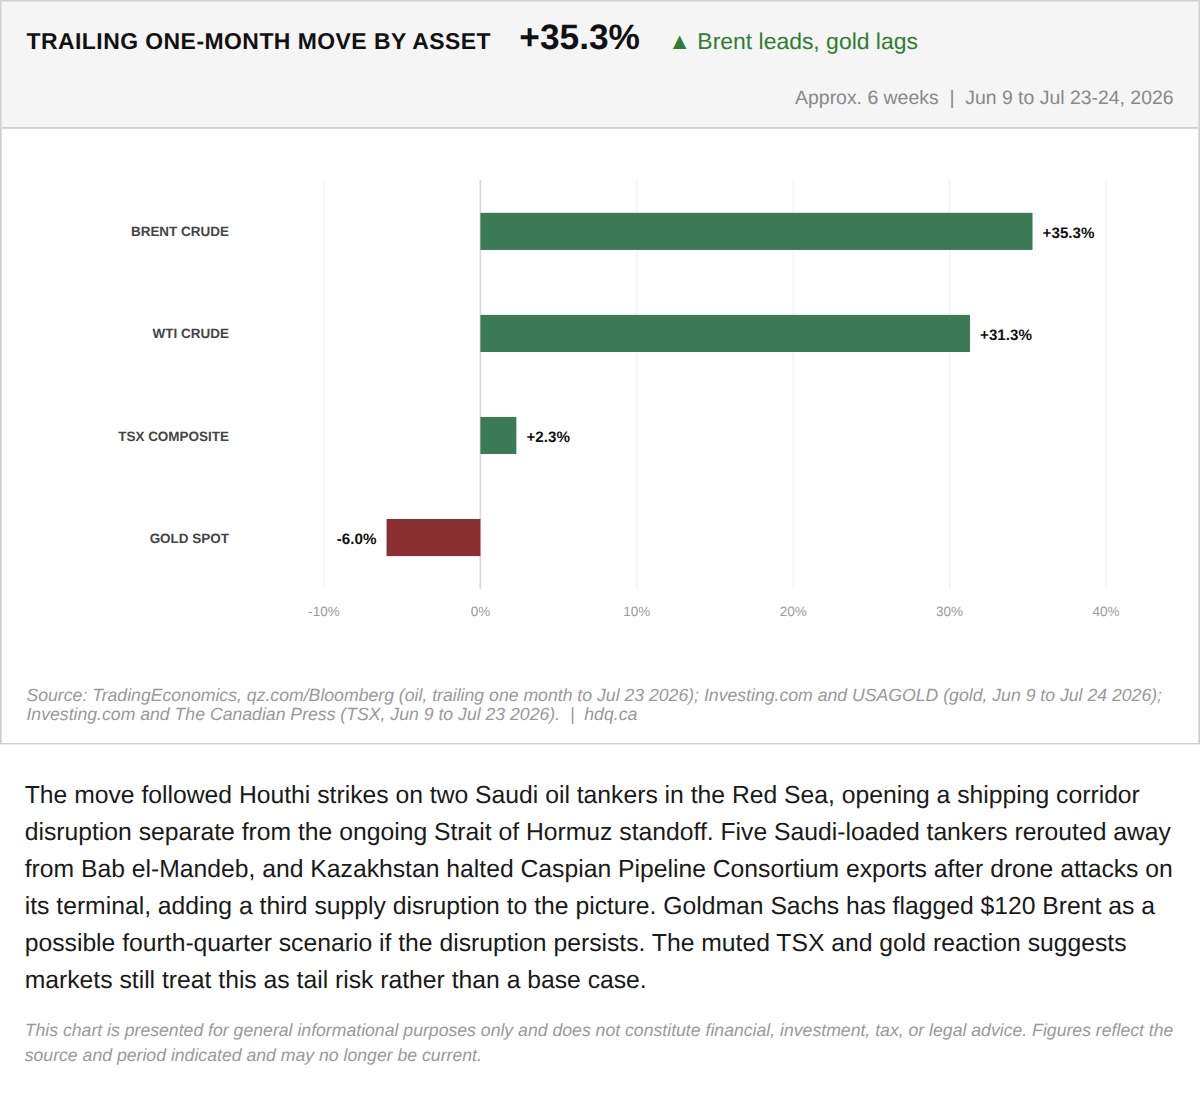
The move followed Houthi strikes on two Saudi oil tankers in the Red Sea, opening a shipping corridor disruption separate from the ongoing Strait of Hormuz standoff.
The Houthis Just Opened a Second Chokepoint. Markets Are Not Pricing It Yet.
July 24, 2026
View chart & download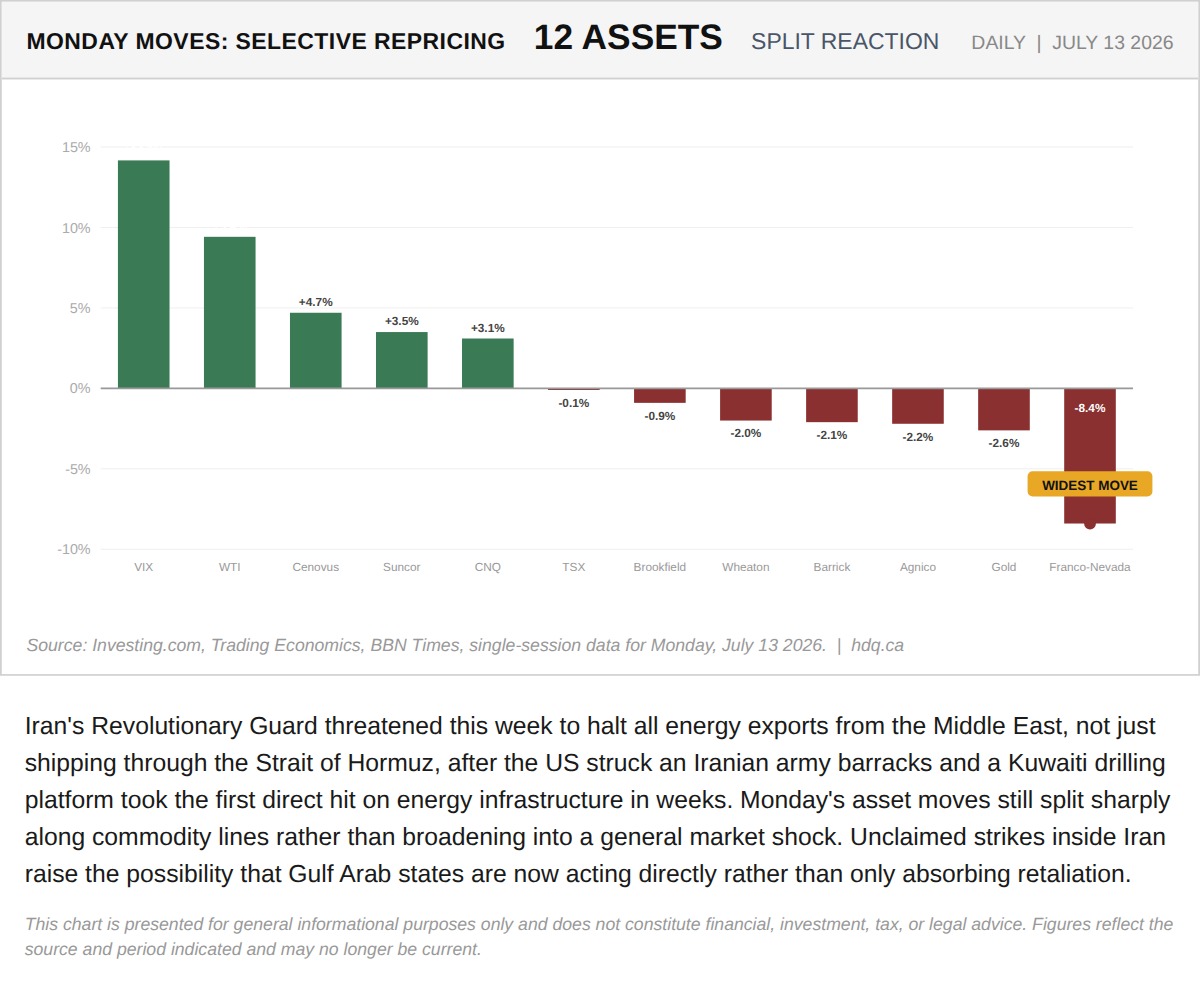
Iran's Revolutionary Guard threatened this week to halt all energy exports from the Middle East, not just shipping through the Strait of…
Iran's Threat Just Moved From Controlling the Strait to Threatening the Whole Gulf's Oil
July 15, 2026
View chart & download