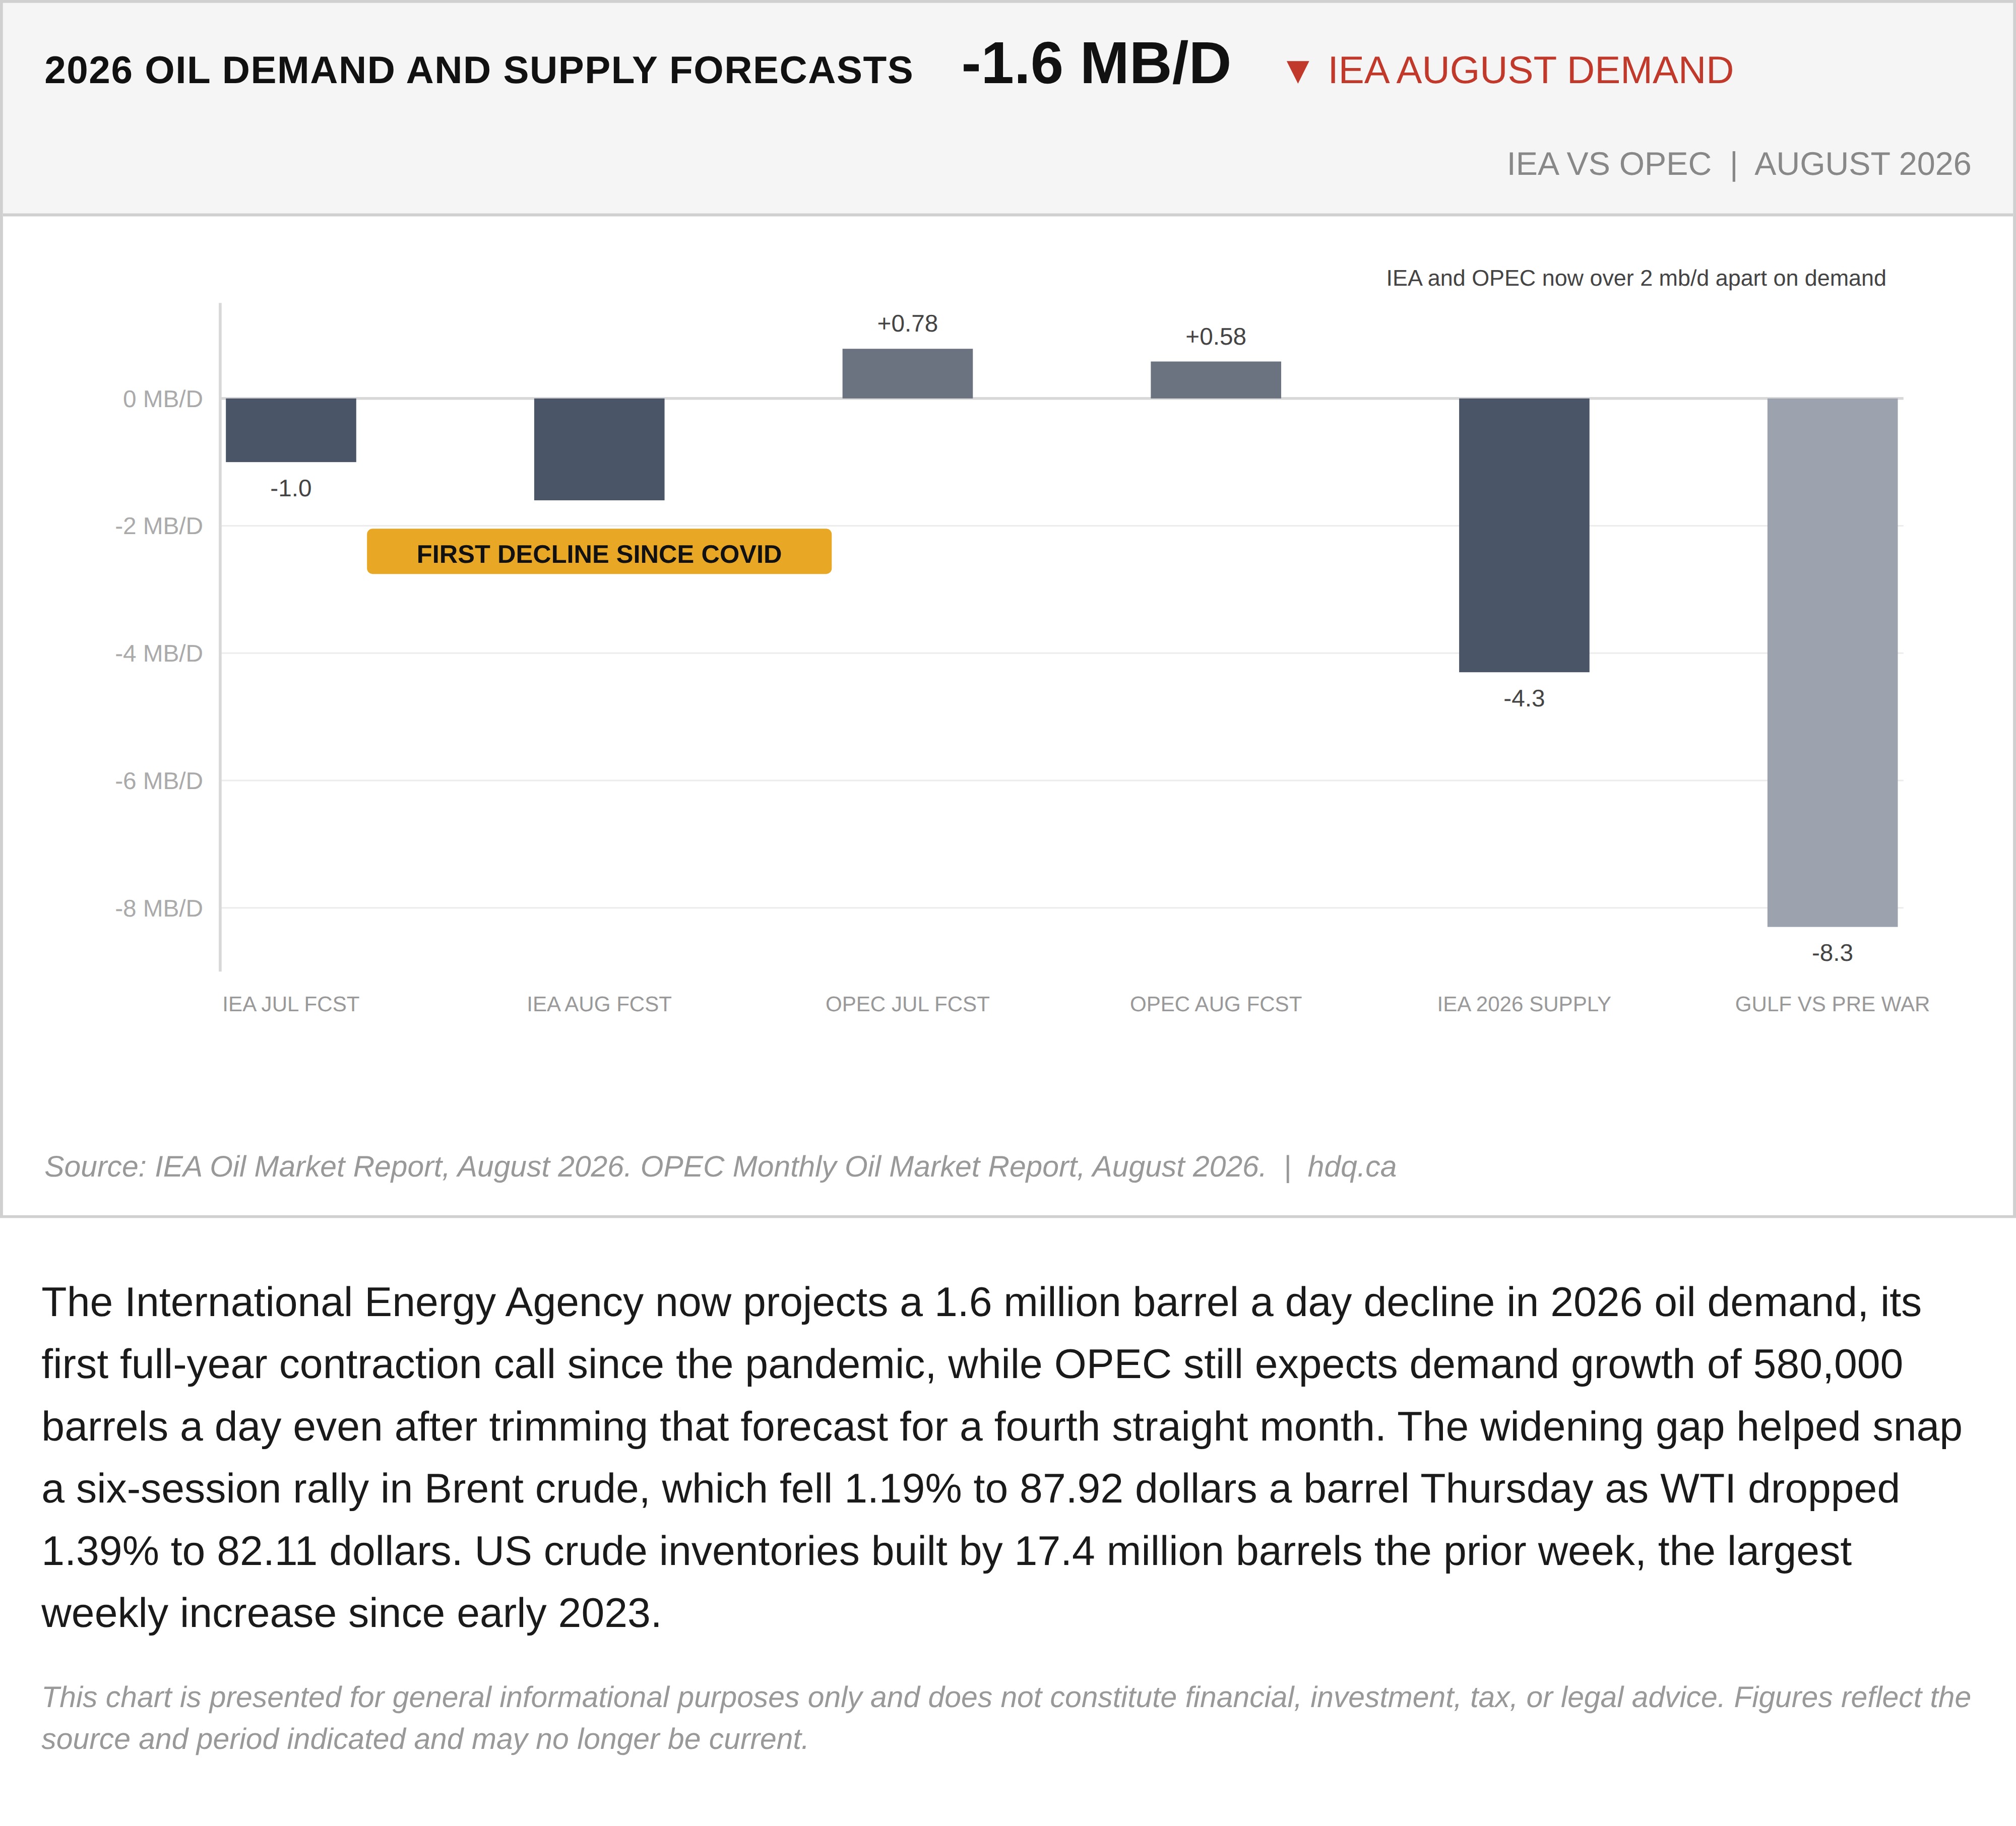
The International Energy Agency now projects a 1.6 million barrel a day decline in 2026 oil demand, its first full-year contraction call since the pandemic, while OPEC still expects demand growth of 580,000 barrels a day even after trimming that forecast for a fourth straight month. The widening gap helped snap a six-session rally in Brent crude, which fell 1.19% to 87.92 dollars a barrel Thursday as WTI dropped 1.39% to 82.11 dollars. US crude inventories built by 17.4 million barrels the prior week, the largest weekly increase since early 2023.
This chart is presented for general informational purposes only and does not constitute financial, investment, tax, or legal advice. Figures reflect the source and period indicated and may no longer be current.
Related charts
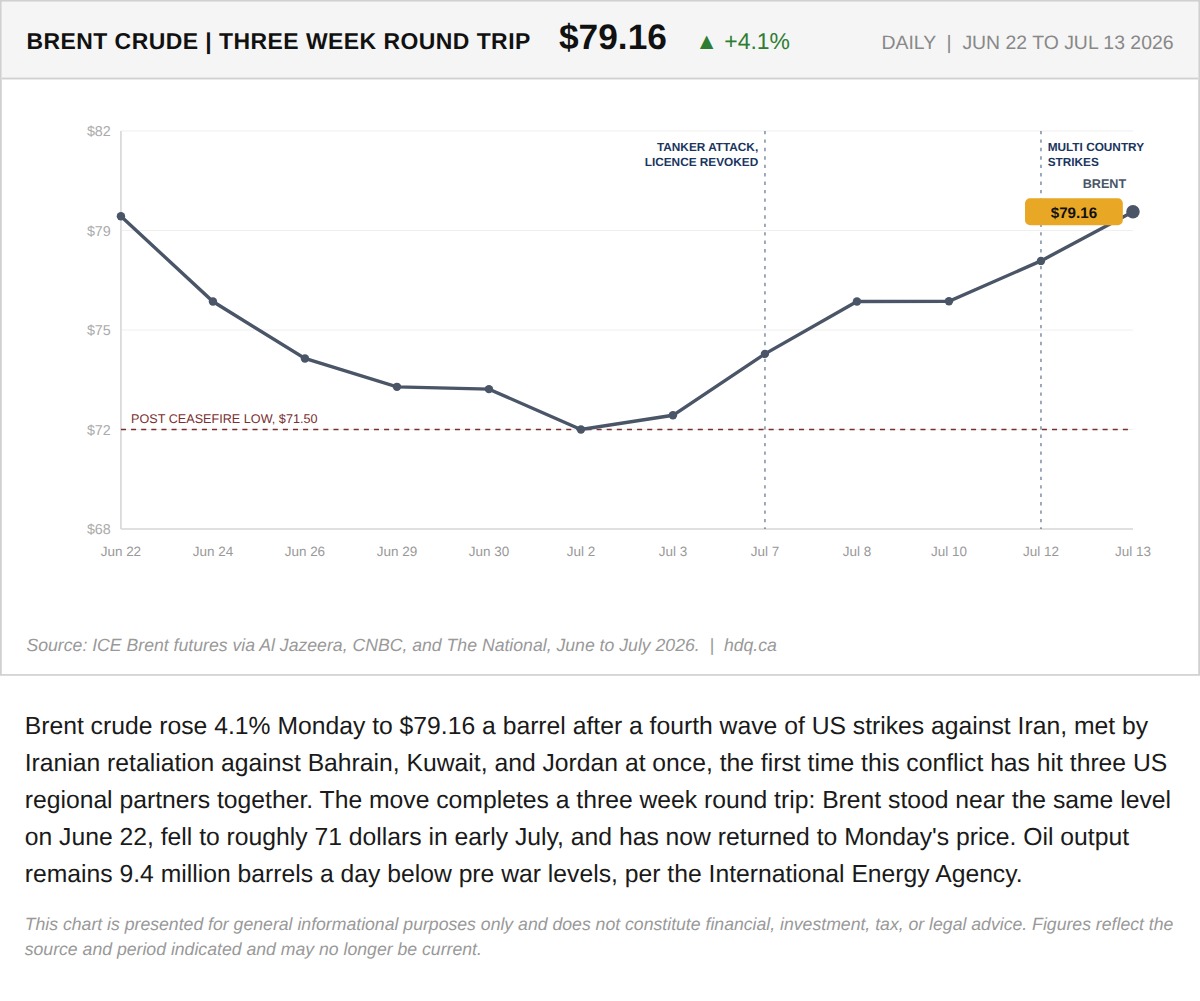
Brent crude rose 4.1% Monday to $79.16 a barrel after a fourth wave of US strikes against Iran, met by Iranian retaliation against Bahrain,…
July 13, 2026
View chart & download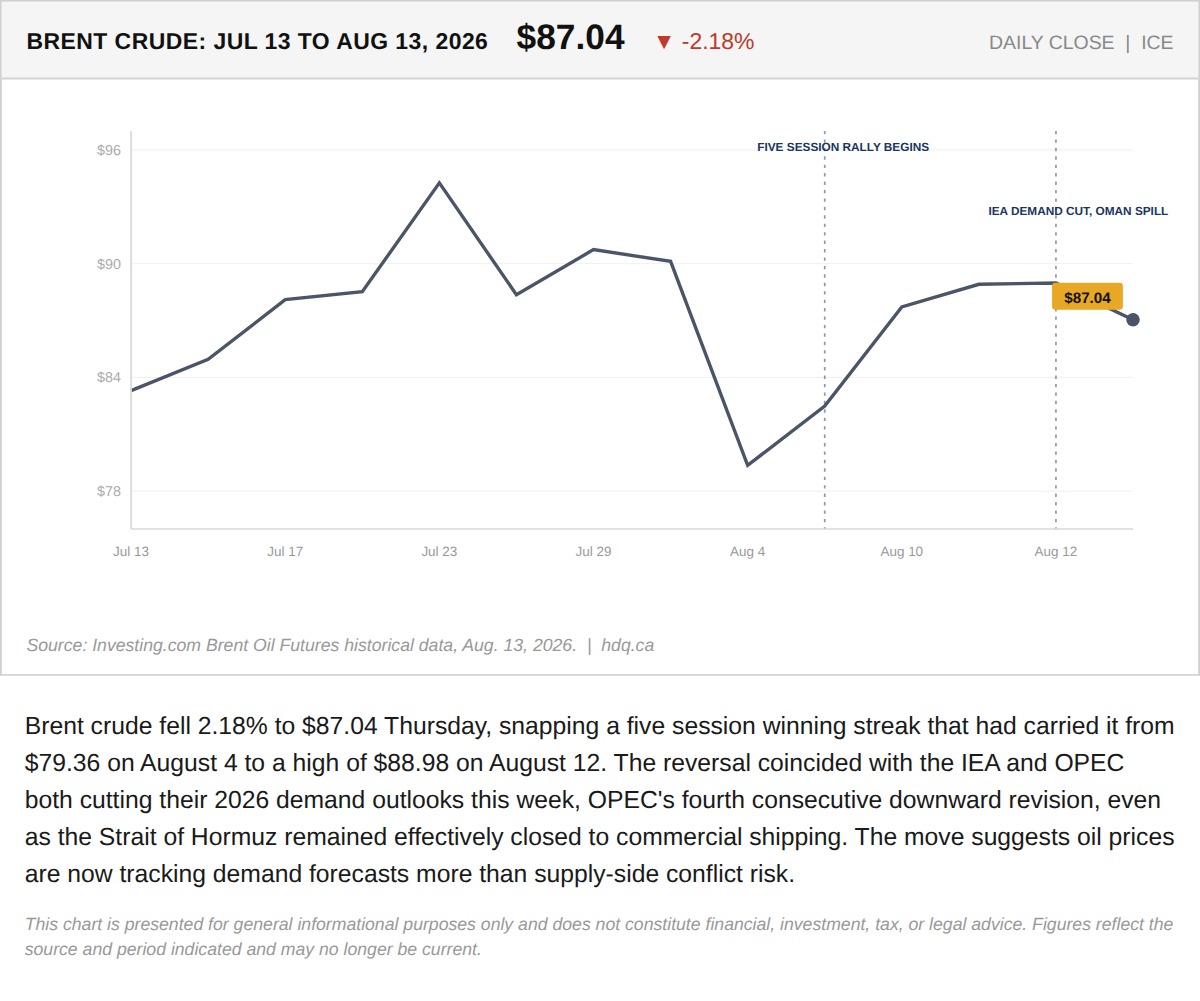
Brent crude fell 2.18% to $87.04 Thursday, snapping a five session winning streak that had carried it from $79.36 on August 4 to a high of $88.98 on August 12.
Oil Fell This Week. The Hormuz Rhetoric Didn't.
August 14, 2026
View chart & download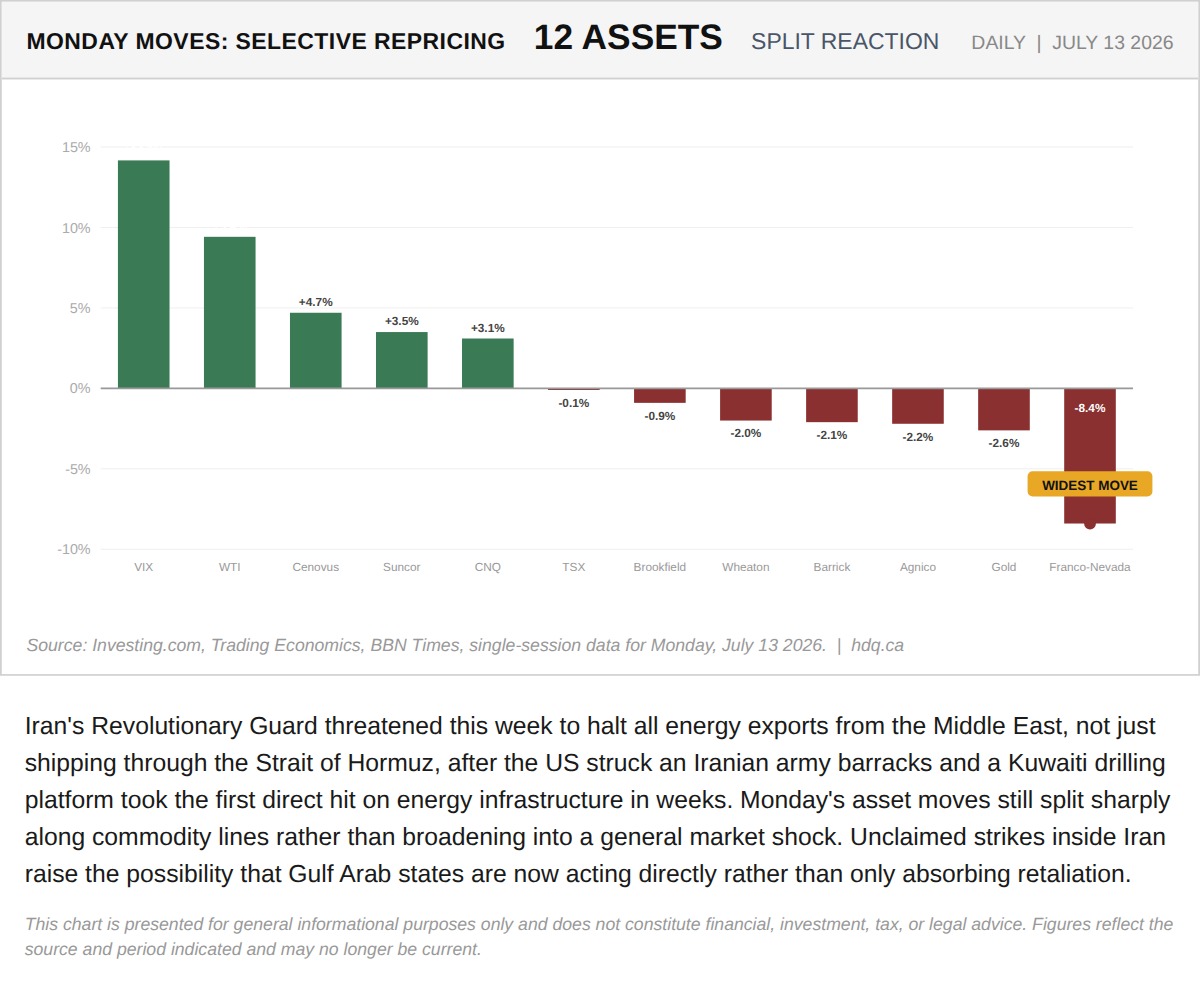
Iran's Revolutionary Guard threatened this week to halt all energy exports from the Middle East, not just shipping through the Strait of…
Iran's Threat Just Moved From Controlling the Strait to Threatening the Whole Gulf's Oil
July 15, 2026
View chart & download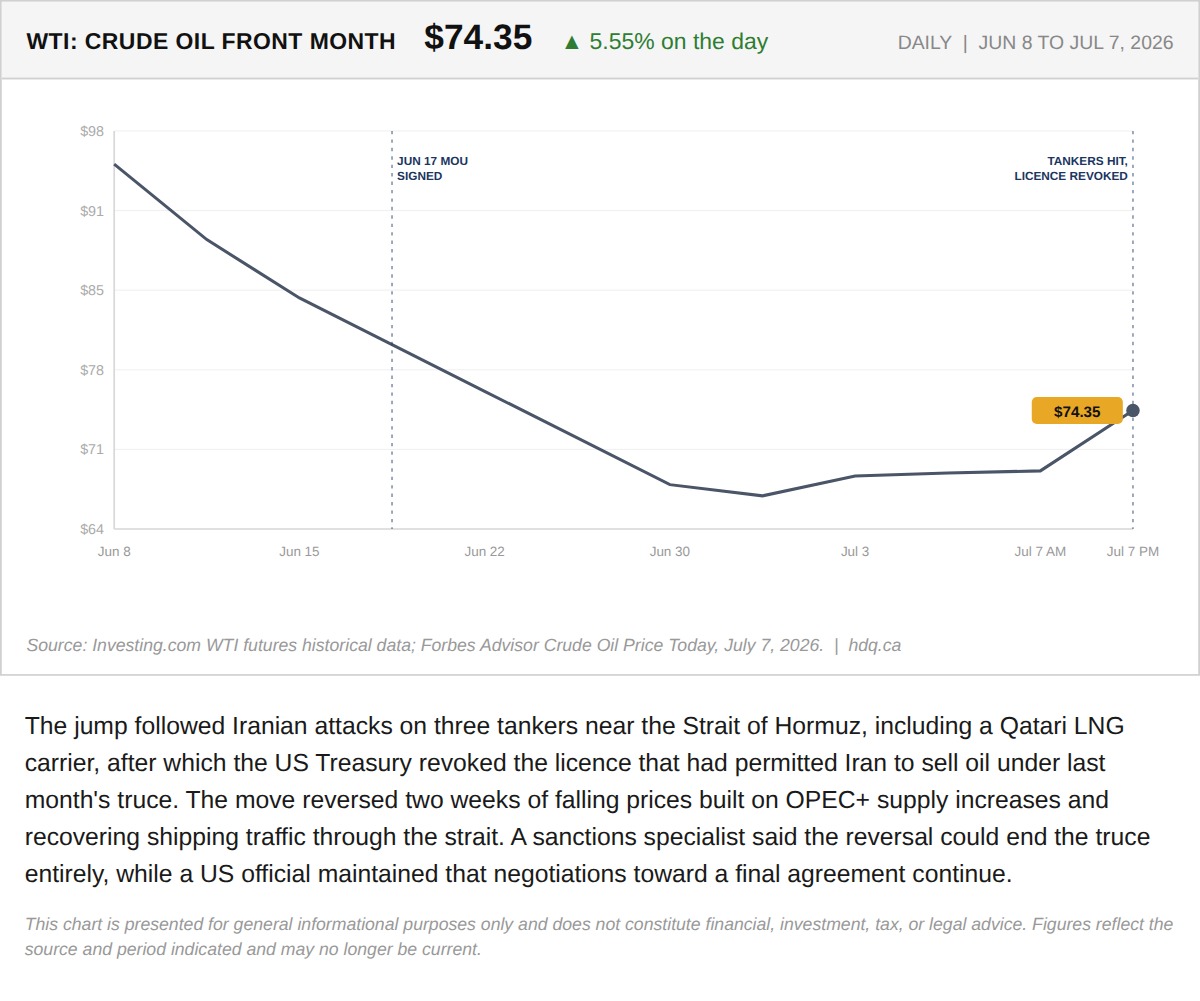
The jump followed Iranian attacks on three tankers near the Strait of Hormuz, including a Qatari LNG carrier, after which the US Treasury…
July 8, 2026
View chart & download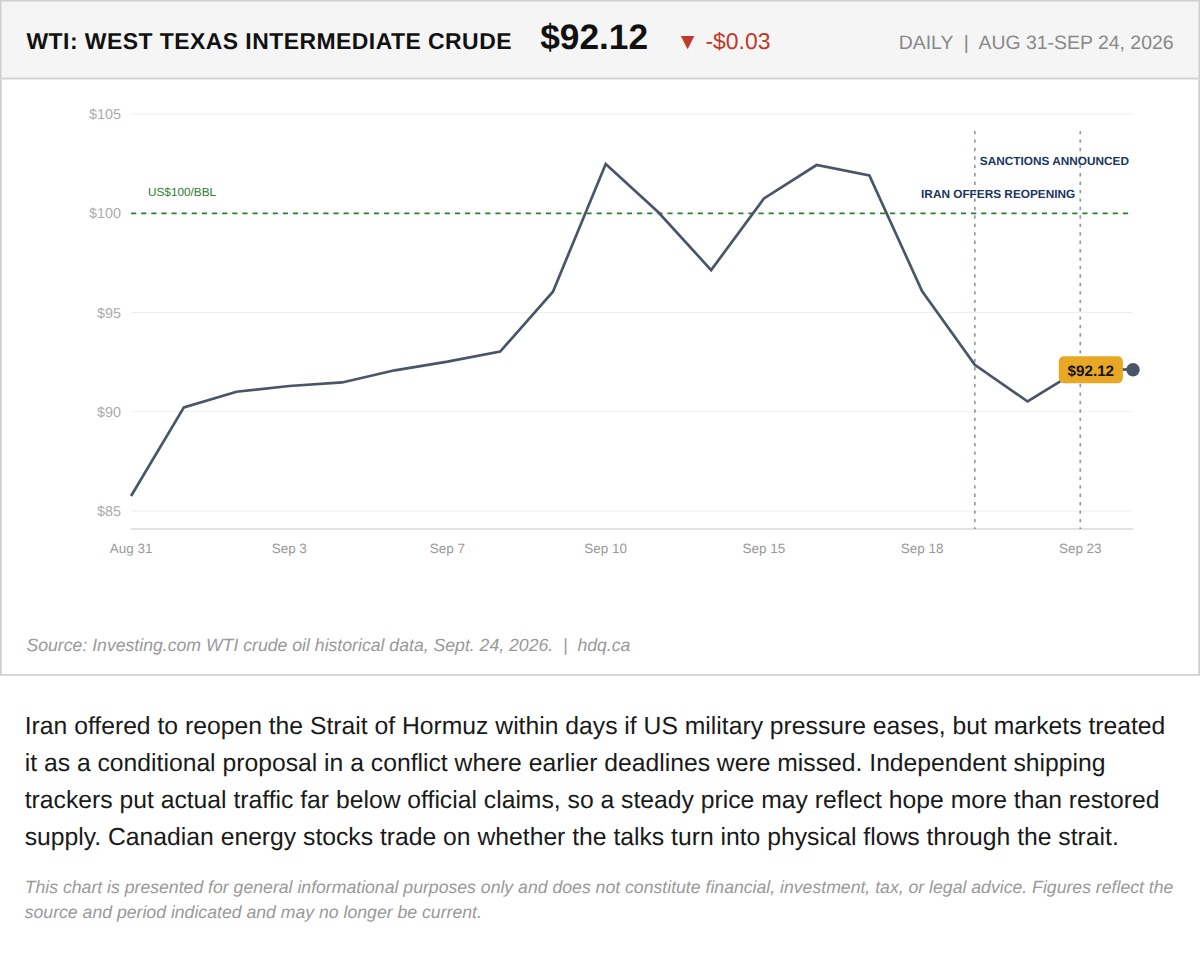
Iran offered to reopen the Strait of Hormuz within days if US military pressure eases, but markets treated it as a conditional proposal in…
WTI Crude Holds Near $92 on Hormuz Reopening Offer
September 24, 2026
View chart & download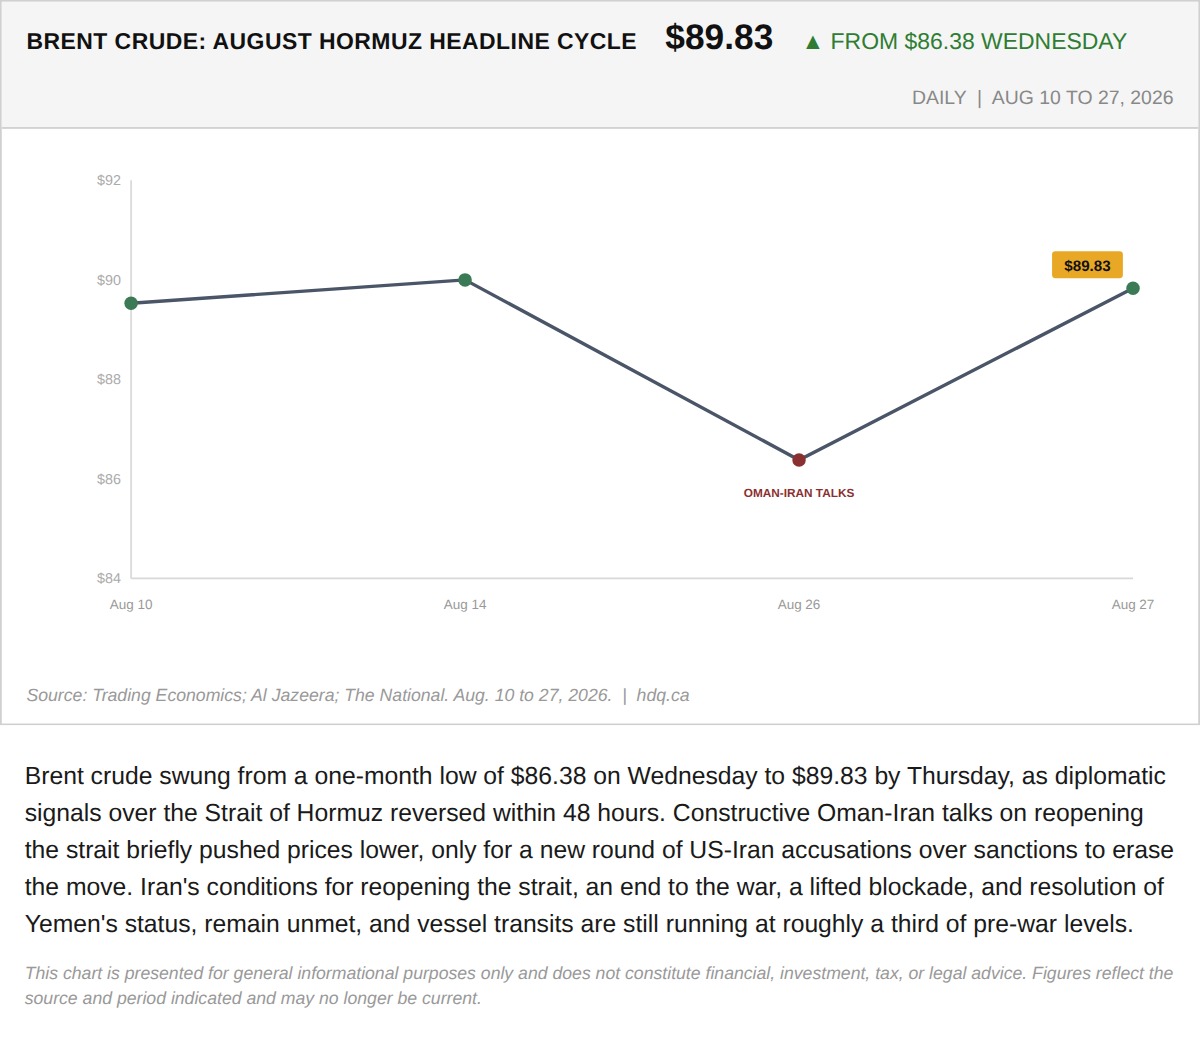
Brent crude swung from a one-month low of $86.38 on Wednesday to $89.83 by Thursday, as diplomatic signals over the Strait of Hormuz reversed within 48 hours.
Oil's 48 Hour Reversal Shows Why Hormuz Remains a Tail Risk, Not a Resolved Story
August 28, 2026
View chart & download