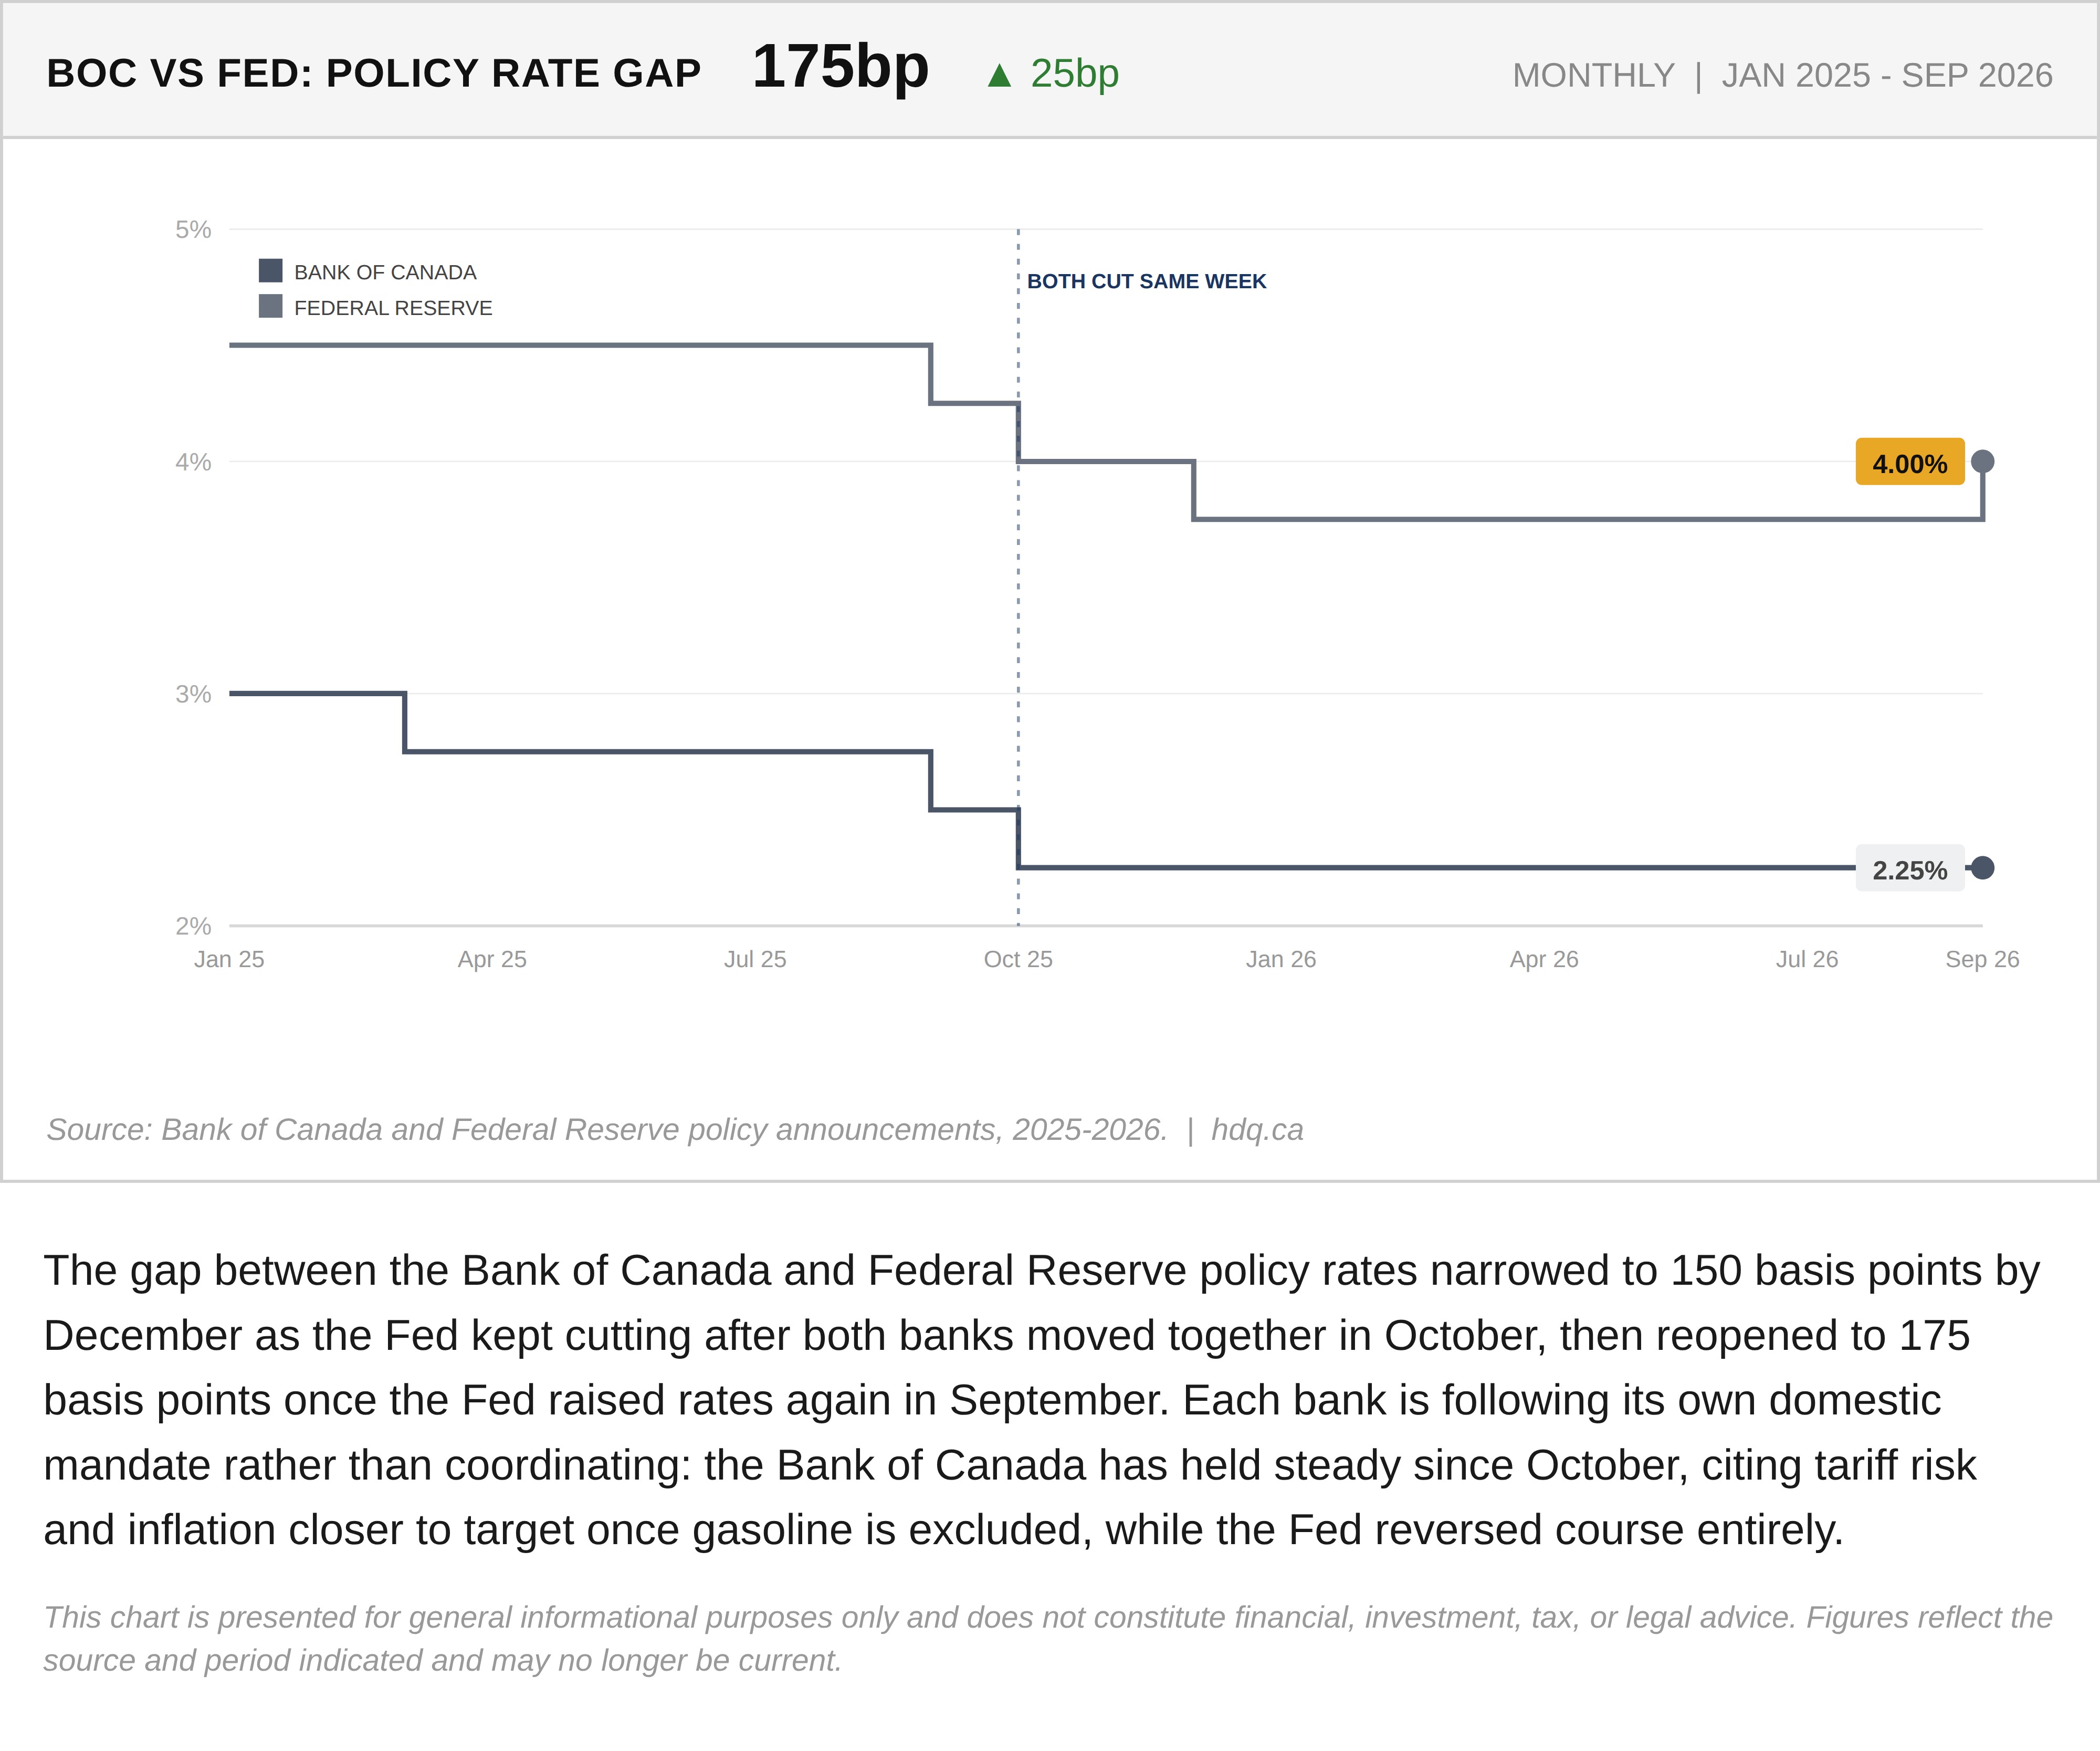
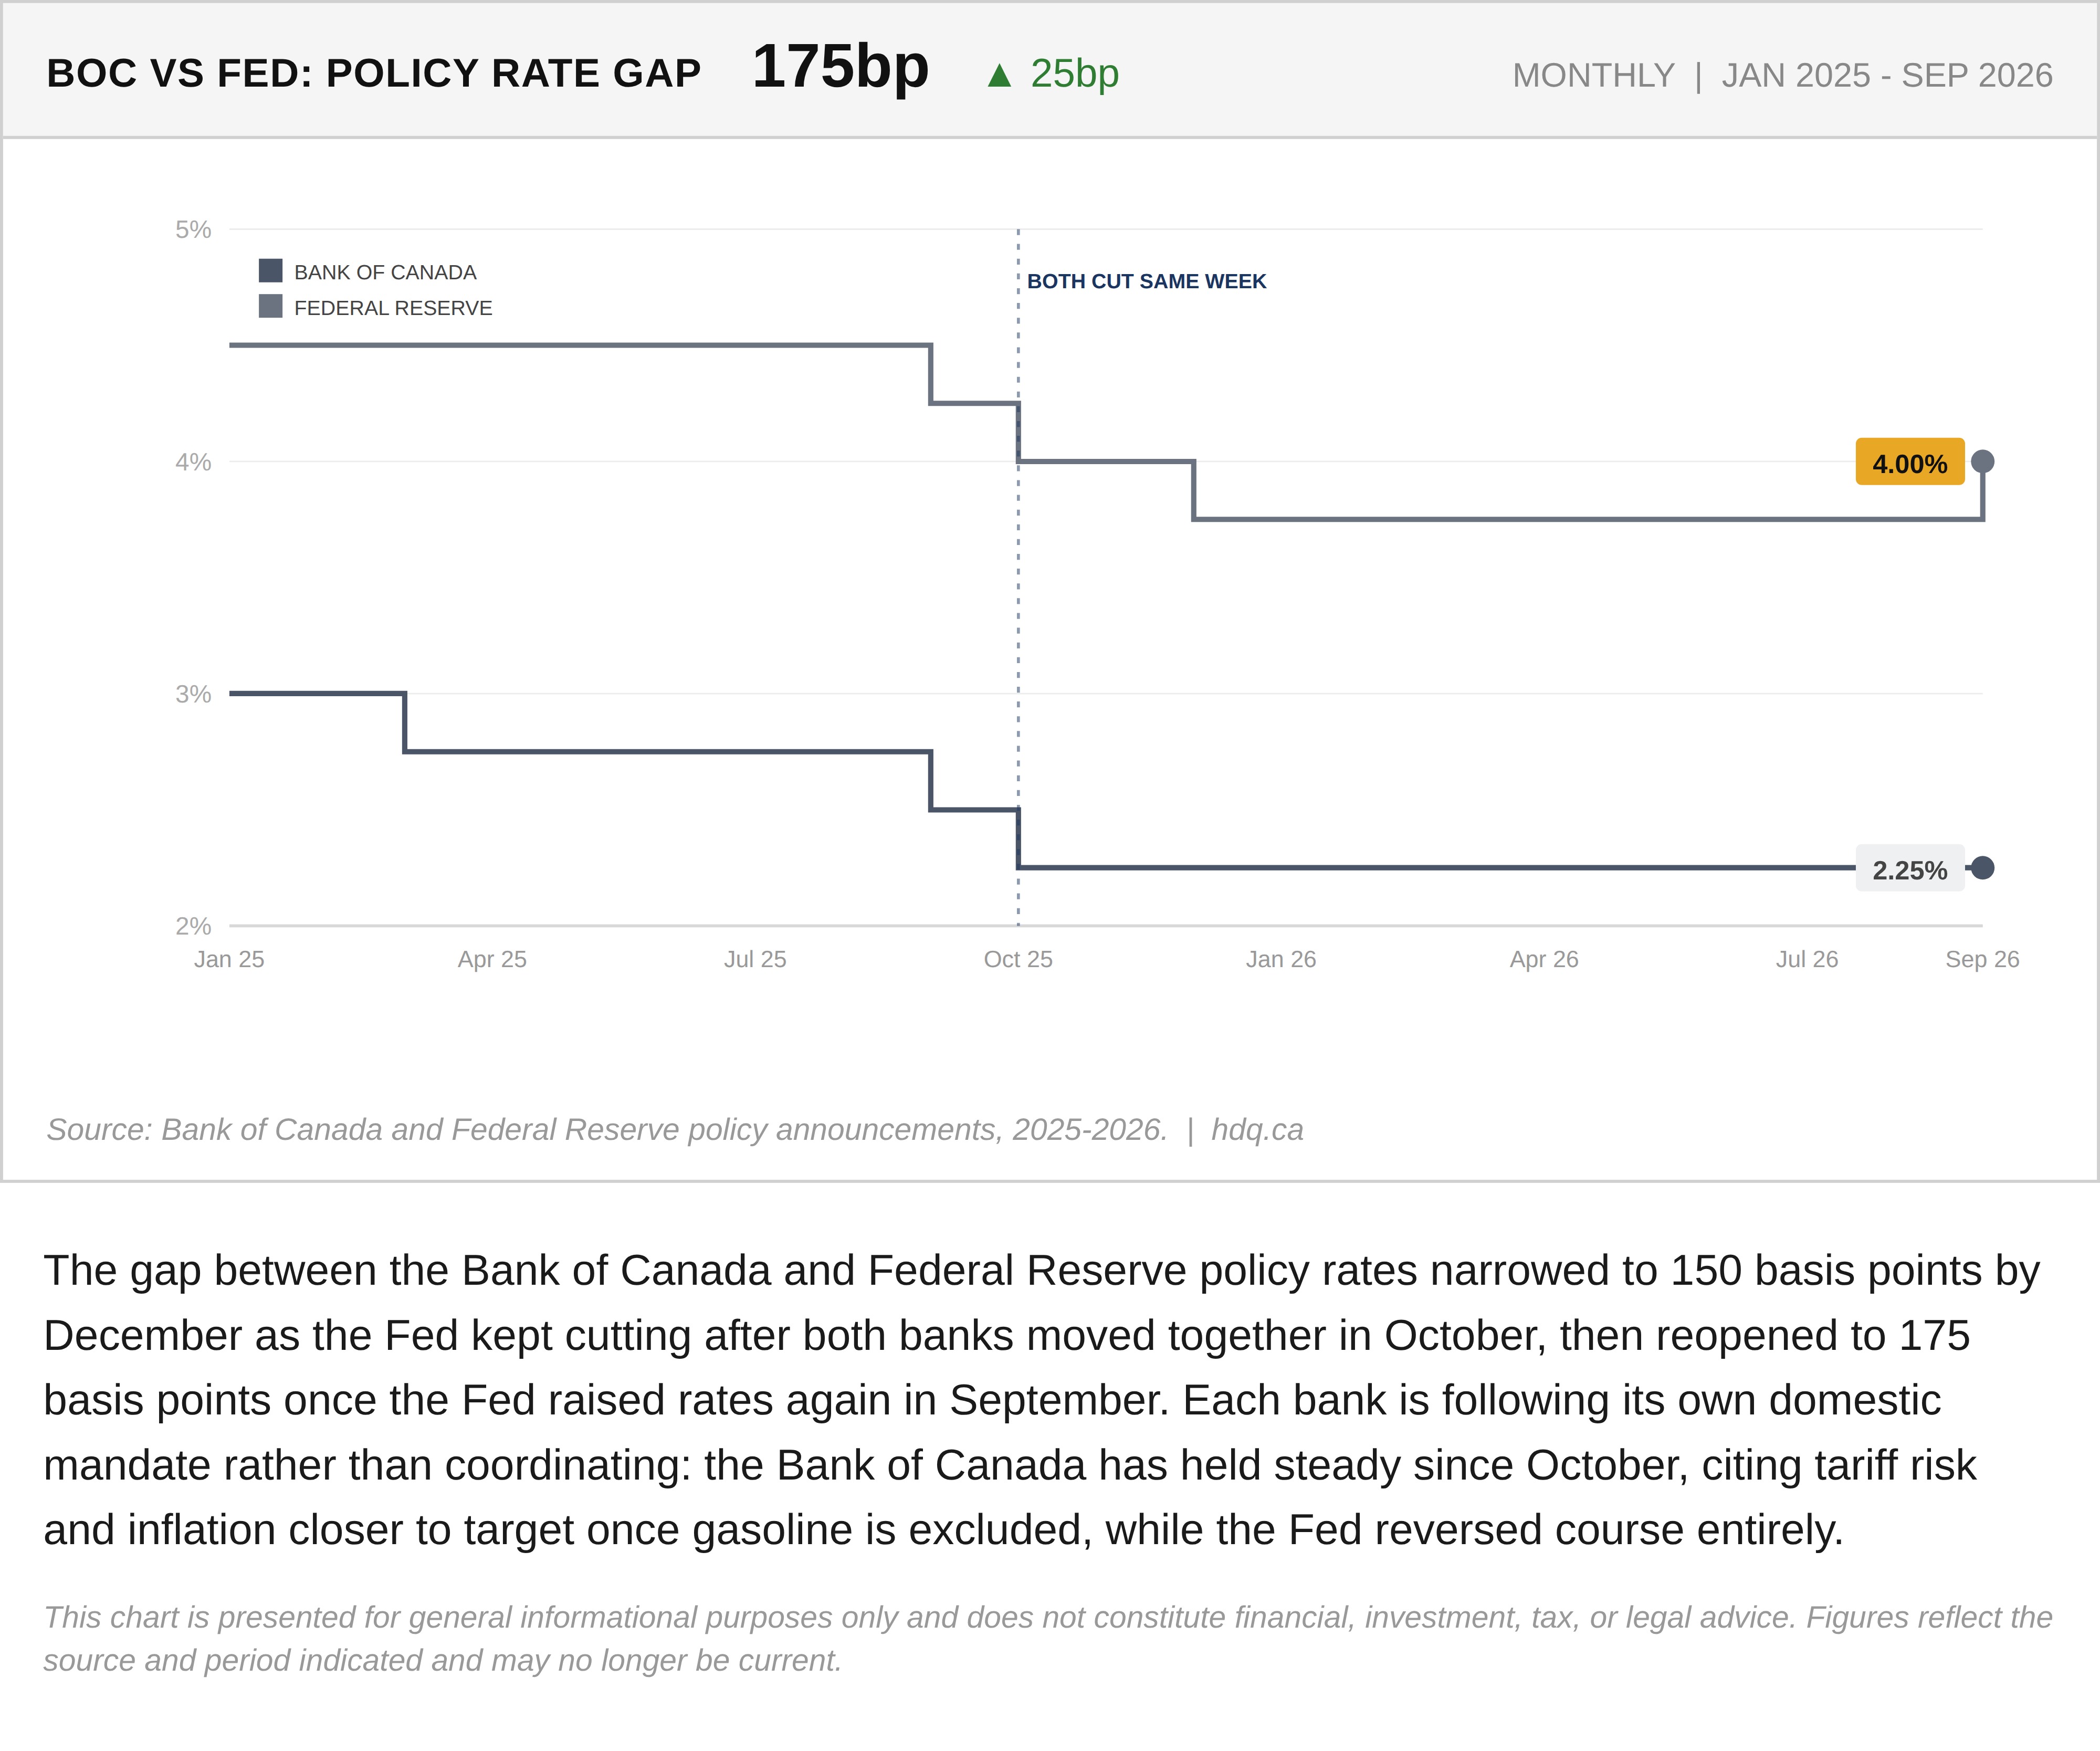
The gap between the Bank of Canada and Federal Reserve policy rates narrowed to 150 basis points by December as the Fed kept cutting after both banks moved together in October, then reopened to 175 basis points once the Fed raised rates again in September. Each bank is following its own domestic mandate rather than coordinating: the Bank of Canada has held steady since October, citing tariff risk and inflation closer to target once gasoline is excluded, while the Fed reversed course entirely.
This chart is presented for general informational purposes only and does not constitute financial, investment, tax, or legal advice. Figures reflect the source and period indicated and may no longer be current.
Related charts
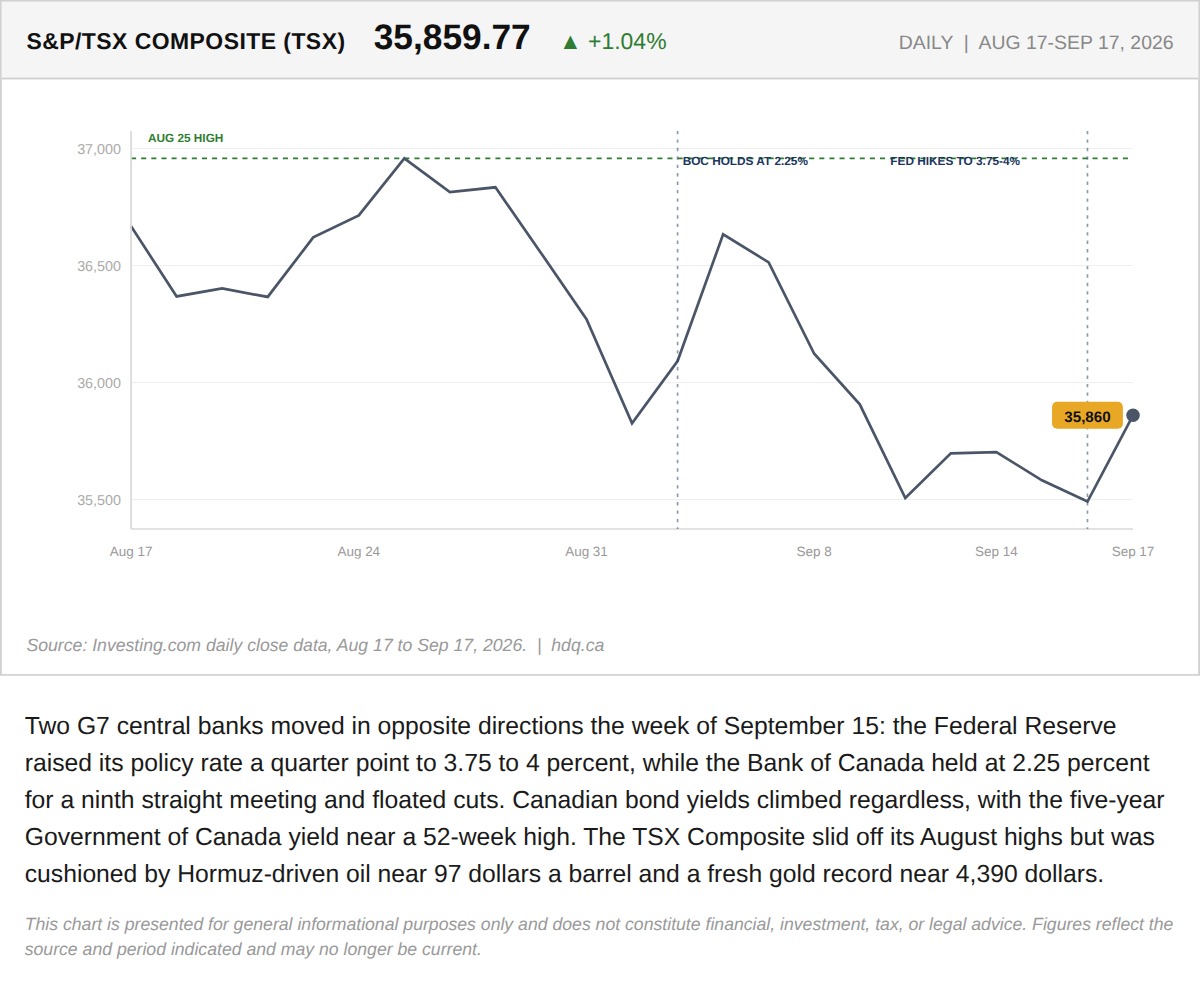
Two G7 central banks moved in opposite directions the week of September 15: the Federal Reserve raised its policy rate a quarter point to…
The Week the Bank of Canada's Own Rate Stopped Setting Canadian Borrowing Costs
September 19, 2026
View chart & download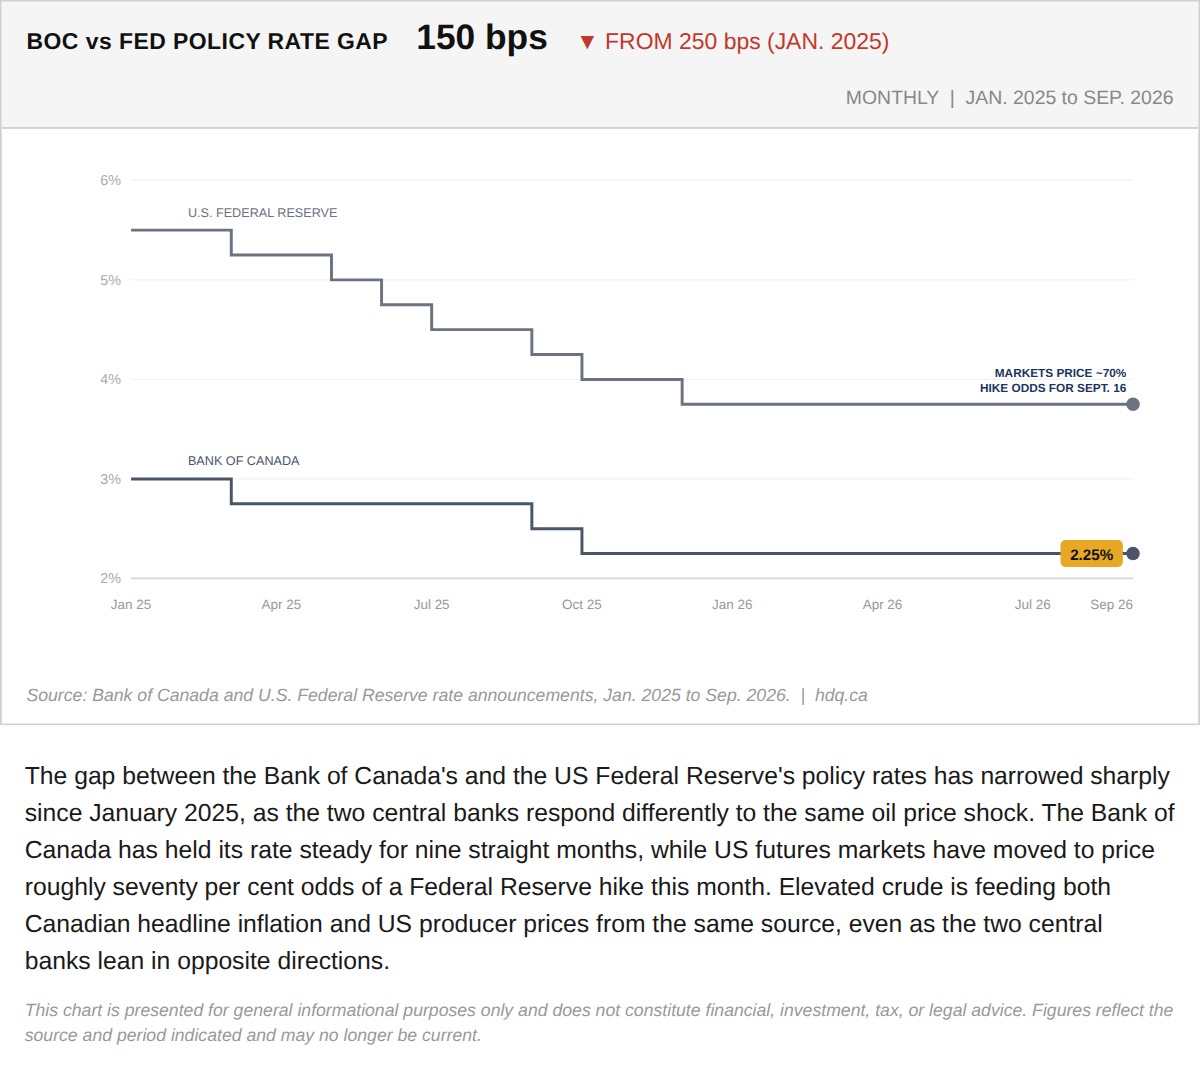
The gap between the Bank of Canada's and the US Federal Reserve's policy rates has narrowed sharply since January 2025, as the two central…
The BoC and the Fed Have Stopped Moving Together, and Oil Is the Reason Why
September 11, 2026
View chart & download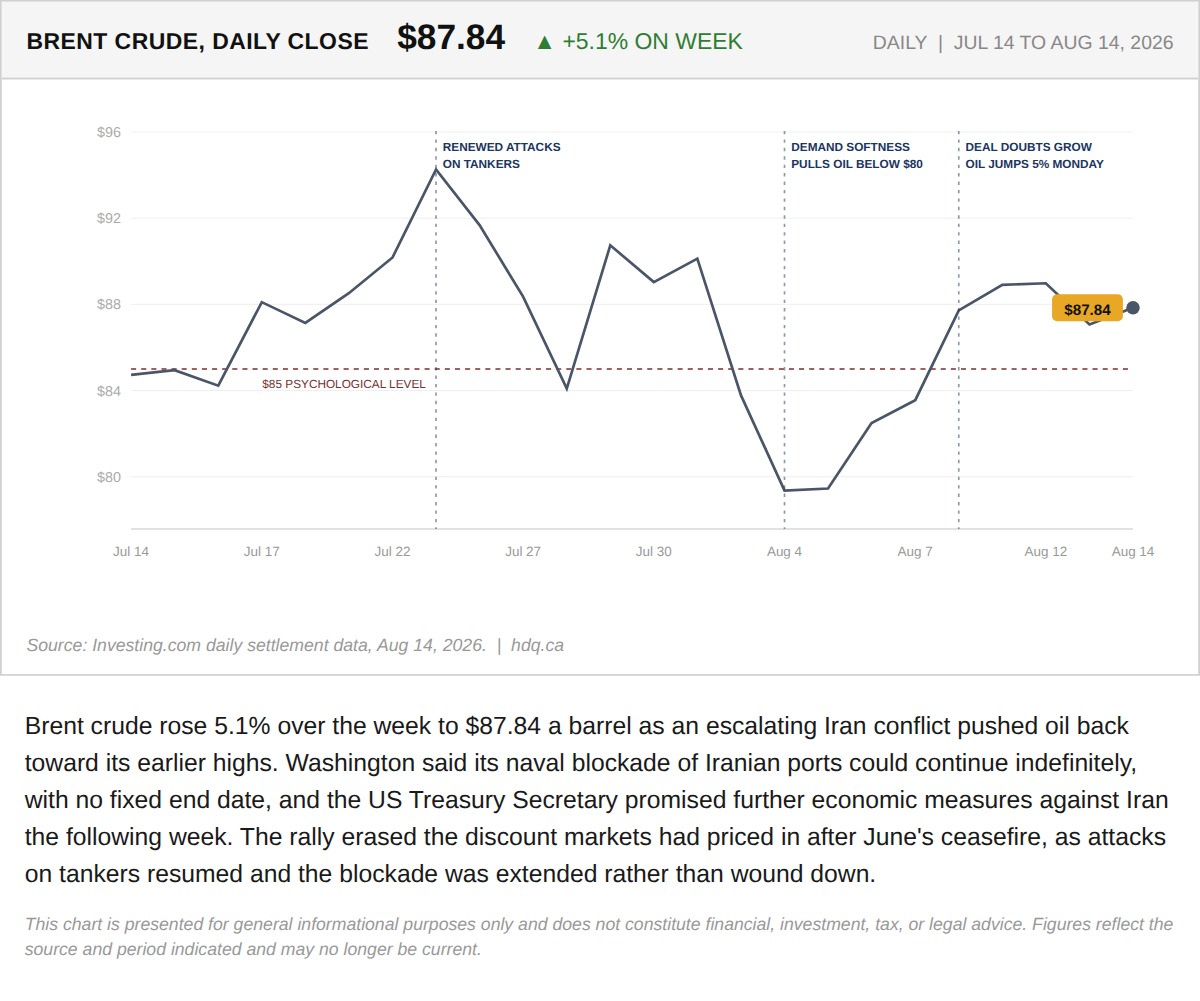
Brent crude rose 5.1% over the week to $87.84 a barrel as an escalating Iran conflict pushed oil back toward its earlier highs.
The TSX and Gold Both Set Records This Week. That Should Not Happen Together.
August 15, 2026
View chart & download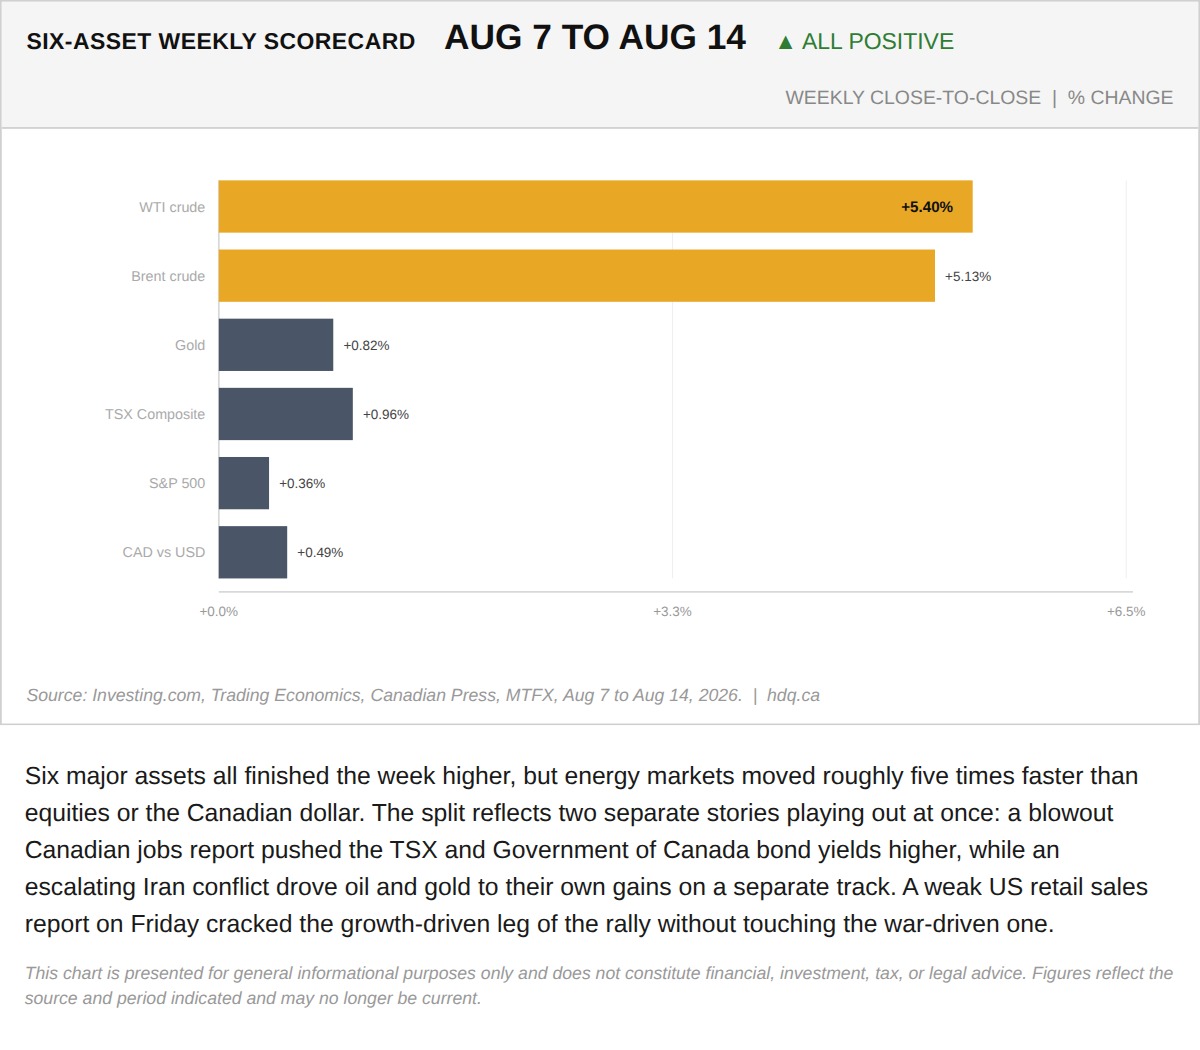
Six major assets all finished the week higher, but energy markets moved roughly five times faster than equities or the Canadian dollar.
The TSX and Gold Both Set Records This Week. That Should Not Happen Together.
August 15, 2026
View chart & download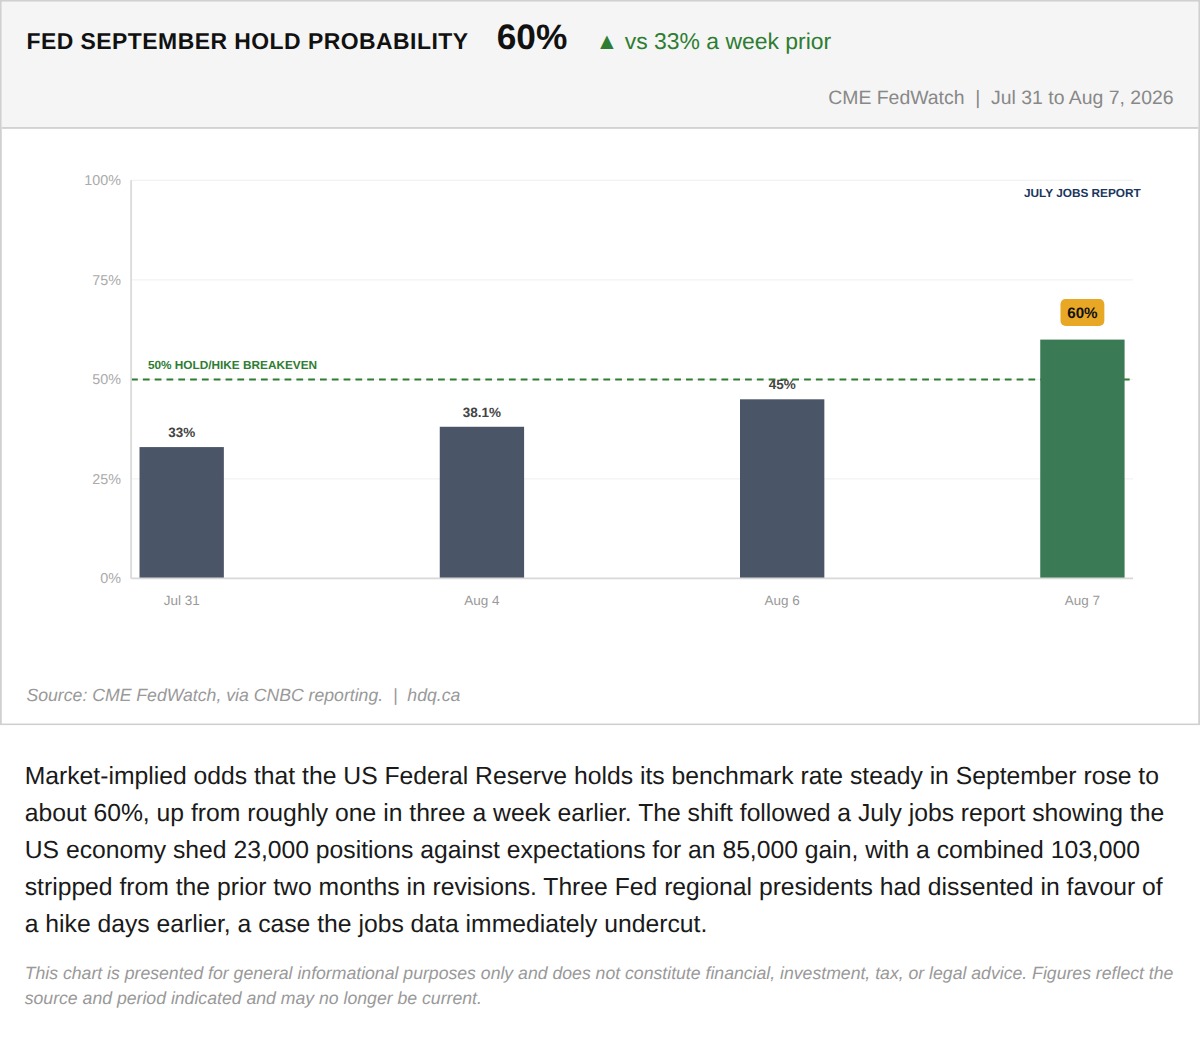
Market-implied odds that the US Federal Reserve holds its benchmark rate steady in September rose to about 60%, up from roughly one in three a week earlier.
The Fed's Three Dissenters Wanted a Hike. Canada's Data Made Their Case, America's Broke It.
August 10, 2026
View chart & download
The S&P/TSX Composite closed July at 35,226, up 1.06% for the month, a modest headline figure that conceals sharp intra-month swings.
S&P/TSX Composite closes July up 1.06% after a volatile month
July 31, 2026
View chart & download