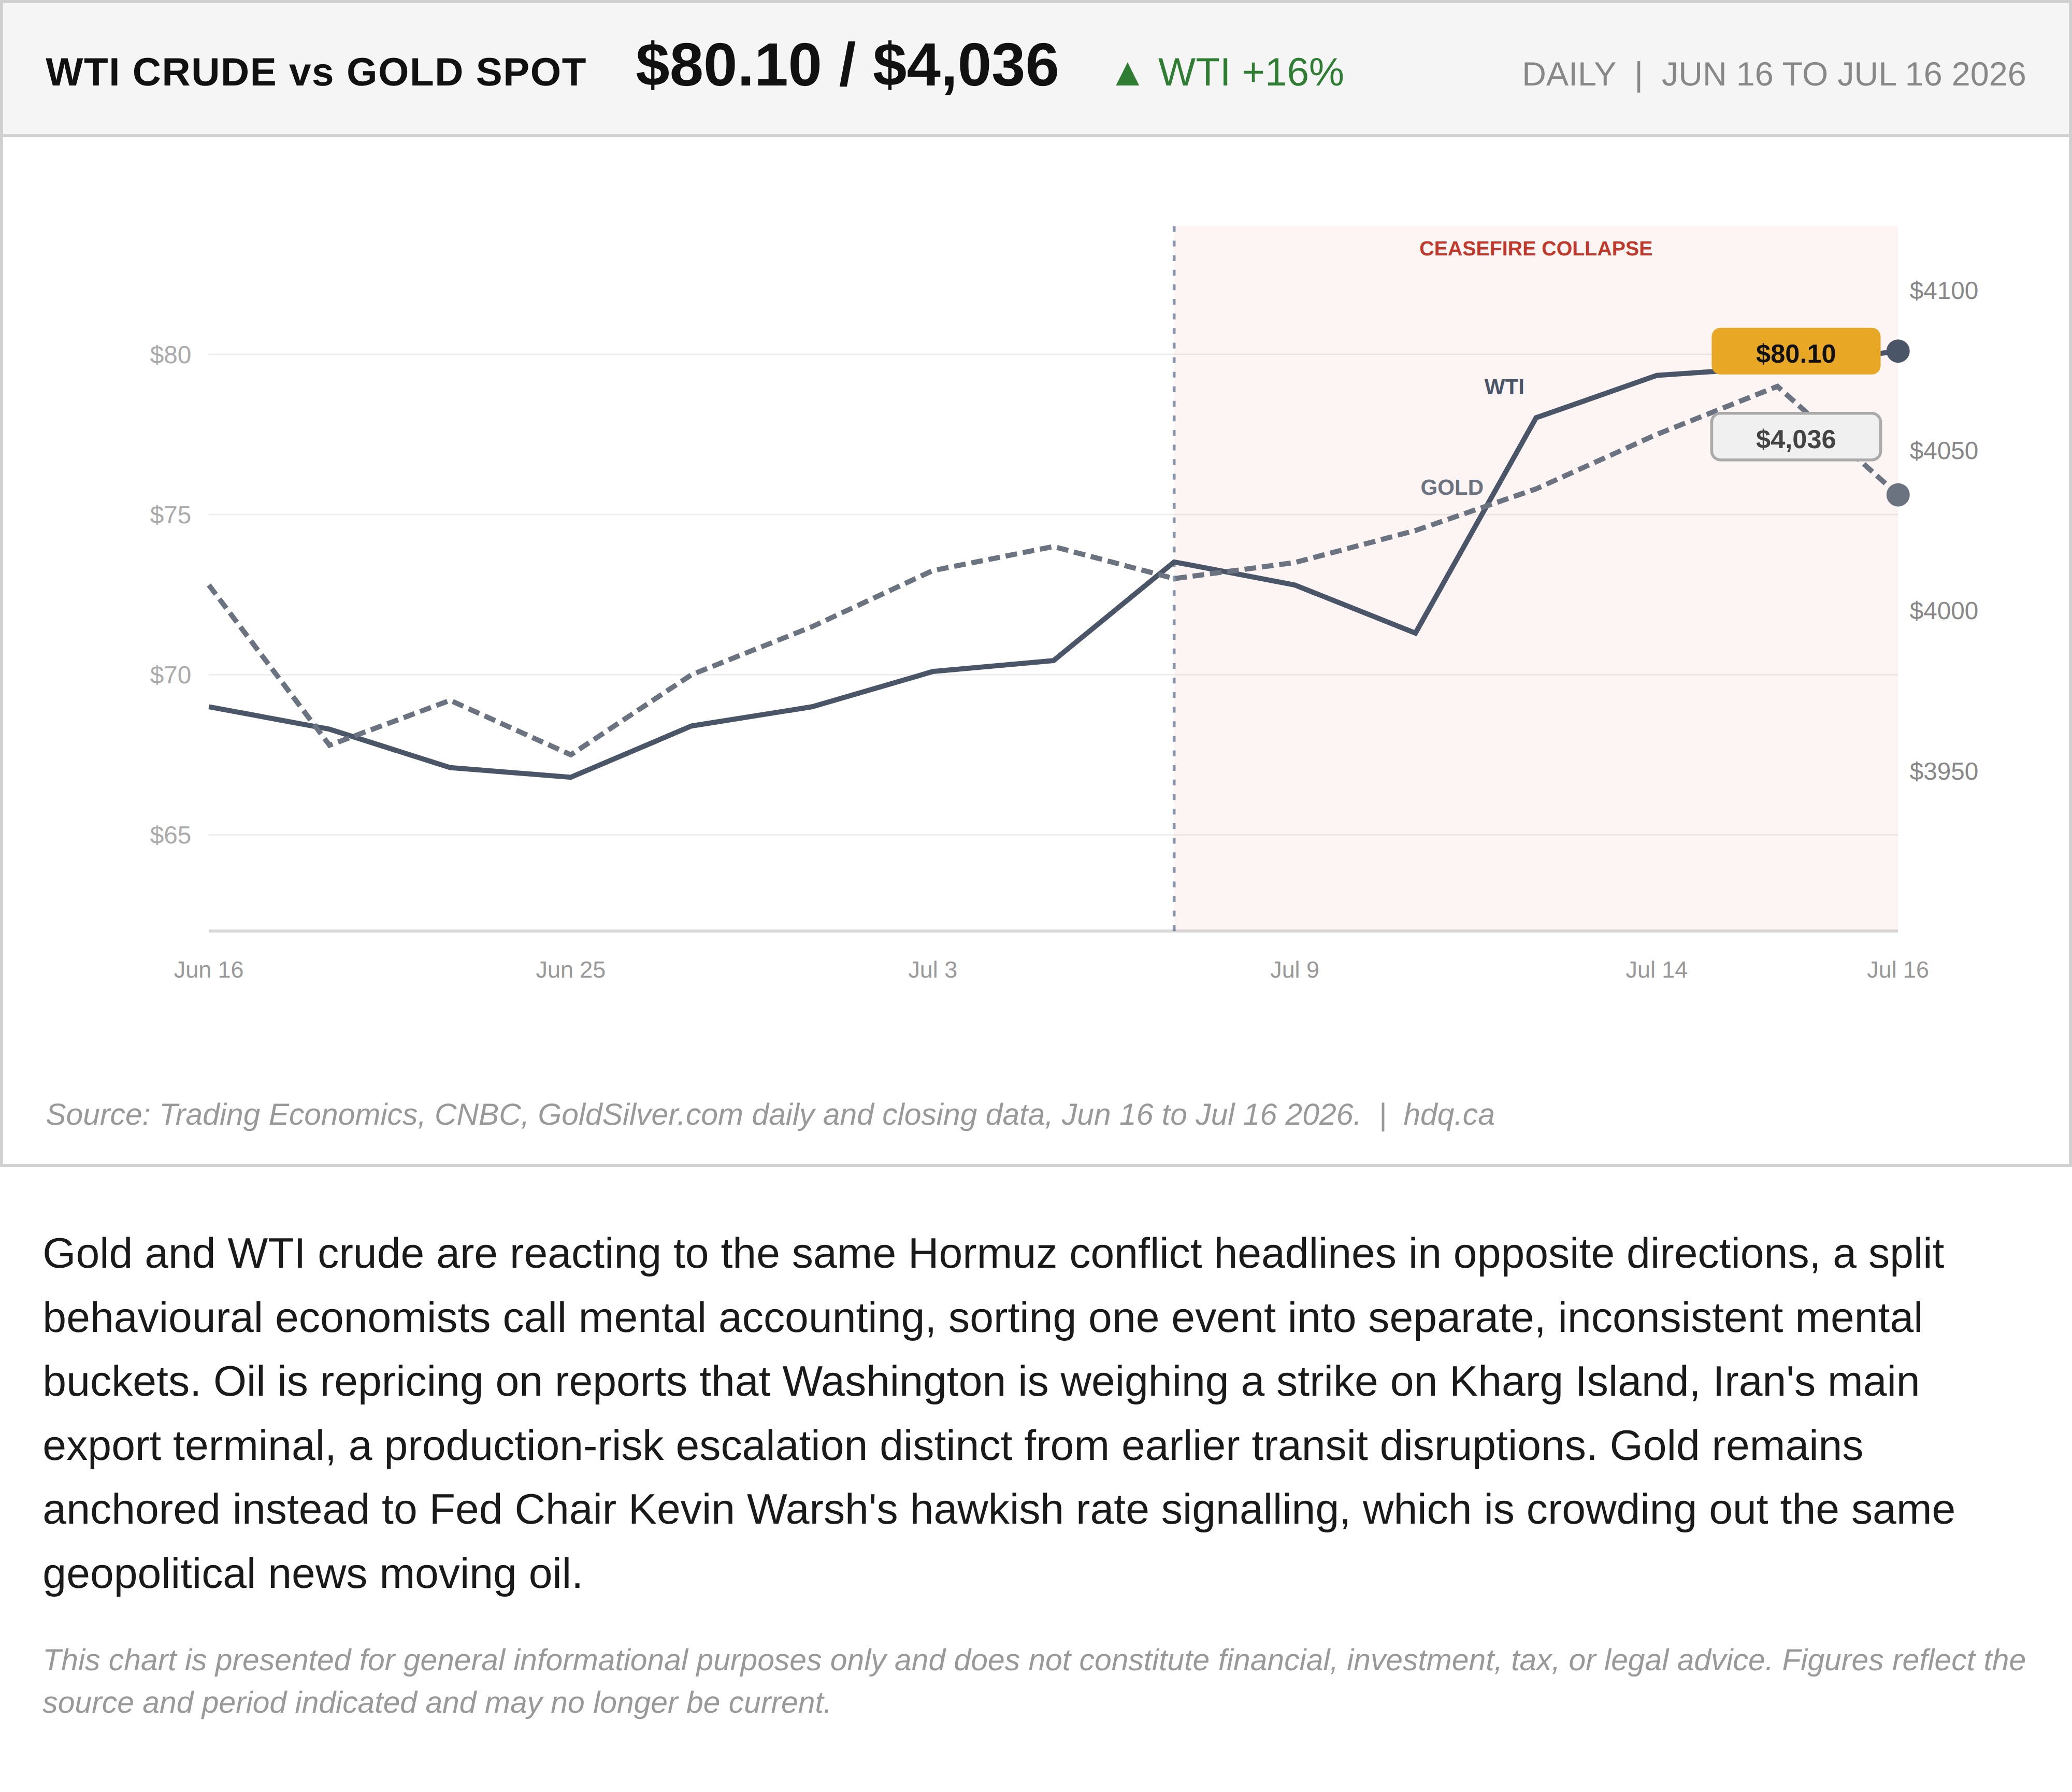
Gold and WTI crude are reacting to the same Hormuz conflict headlines in opposite directions, a split behavioural economists call mental accounting, sorting one event into separate, inconsistent mental buckets. Oil is repricing on reports that Washington is weighing a strike on Kharg Island, Iran's main export terminal, a production-risk escalation distinct from earlier transit disruptions. Gold remains anchored instead to Fed Chair Kevin Warsh's hawkish rate signalling, which is crowding out the same geopolitical news moving oil.
This chart is presented for general informational purposes only and does not constitute financial, investment, tax, or legal advice. Figures reflect the source and period indicated and may no longer be current.

Related charts
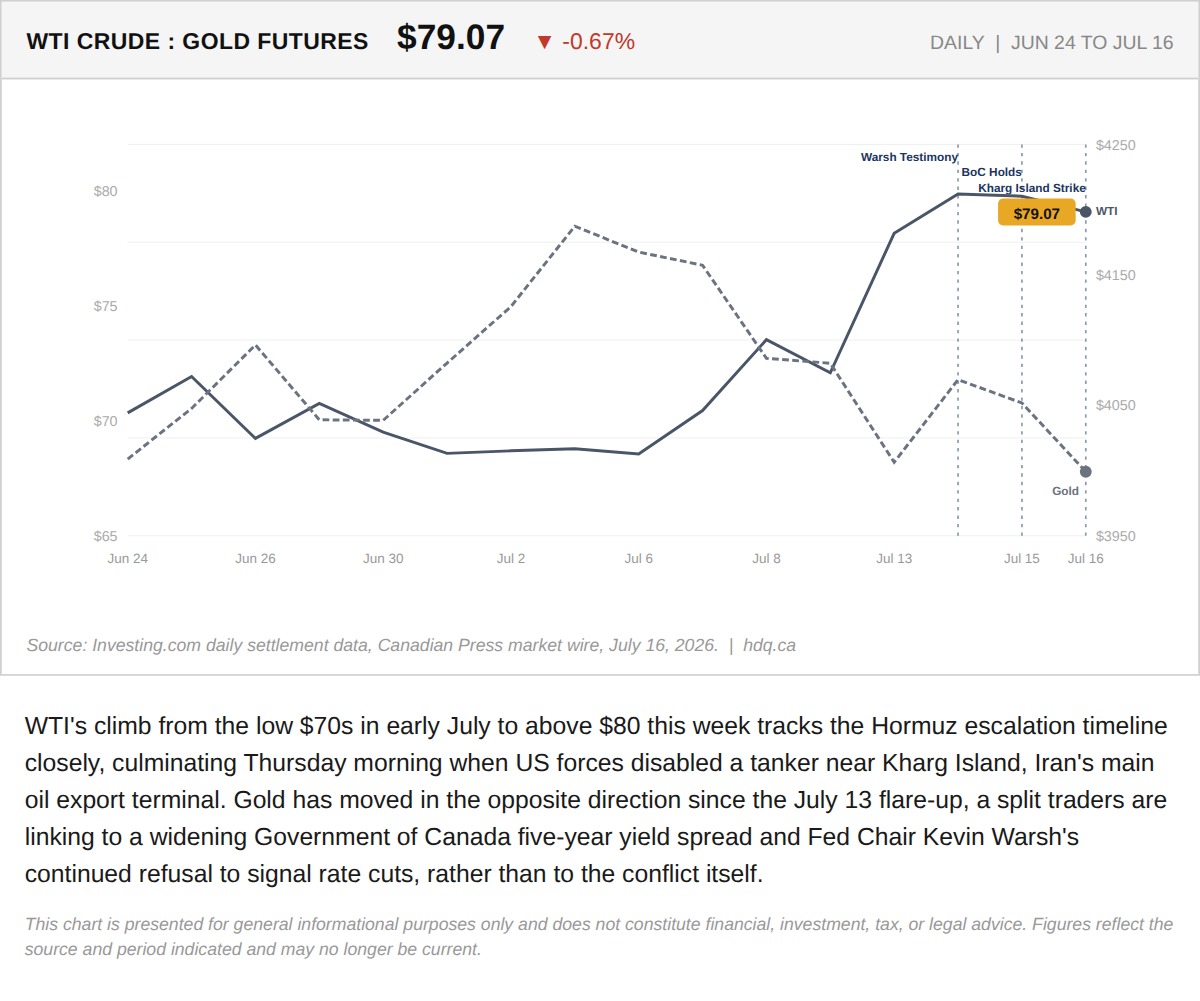
WTI's climb from the low $70s in early July to above $80 this week tracks the Hormuz escalation timeline closely, culminating Thursday…
WTI Crude and Gold Diverge Through the Hormuz Escalation
July 16, 2026
View chart & download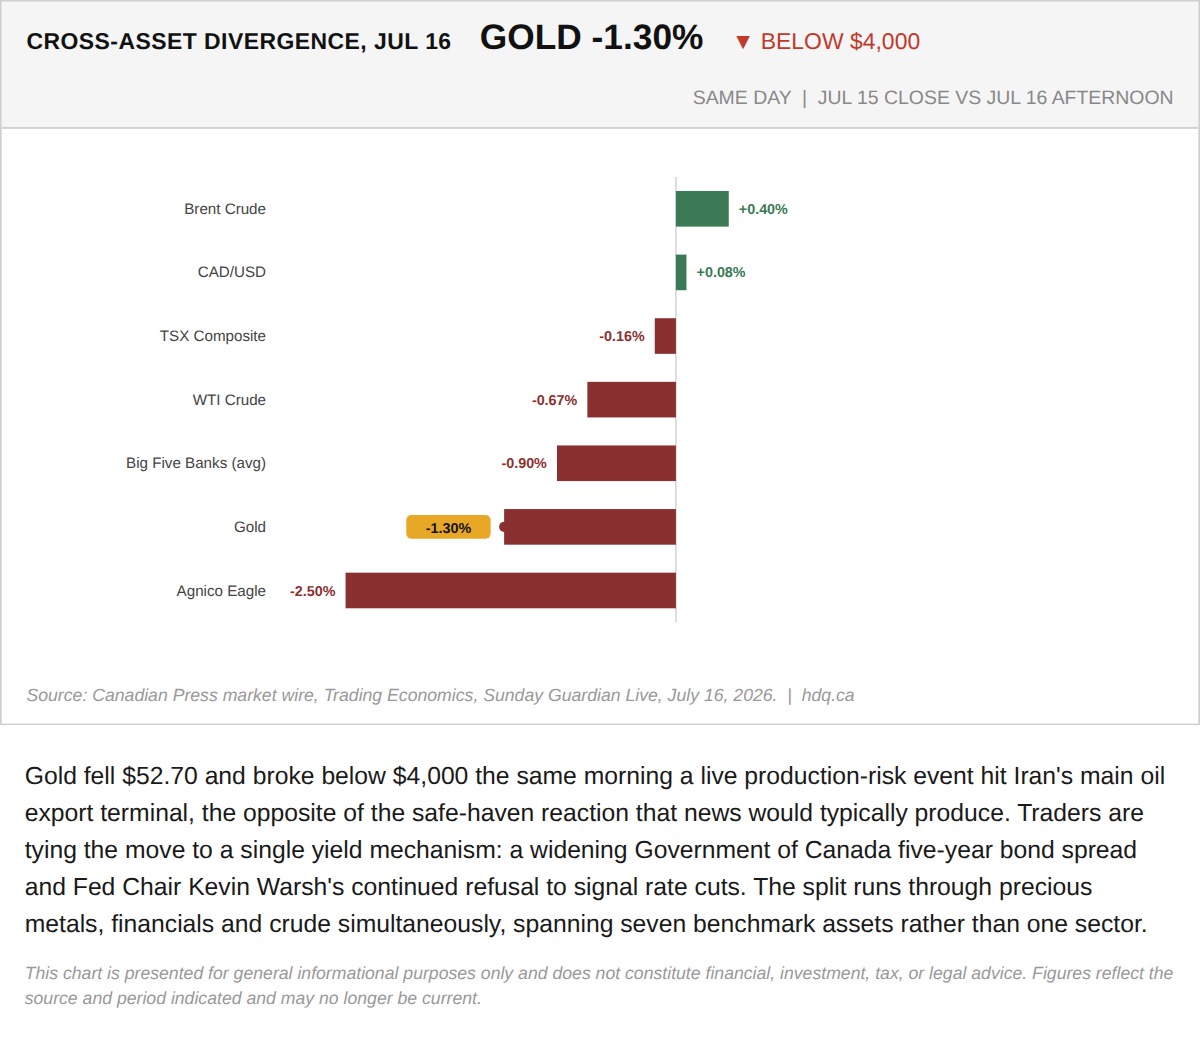
Gold fell $52.70 and broke below $4,000 the same morning a live production-risk event hit Iran's main oil export terminal, the opposite of…
Gold Breaks Below $4,000 as Seven Assets Diverge in One Session
July 16, 2026
View chart & download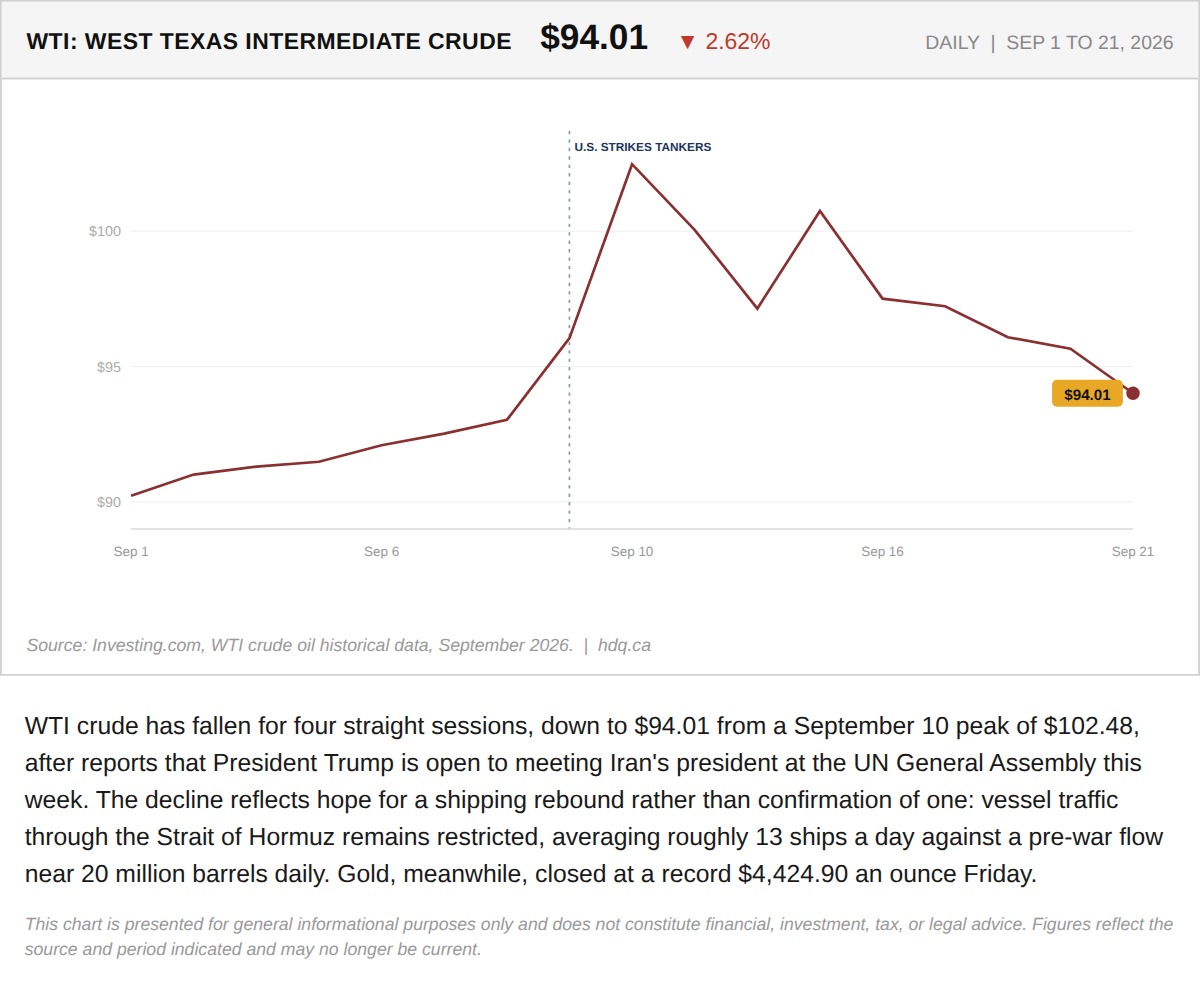
WTI crude has fallen for four straight sessions, down to $94.01 from a September 10 peak of $102.48, after reports that President Trump is…
The Strait of Hormuz Priced In a War. This Week It Started Pricing an Exit.
September 21, 2026
View chart & download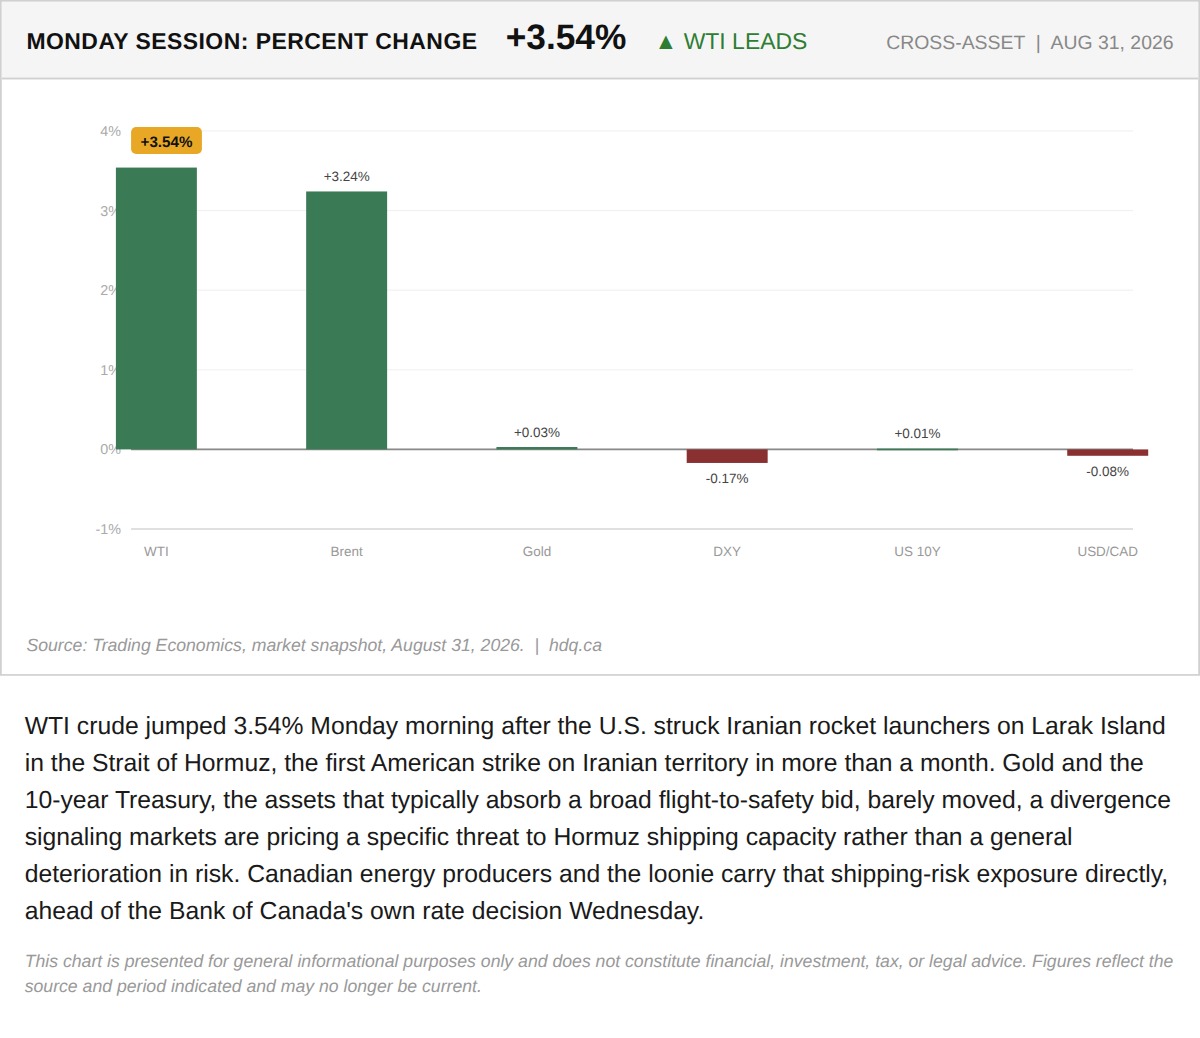
WTI crude jumped 3.54% Monday morning after the U.S.
The US and Iran Exchanged Strikes This Weekend. Only Oil Is Actually Pricing It
August 31, 2026
View chart & download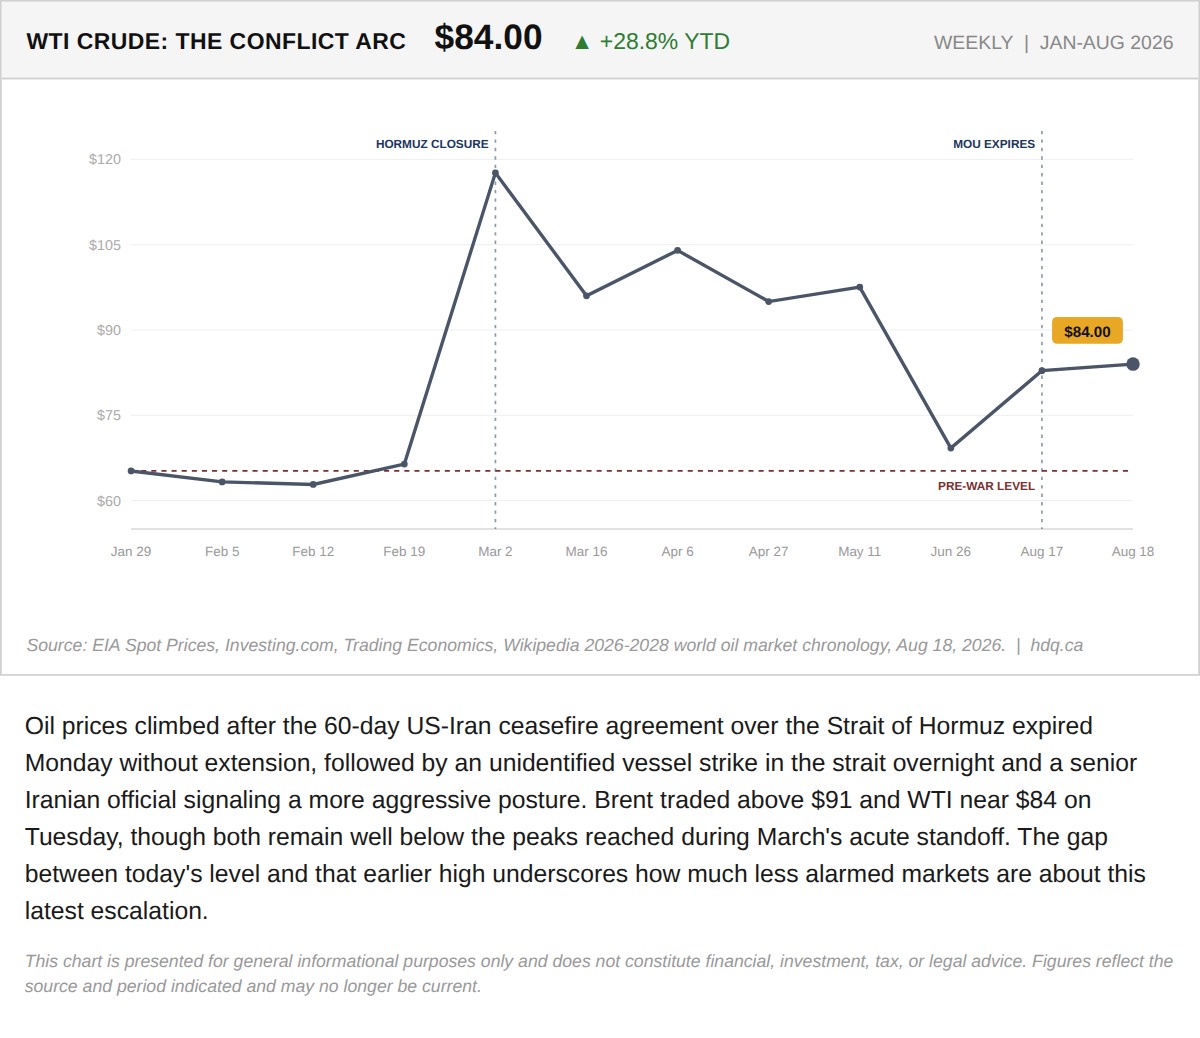
Oil prices climbed after the 60-day US-Iran ceasefire agreement over the Strait of Hormuz expired Monday without extension, followed by an…
WTI Rises as the Hormuz Ceasefire Deadline Passes
August 18, 2026
View chart & download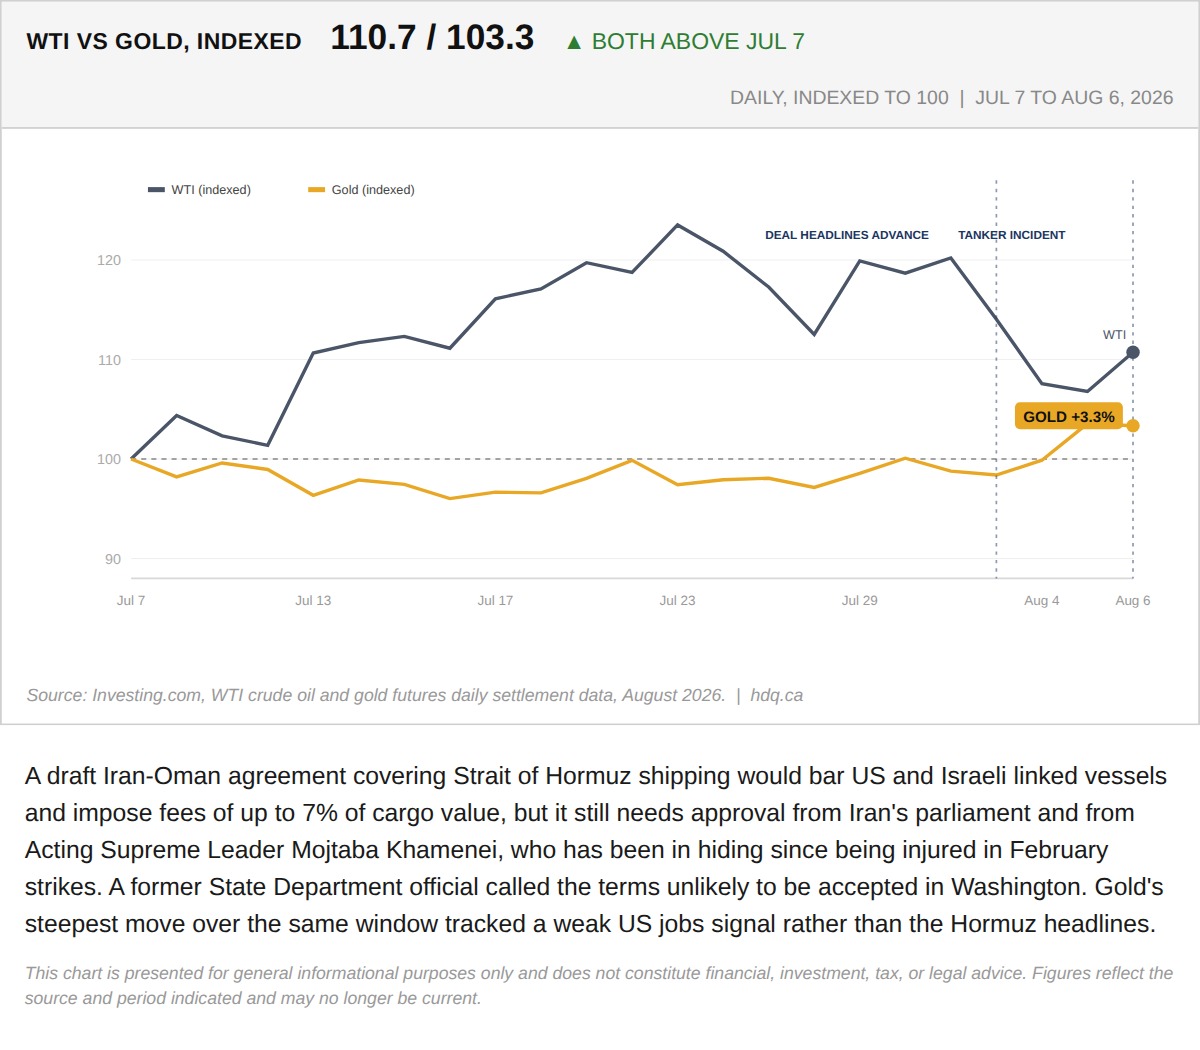
A draft Iran-Oman agreement covering Strait of Hormuz shipping would bar US and Israeli linked vessels and impose fees of up to 7% of cargo…
Iran's Hormuz Shipping Deal Still Needs Sign-Off From a Leader in Hiding
August 7, 2026
View chart & download