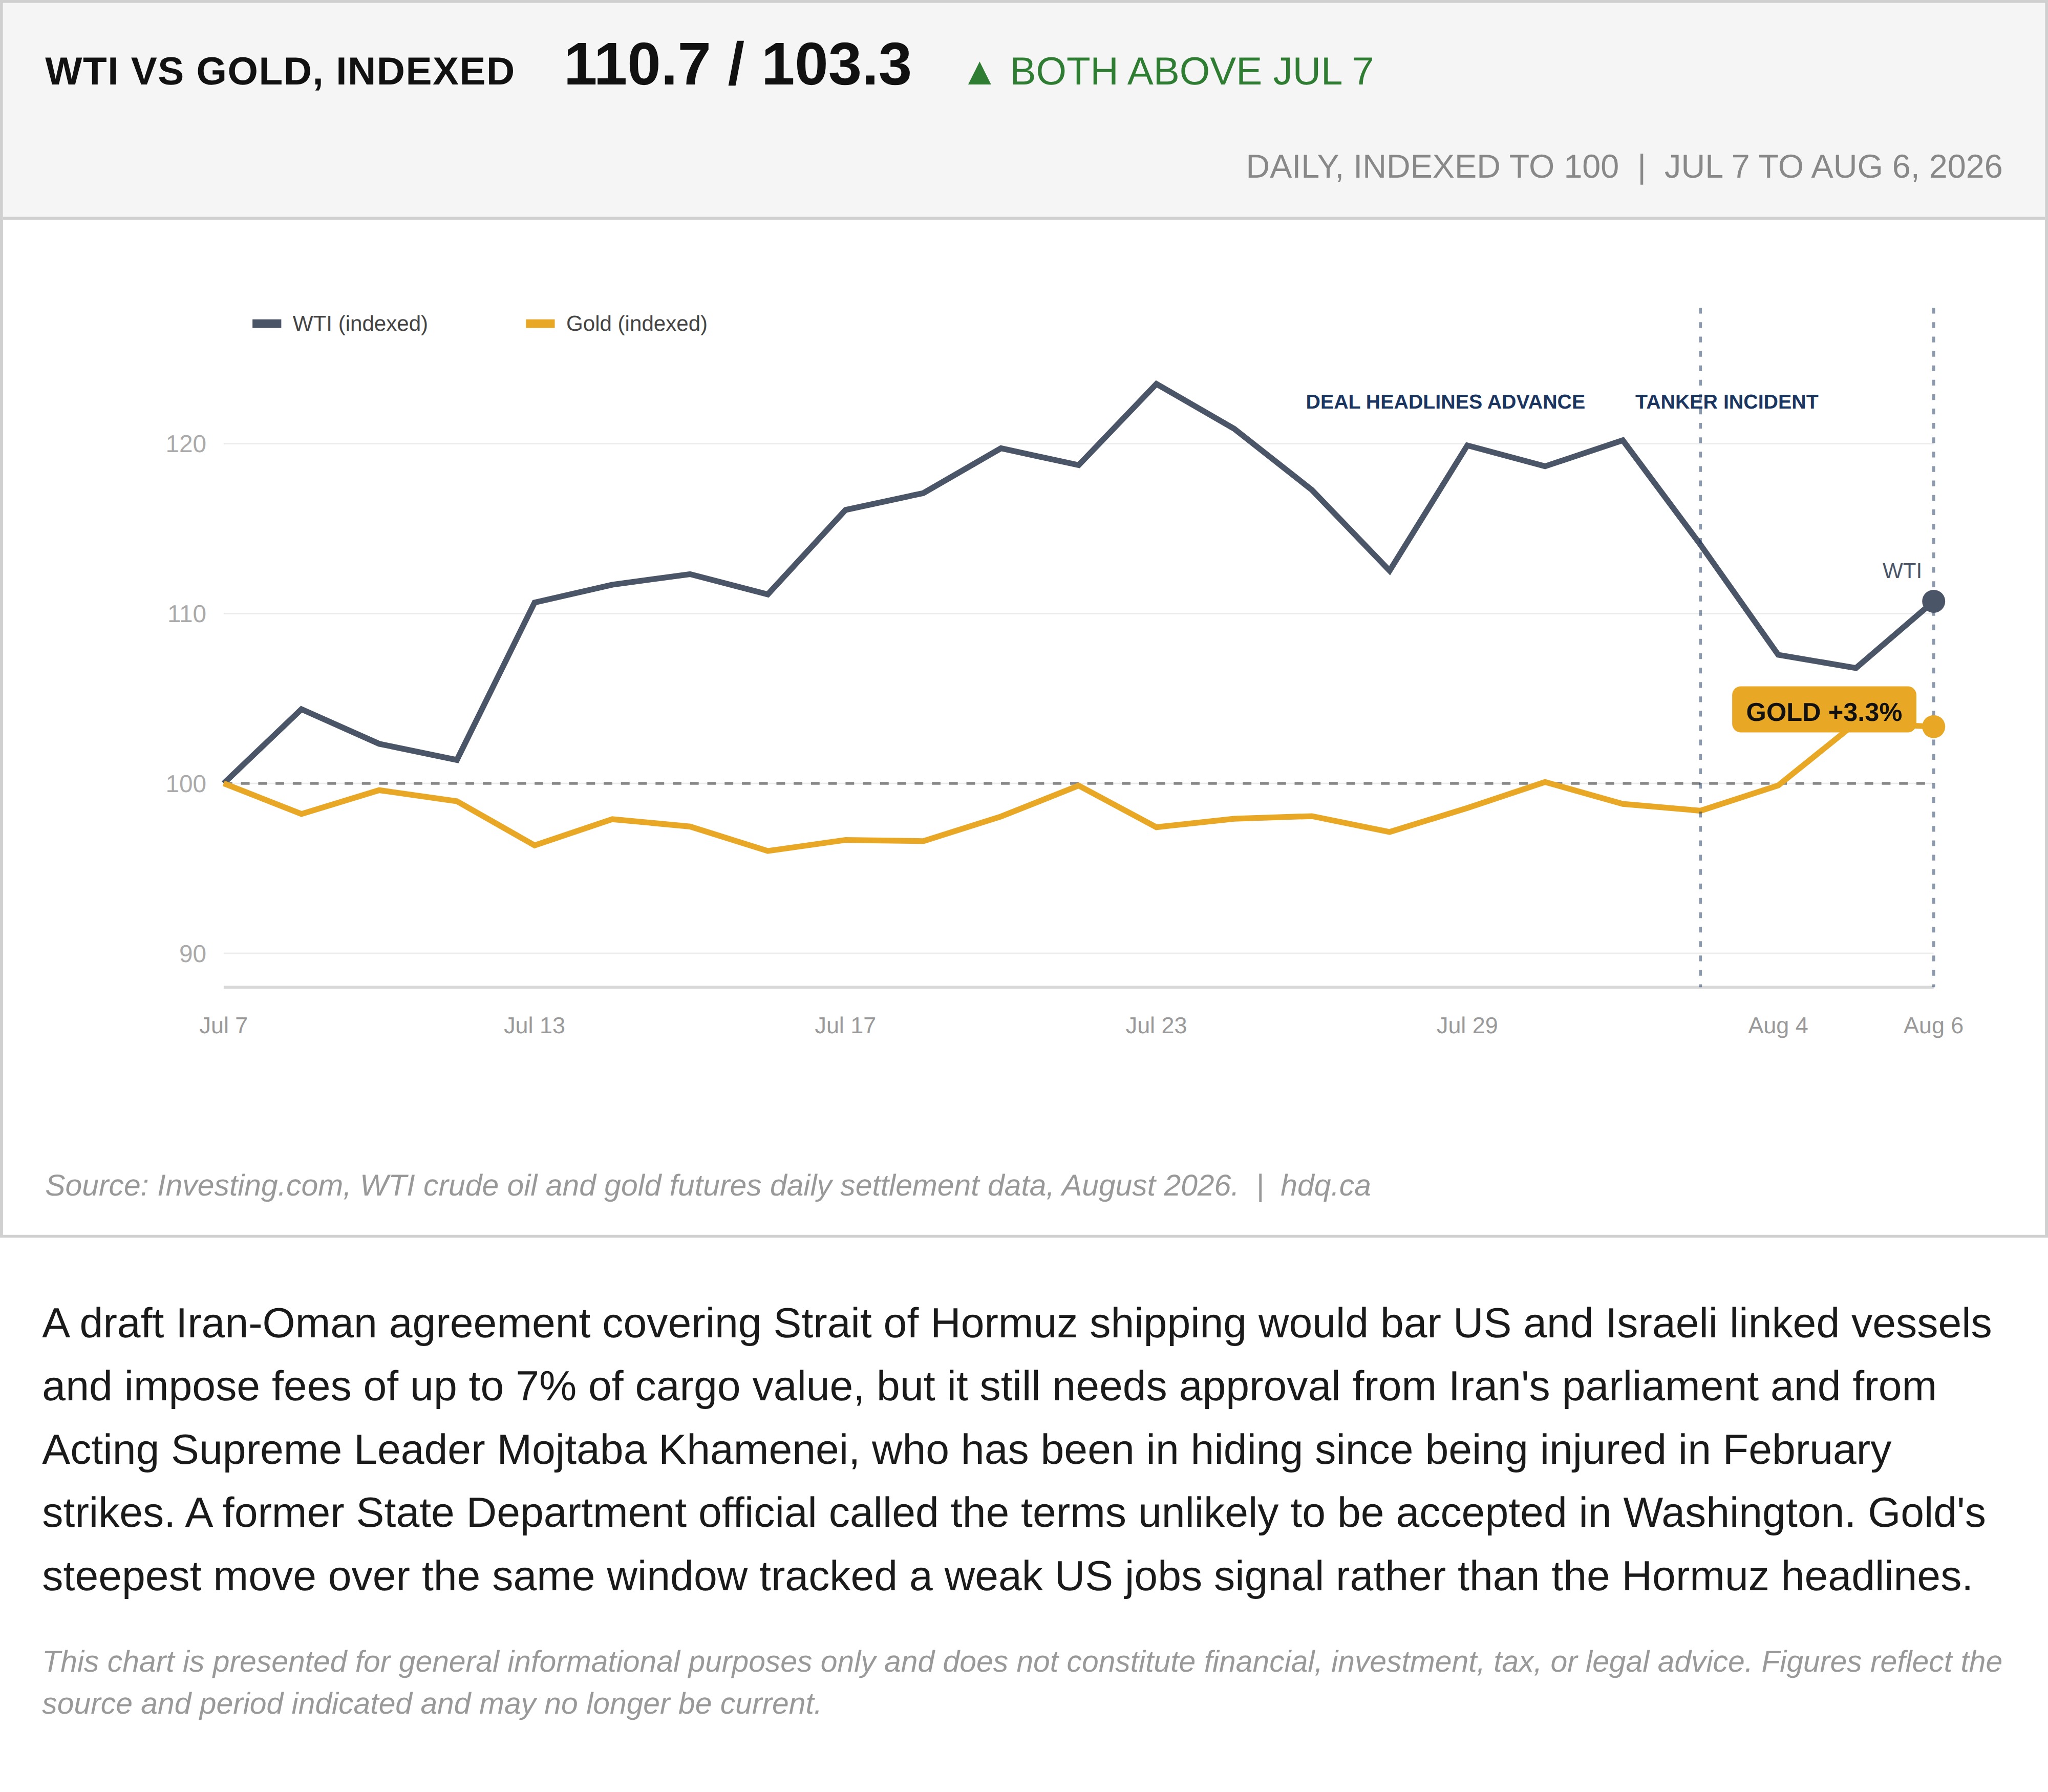
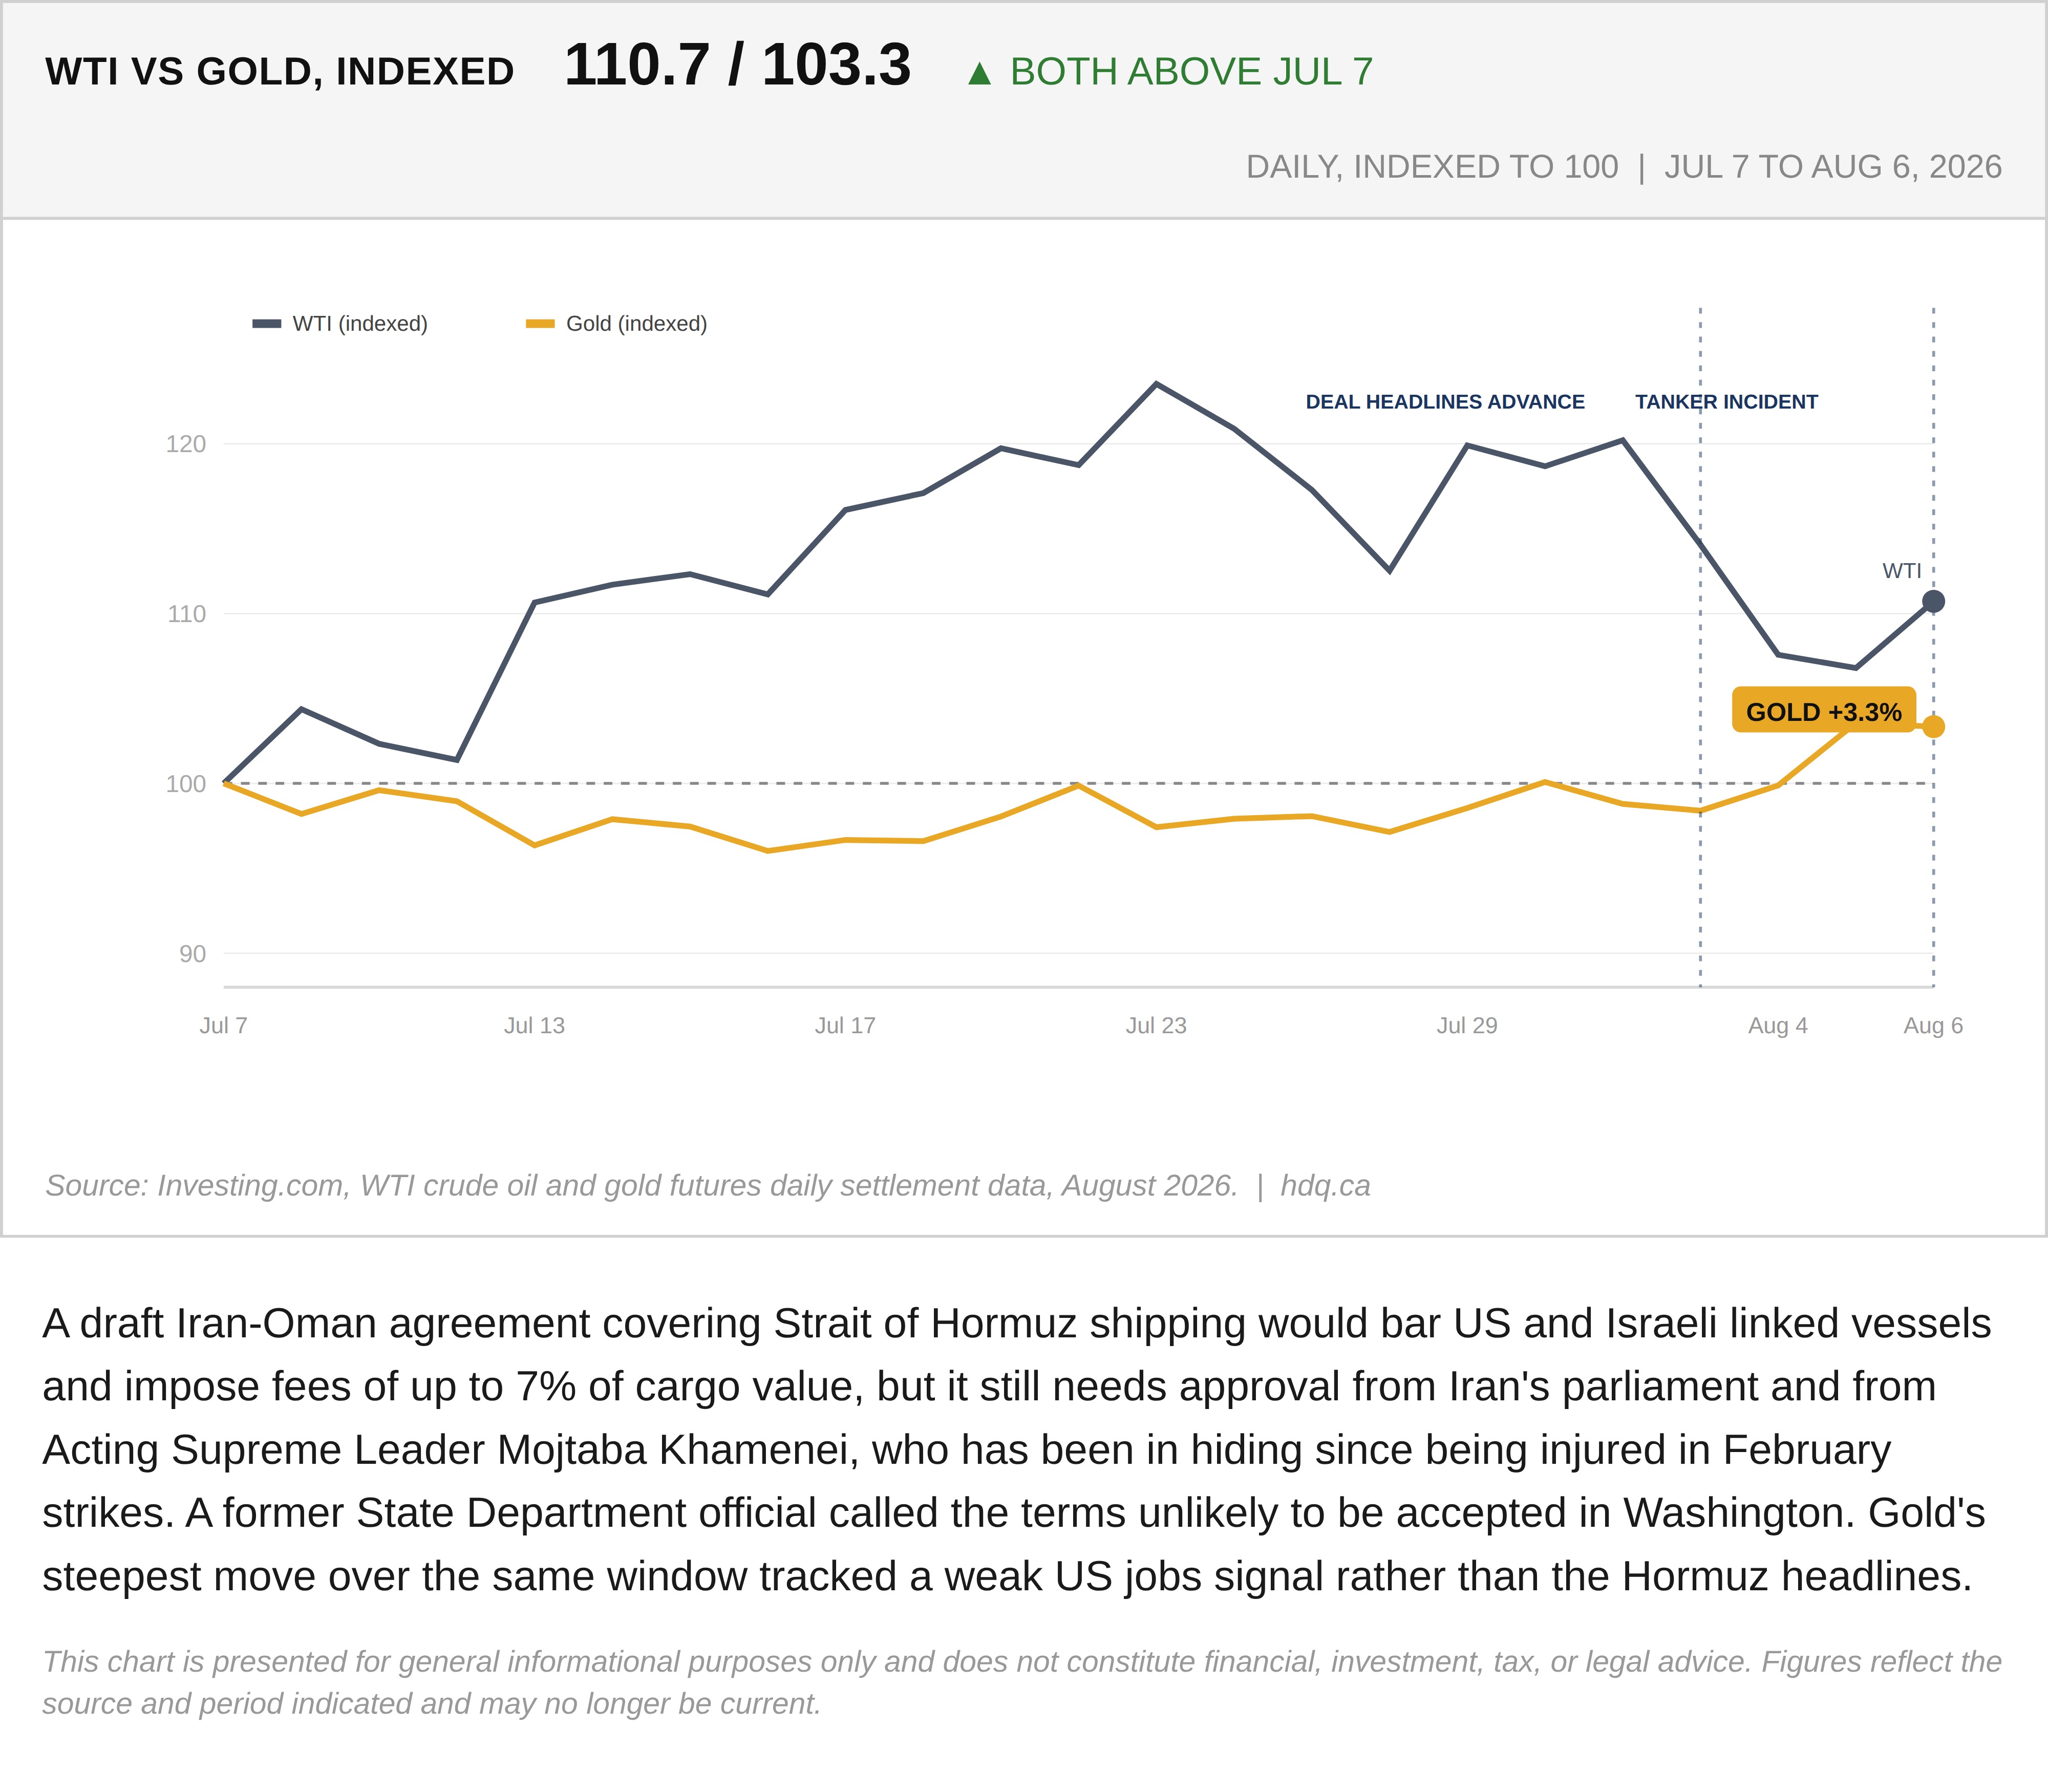
A draft Iran-Oman agreement covering Strait of Hormuz shipping would bar US and Israeli linked vessels and impose fees of up to 7% of cargo value, but it still needs approval from Iran's parliament and from Acting Supreme Leader Mojtaba Khamenei, who has been in hiding since being injured in February strikes. A former State Department official called the terms unlikely to be accepted in Washington. Gold's steepest move over the same window tracked a weak US jobs signal rather than the Hormuz headlines.
This chart is presented for general informational purposes only and does not constitute financial, investment, tax, or legal advice. Figures reflect the source and period indicated and may no longer be current.
Related charts
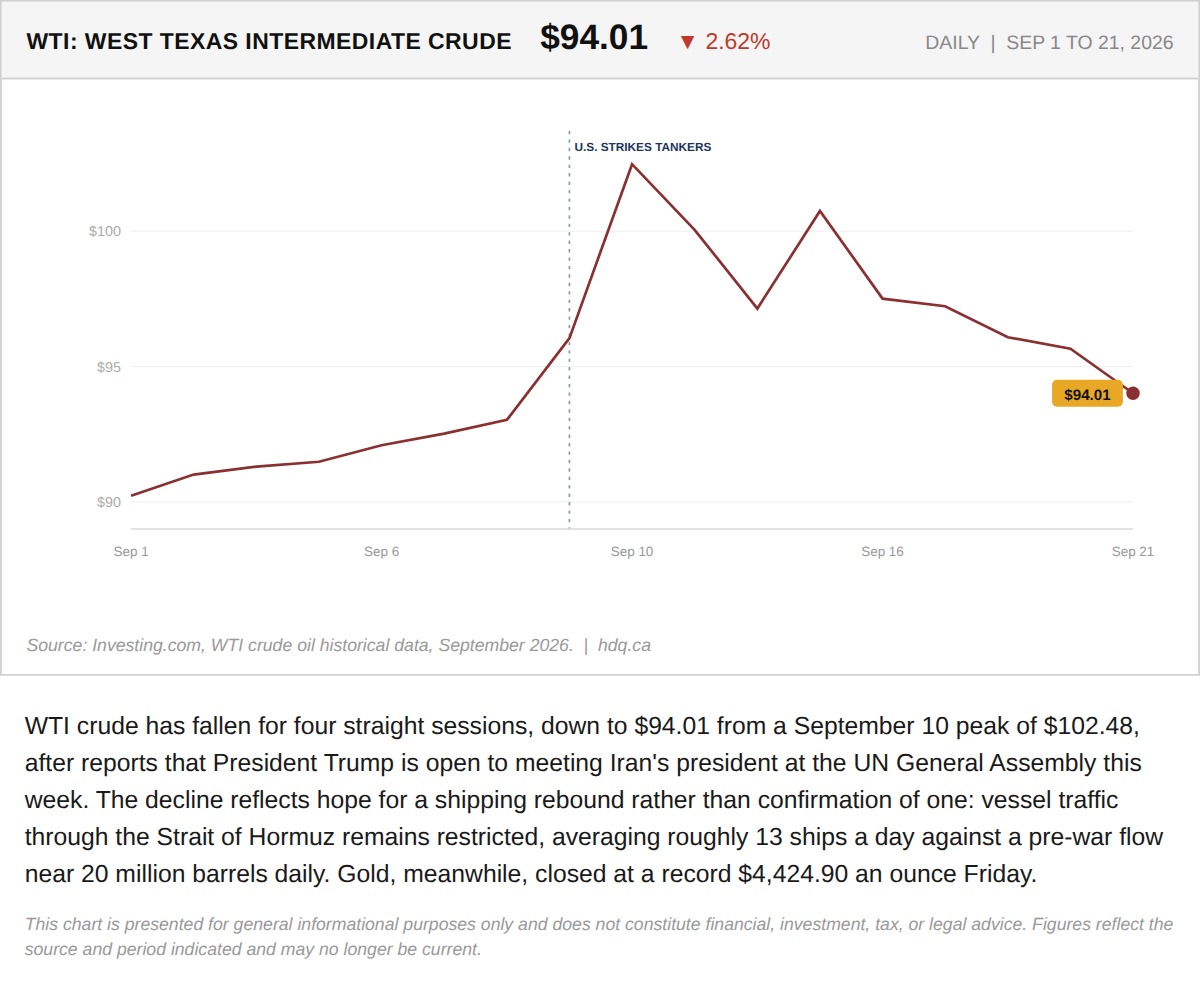
WTI crude has fallen for four straight sessions, down to $94.01 from a September 10 peak of $102.48, after reports that President Trump is…
The Strait of Hormuz Priced In a War. This Week It Started Pricing an Exit.
September 21, 2026
View chart & download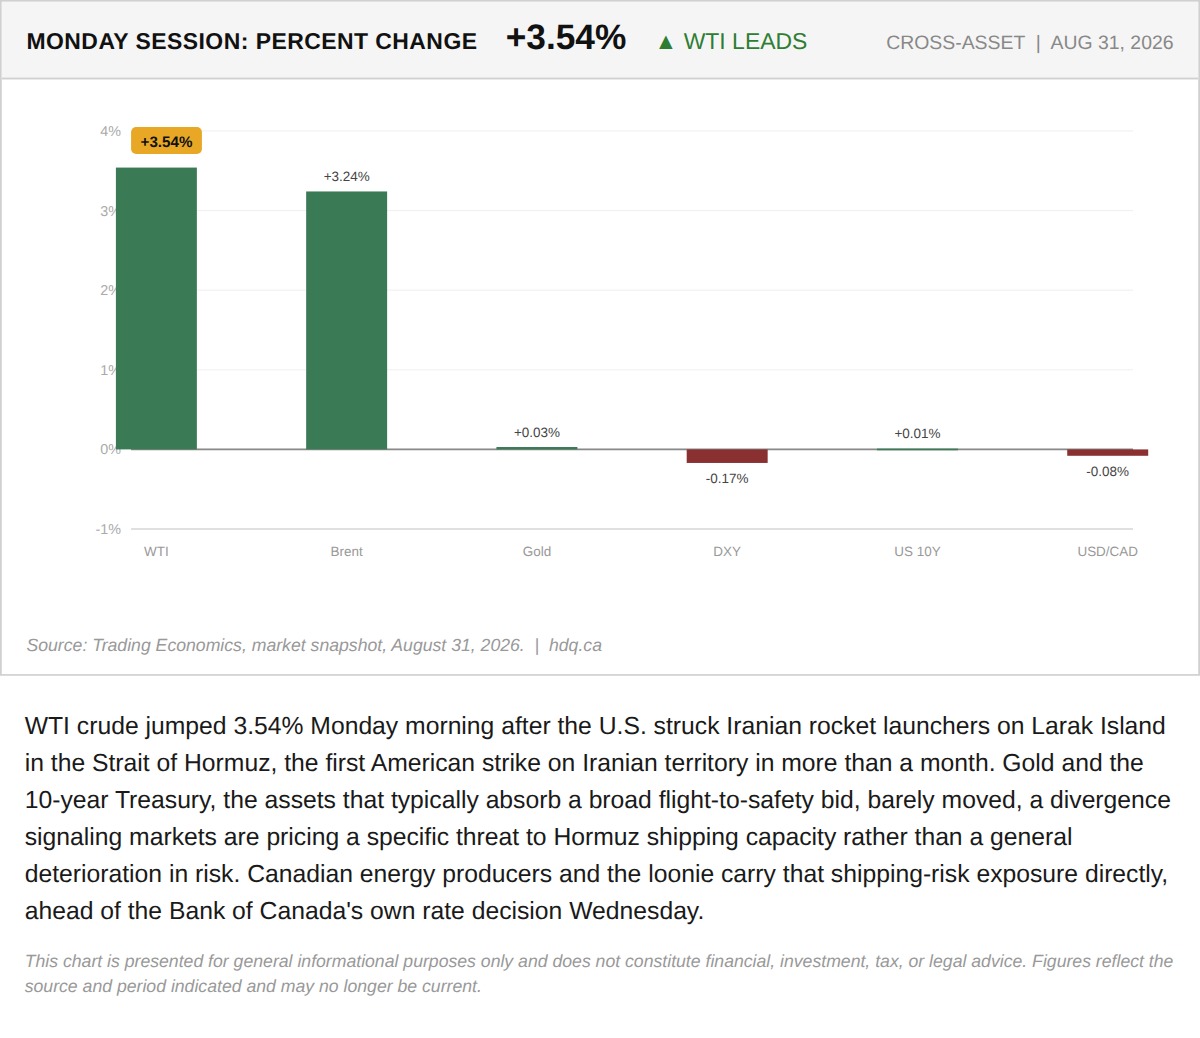
WTI crude jumped 3.54% Monday morning after the U.S.
The US and Iran Exchanged Strikes This Weekend. Only Oil Is Actually Pricing It
August 31, 2026
View chart & download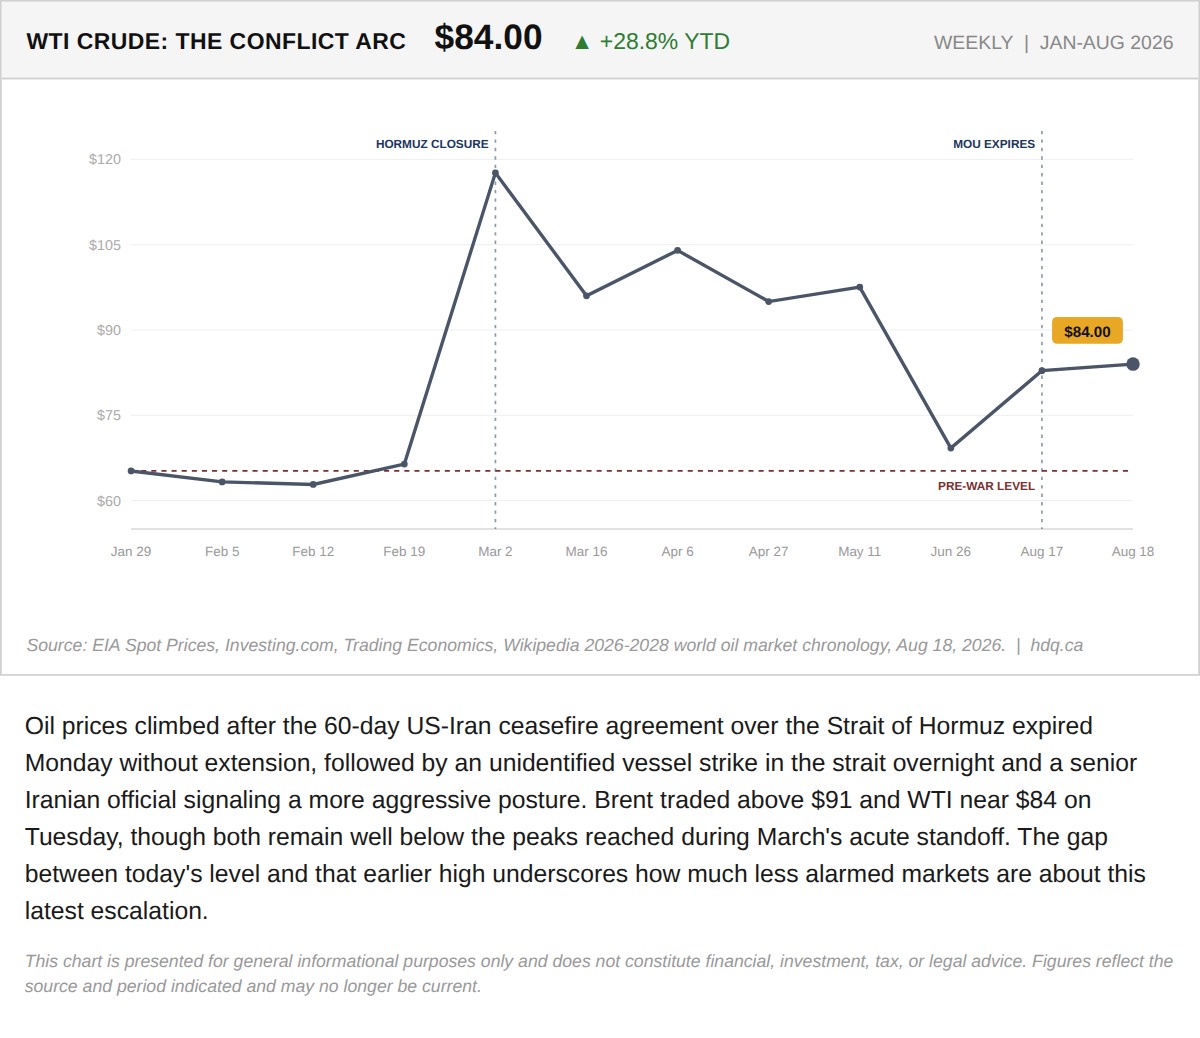
Oil prices climbed after the 60-day US-Iran ceasefire agreement over the Strait of Hormuz expired Monday without extension, followed by an…
WTI Rises as the Hormuz Ceasefire Deadline Passes
August 18, 2026
View chart & download
Brent was the only one of the three to finish above its starting level, while the index and gold both fell.
Brent, TSX and Gold Rebased to the August 31 Close
September 30, 2026
View chart & download
The Bank of Canada held its policy rate at 2.25% for a seventh straight time, yet Canadian yields rose as United States yields surged.
Government of Canada Benchmark Yields, September 2026
September 30, 2026
View chart & download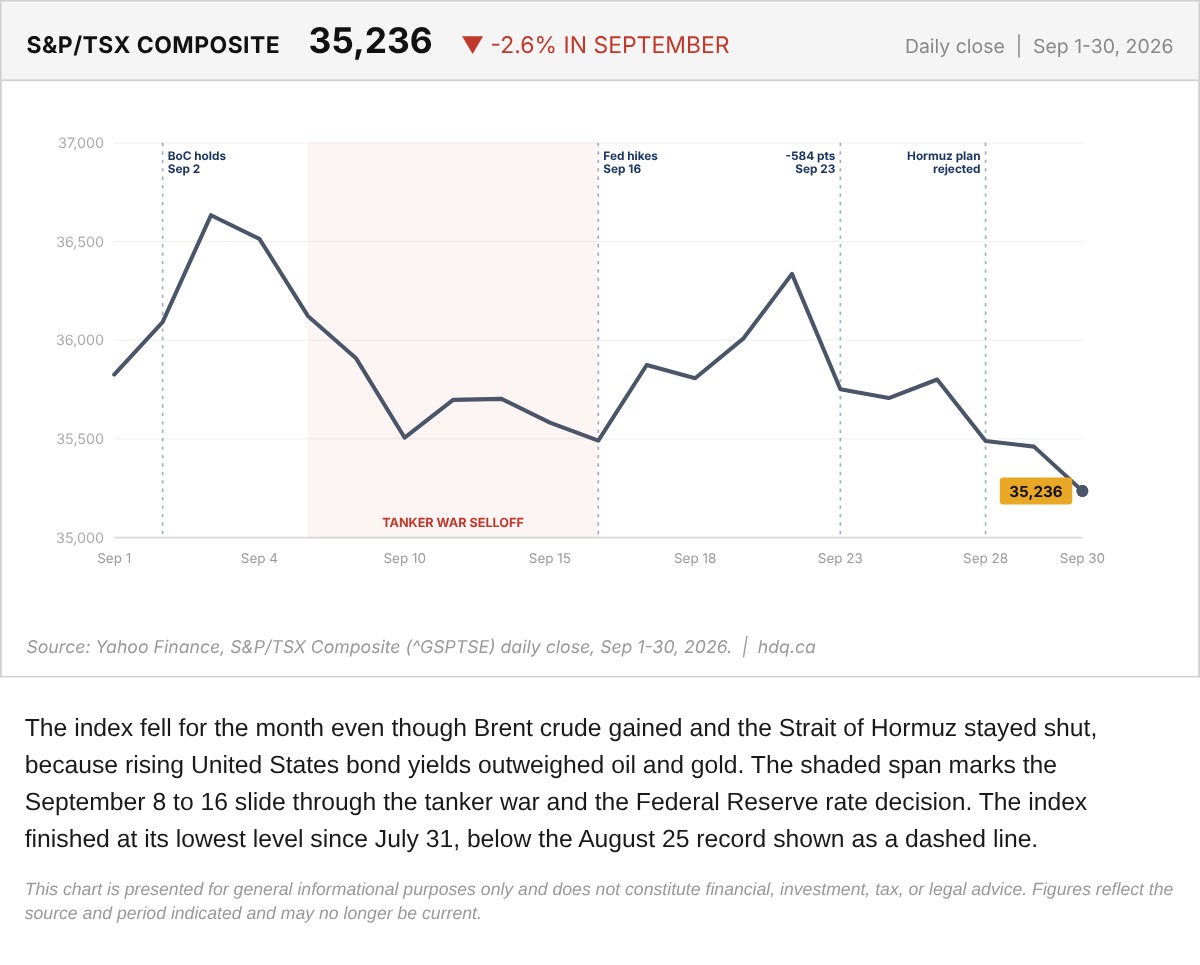
The index fell for the month even though Brent crude gained and the Strait of Hormuz stayed shut, because rising United States bond yields outweighed oil and gold.
S&P/TSX Composite Daily Close Through September 2026
September 30, 2026
View chart & download