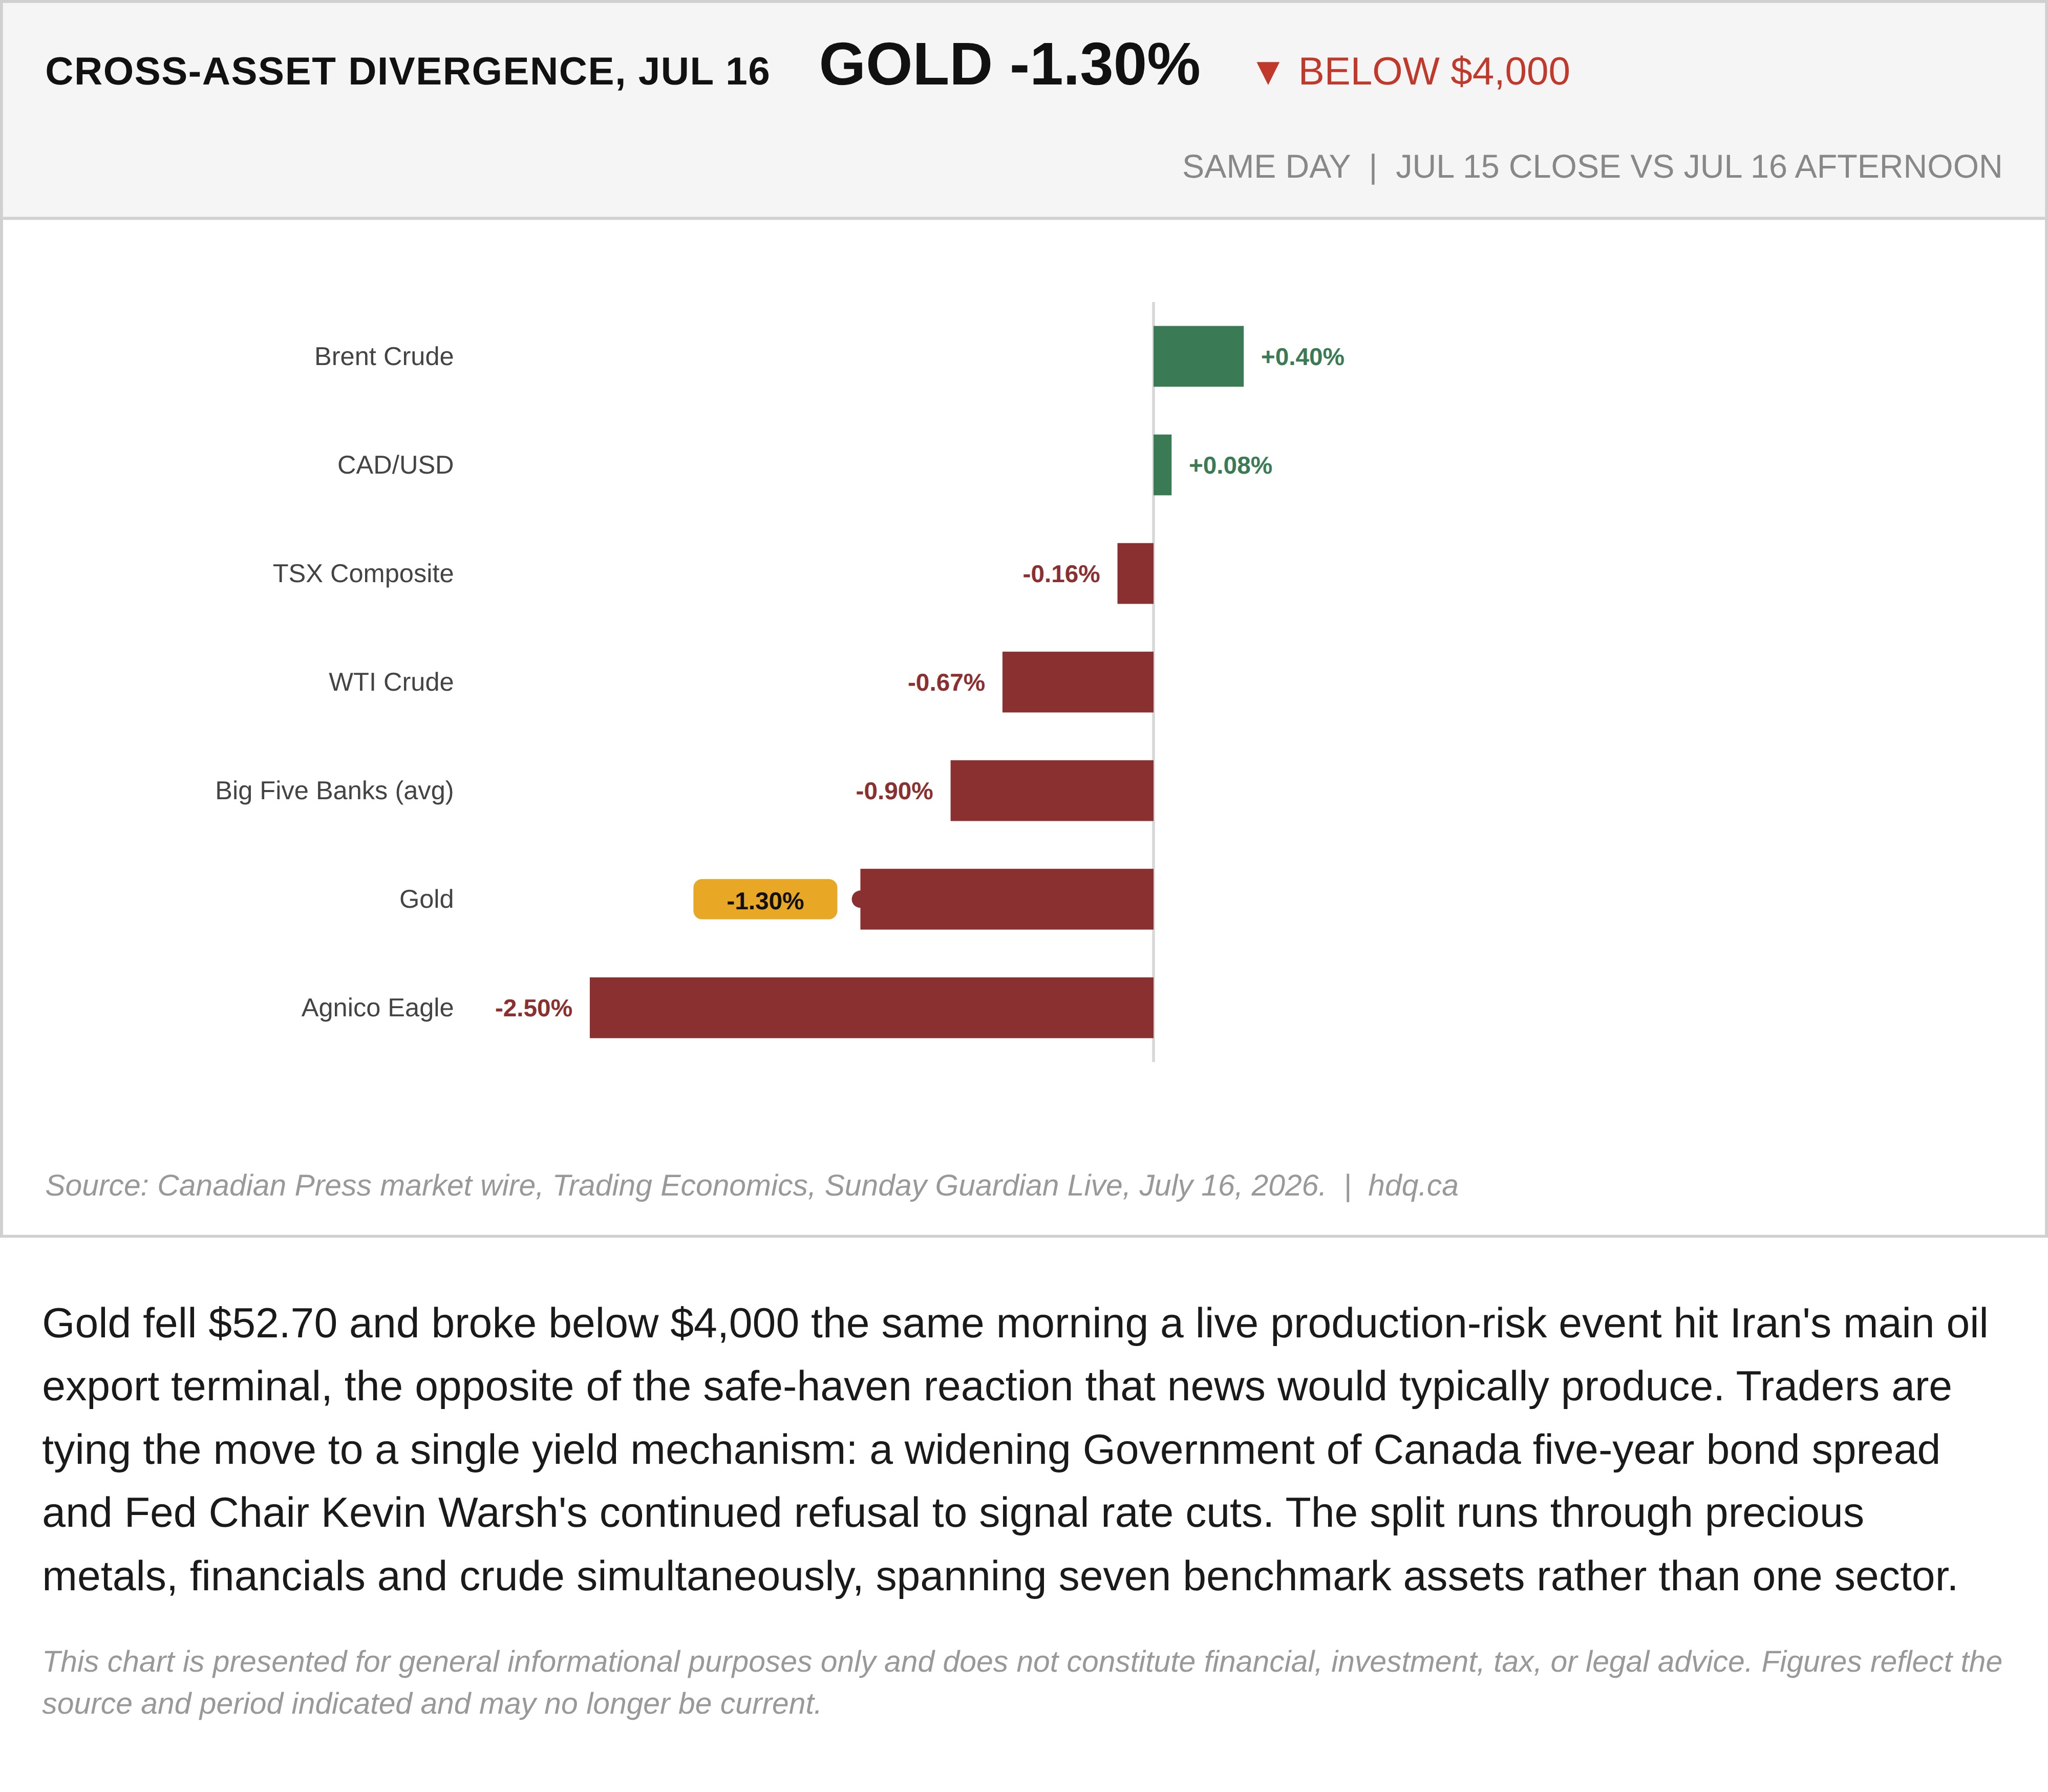
Gold fell $52.70 and broke below $4,000 the same morning a live production-risk event hit Iran's main oil export terminal, the opposite of the safe-haven reaction that news would typically produce. Traders are tying the move to a single yield mechanism: a widening Government of Canada five-year bond spread and Fed Chair Kevin Warsh's continued refusal to signal rate cuts. The split runs through precious metals, financials and crude simultaneously, spanning seven benchmark assets rather than one sector.
This chart is presented for general informational purposes only and does not constitute financial, investment, tax, or legal advice. Figures reflect the source and period indicated and may no longer be current.

Related charts
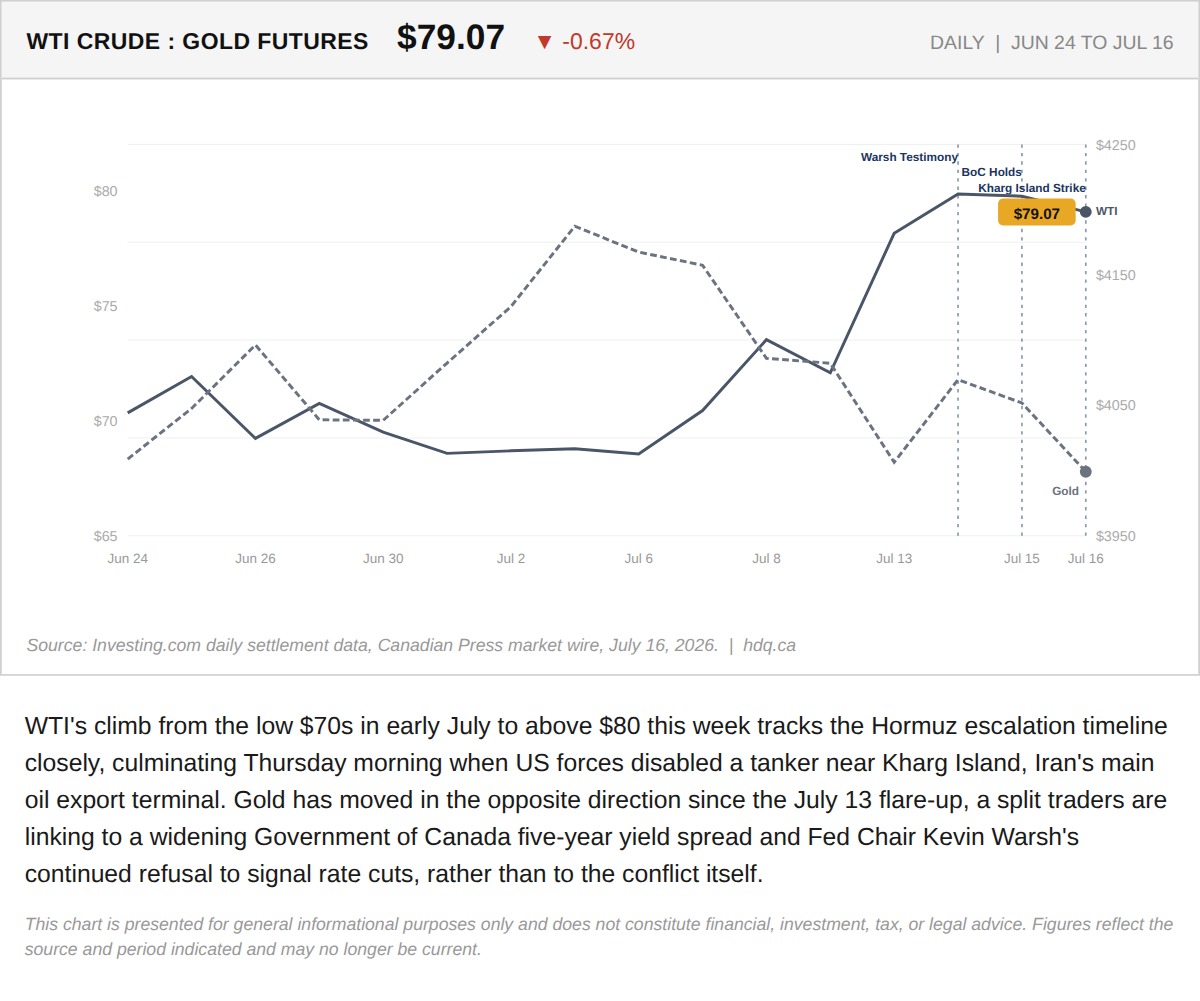
WTI's climb from the low $70s in early July to above $80 this week tracks the Hormuz escalation timeline closely, culminating Thursday…
WTI Crude and Gold Diverge Through the Hormuz Escalation
July 16, 2026
View chart & download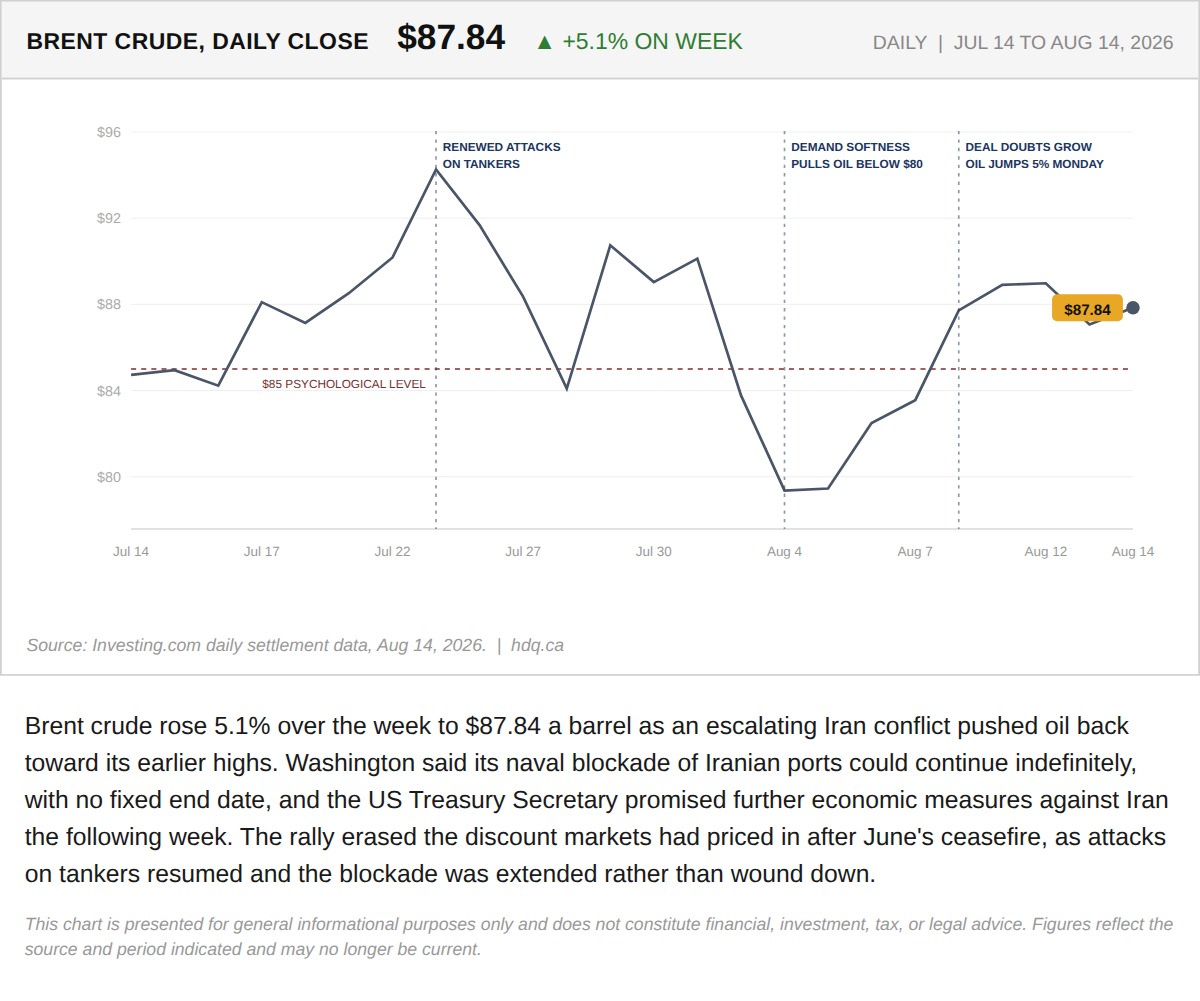
Brent crude rose 5.1% over the week to $87.84 a barrel as an escalating Iran conflict pushed oil back toward its earlier highs.
The TSX and Gold Both Set Records This Week. That Should Not Happen Together.
August 15, 2026
View chart & download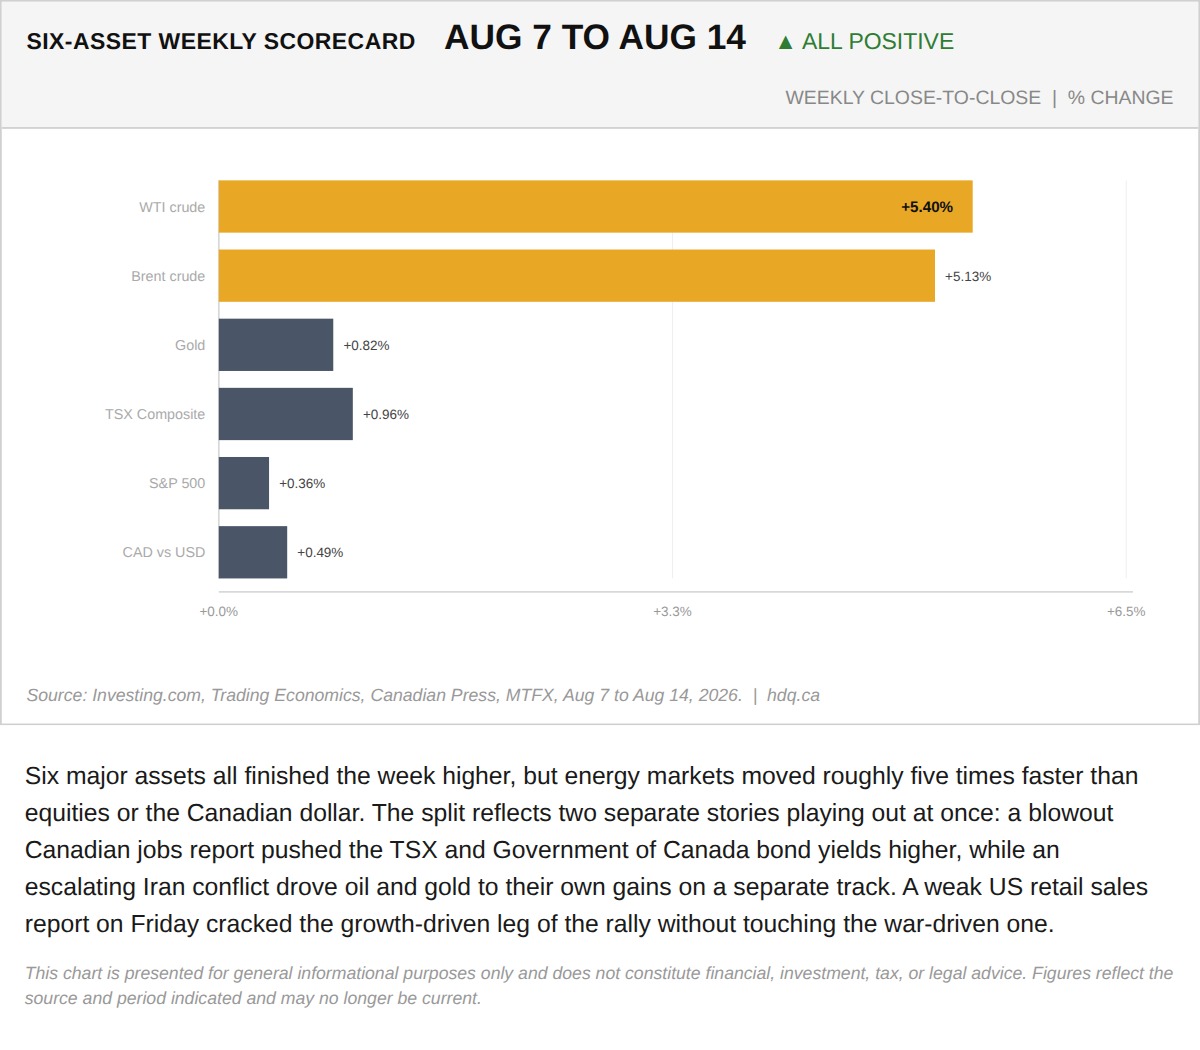
Six major assets all finished the week higher, but energy markets moved roughly five times faster than equities or the Canadian dollar.
The TSX and Gold Both Set Records This Week. That Should Not Happen Together.
August 15, 2026
View chart & download
The S&P/TSX Composite closed July at 35,226, up 1.06% for the month, a modest headline figure that conceals sharp intra-month swings.
S&P/TSX Composite closes July up 1.06% after a volatile month
July 31, 2026
View chart & download
Brent and WTI crude both surged in July, with WTI ending the month at $85.47, up 23.0%, after round-tripping from a five-month low near $68.74.
WTI and Brent crude surge in July as the Iran ceasefire collapses
July 31, 2026
View chart & download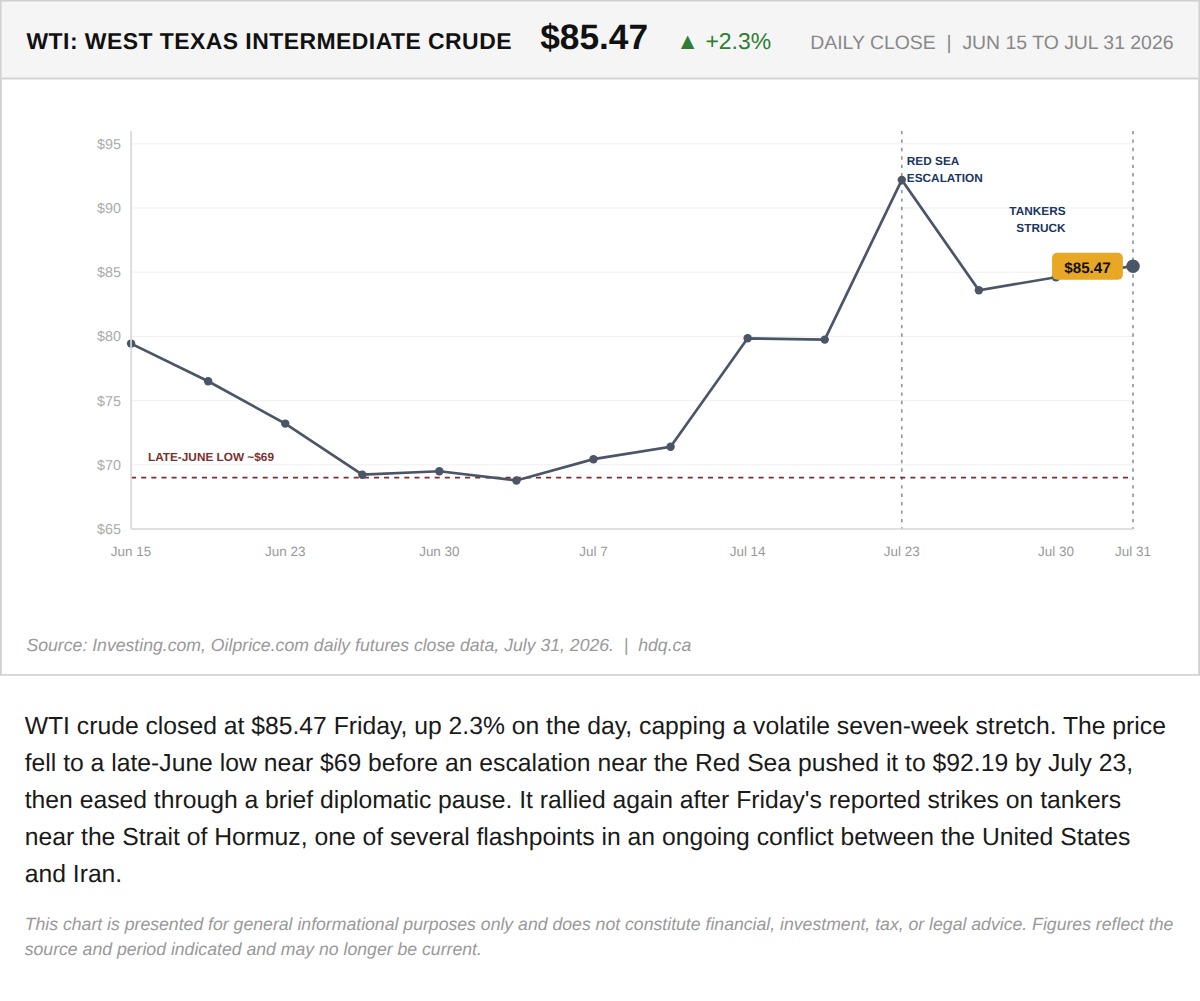
WTI crude closed at $85.47 Friday, up 2.3% on the day, capping a volatile seven-week stretch.
WTI crude closes at $85.47 after tanker strikes near the Strait of Hormuz
August 1, 2026
View chart & download