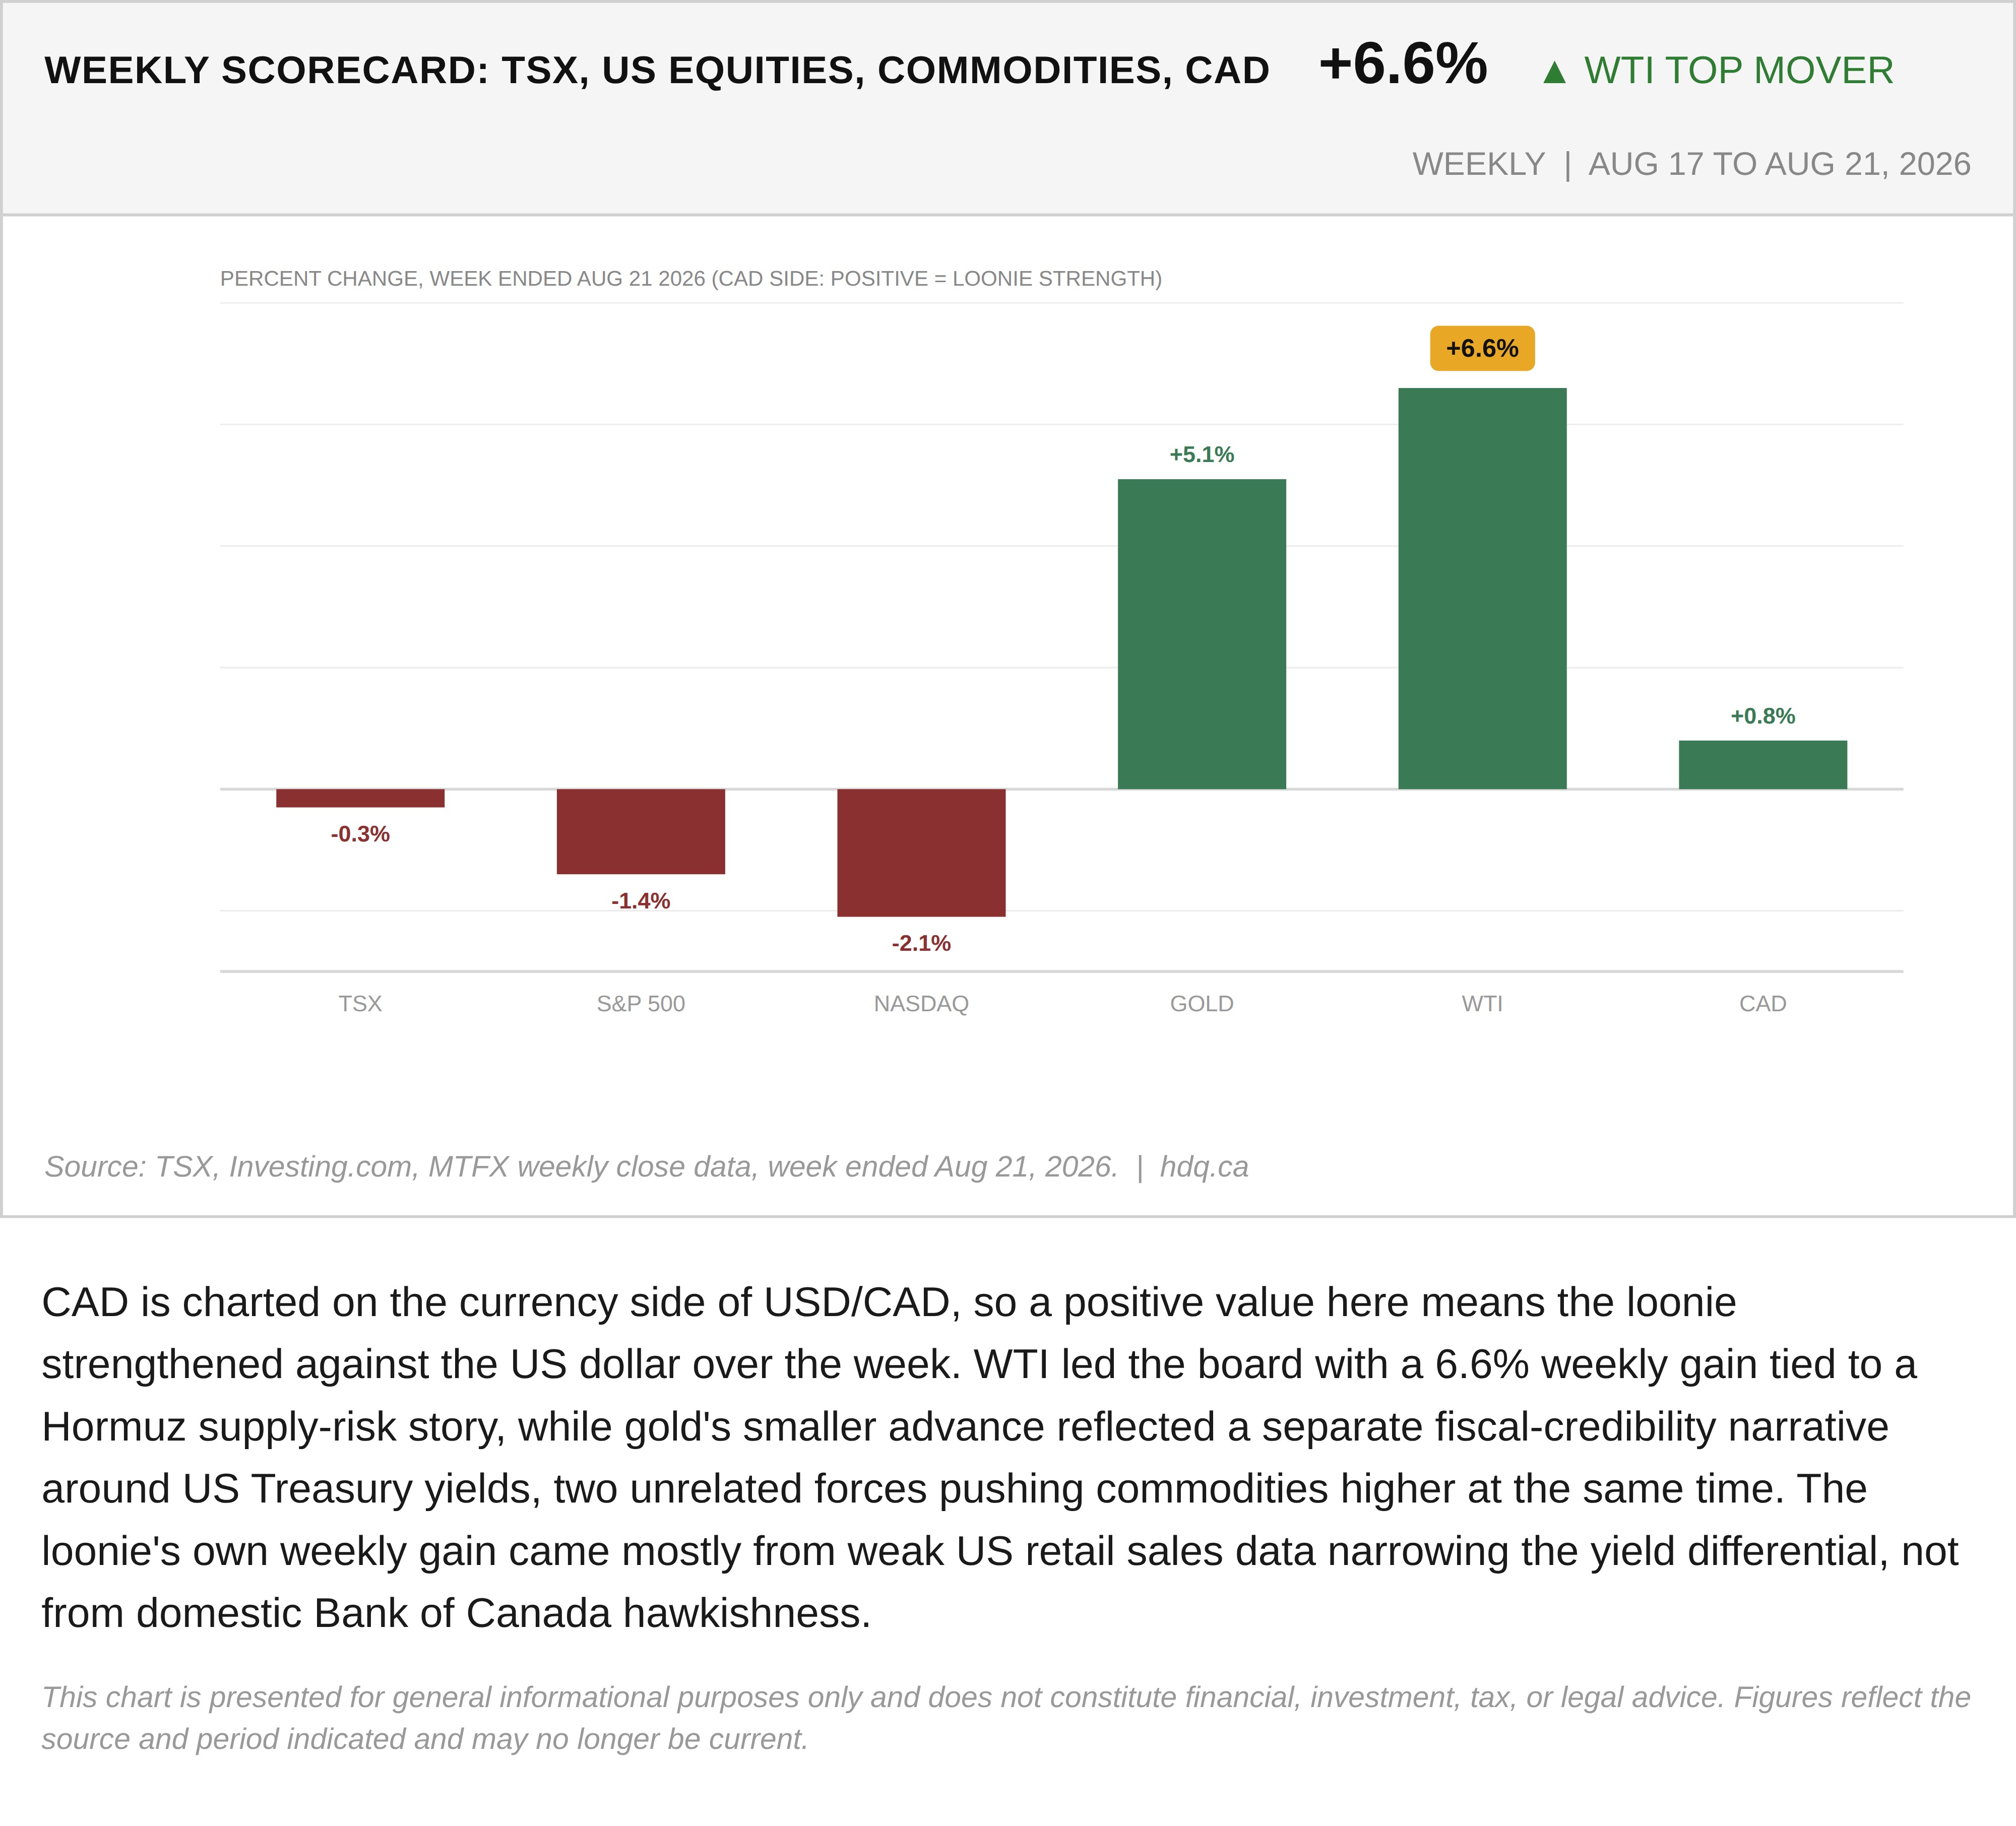
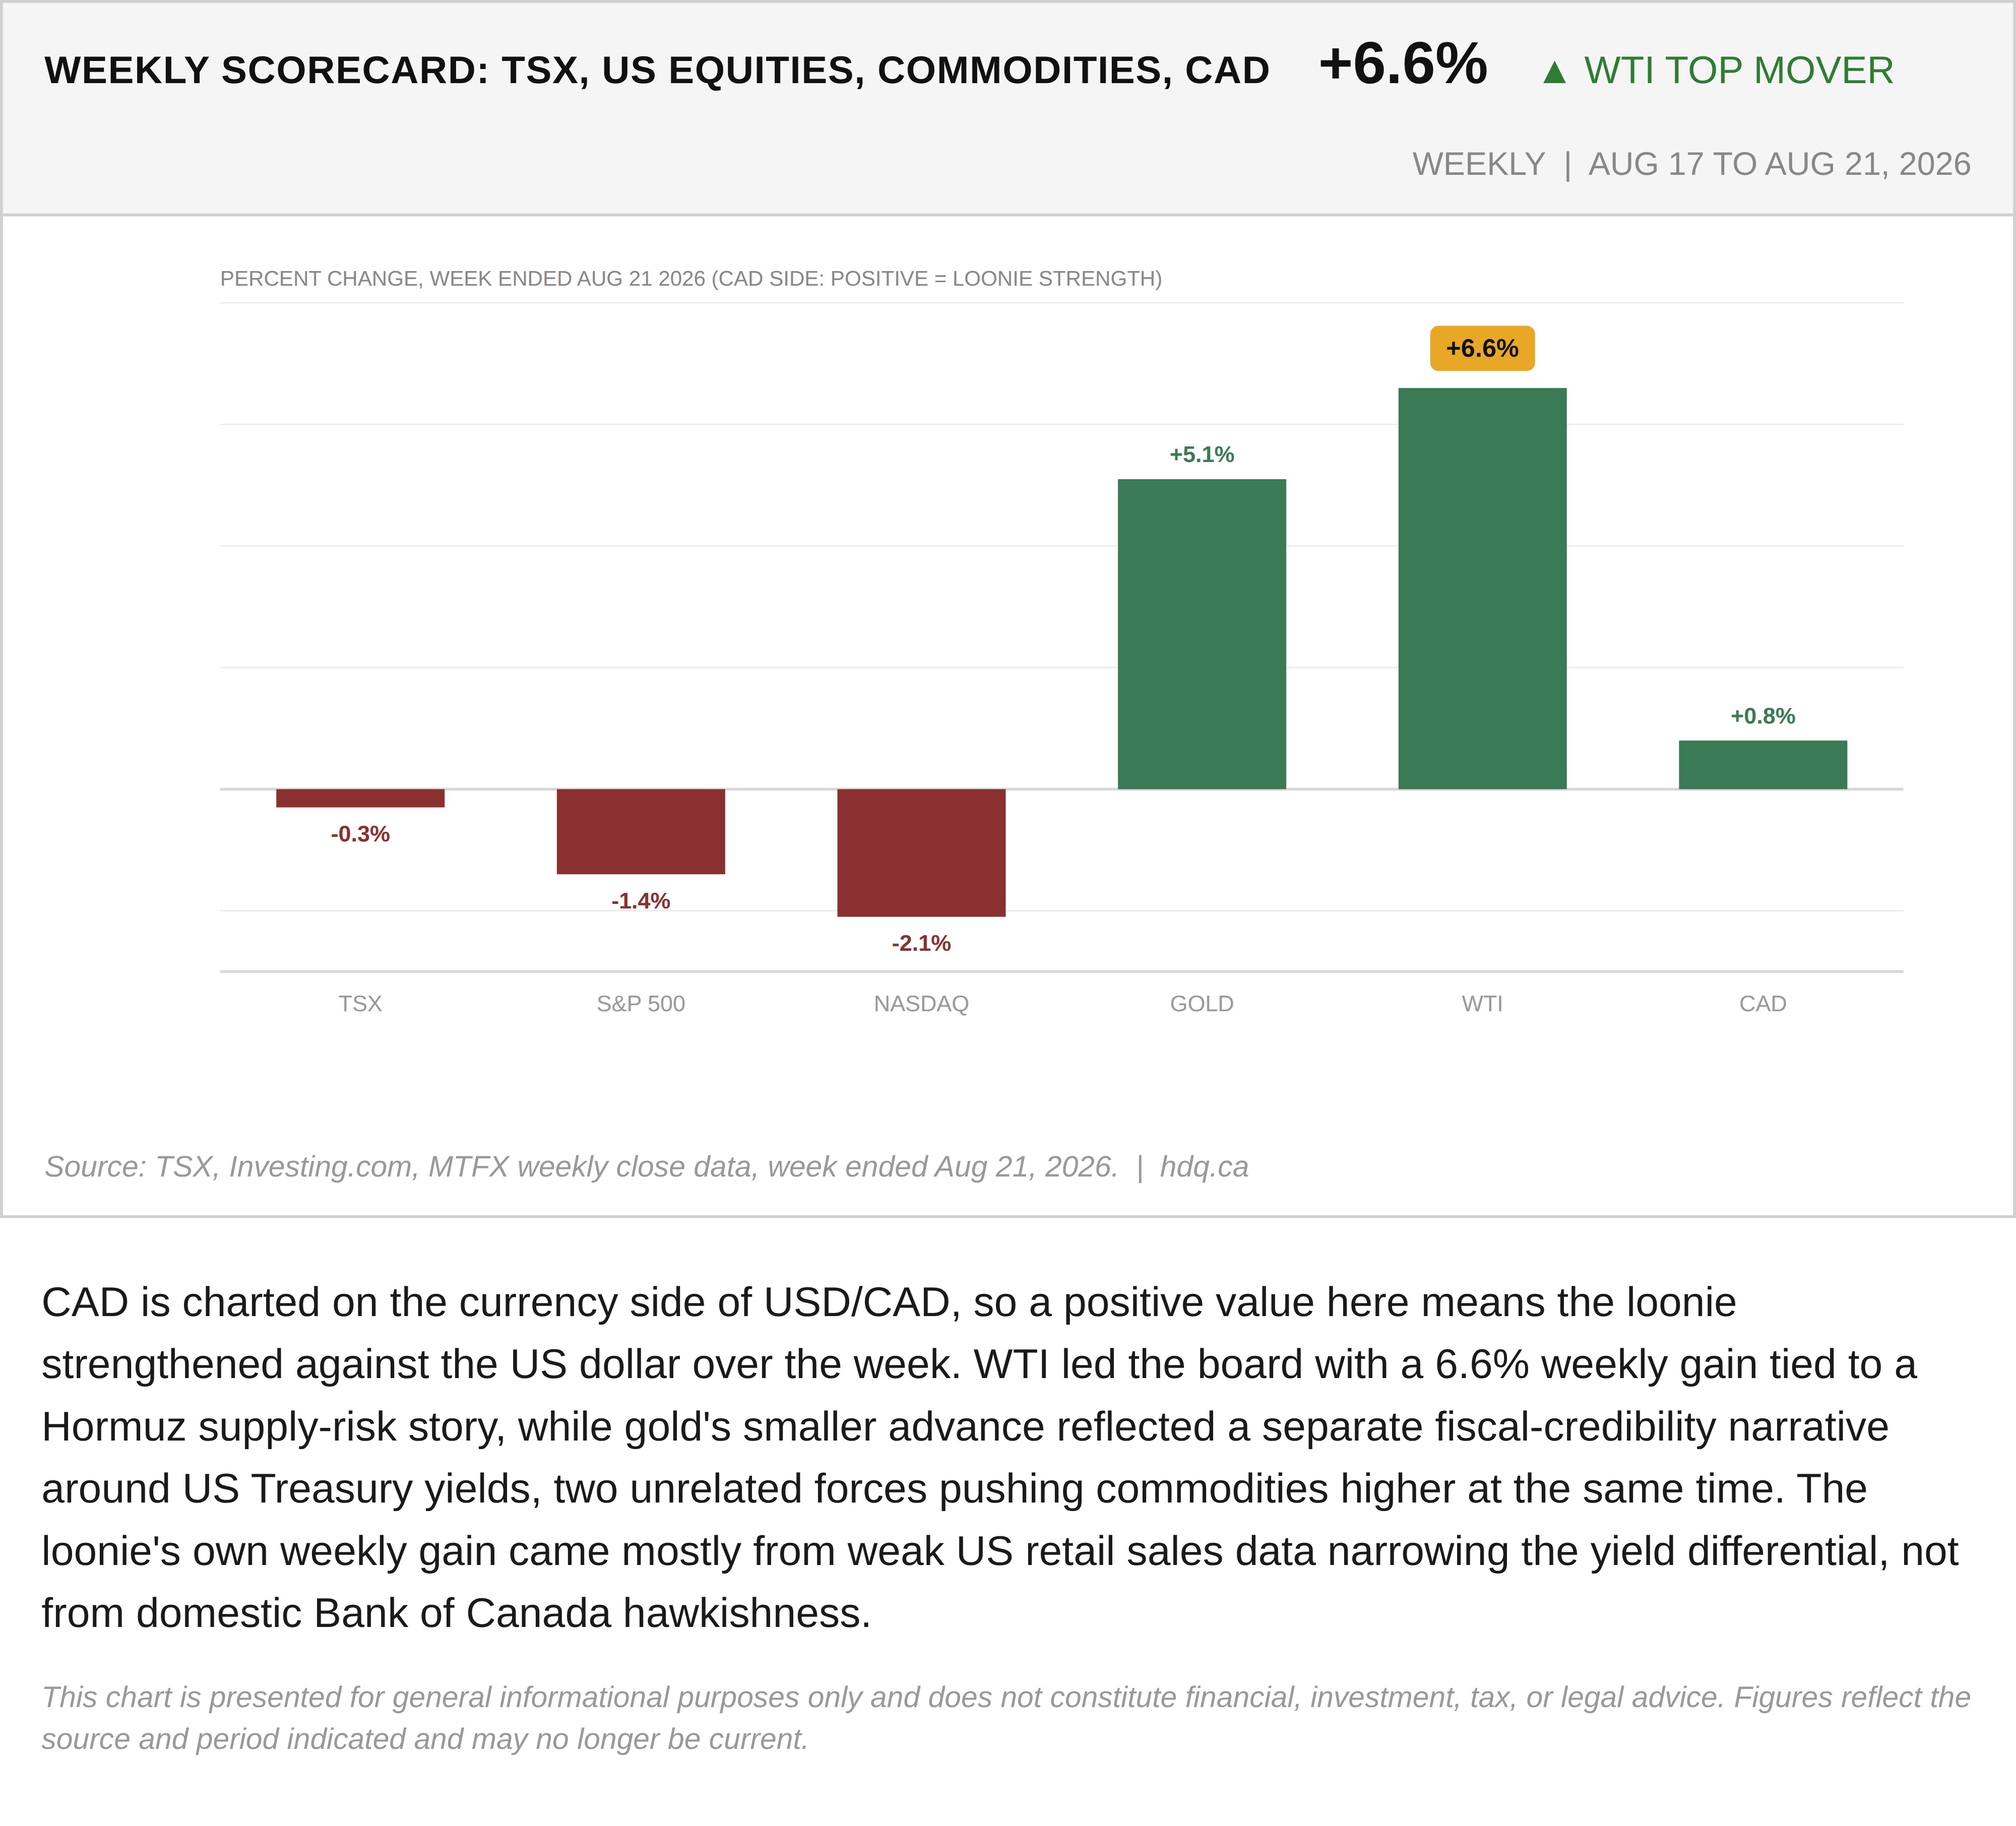
CAD is charted on the currency side of USD/CAD, so a positive value here means the loonie strengthened against the US dollar over the week. WTI led the board with a 6.6% weekly gain tied to a Hormuz supply-risk story, while gold's smaller advance reflected a separate fiscal-credibility narrative around US Treasury yields, two unrelated forces pushing commodities higher at the same time. The loonie's own weekly gain came mostly from weak US retail sales data narrowing the yield differential, not from domestic Bank of Canada hawkishness.
This chart is presented for general informational purposes only and does not constitute financial, investment, tax, or legal advice. Figures reflect the source and period indicated and may no longer be current.
Related charts
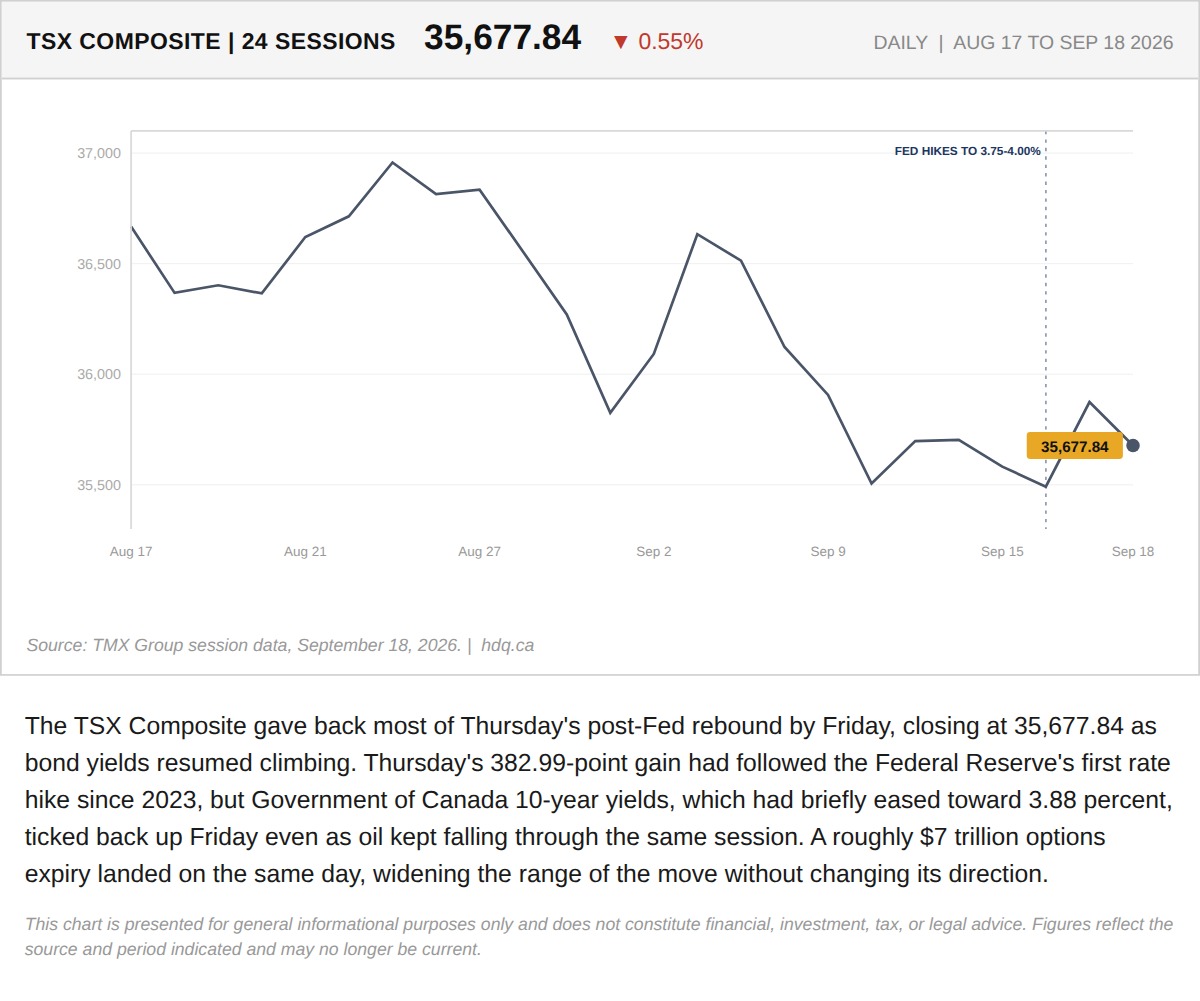
The TSX Composite gave back most of Thursday's post-Fed rebound by Friday, closing at 35,677.84 as bond yields resumed climbing.
TSX Gives Back Post-Fed Rally as Bond Yields Resume Climbing
September 18, 2026
View chart & download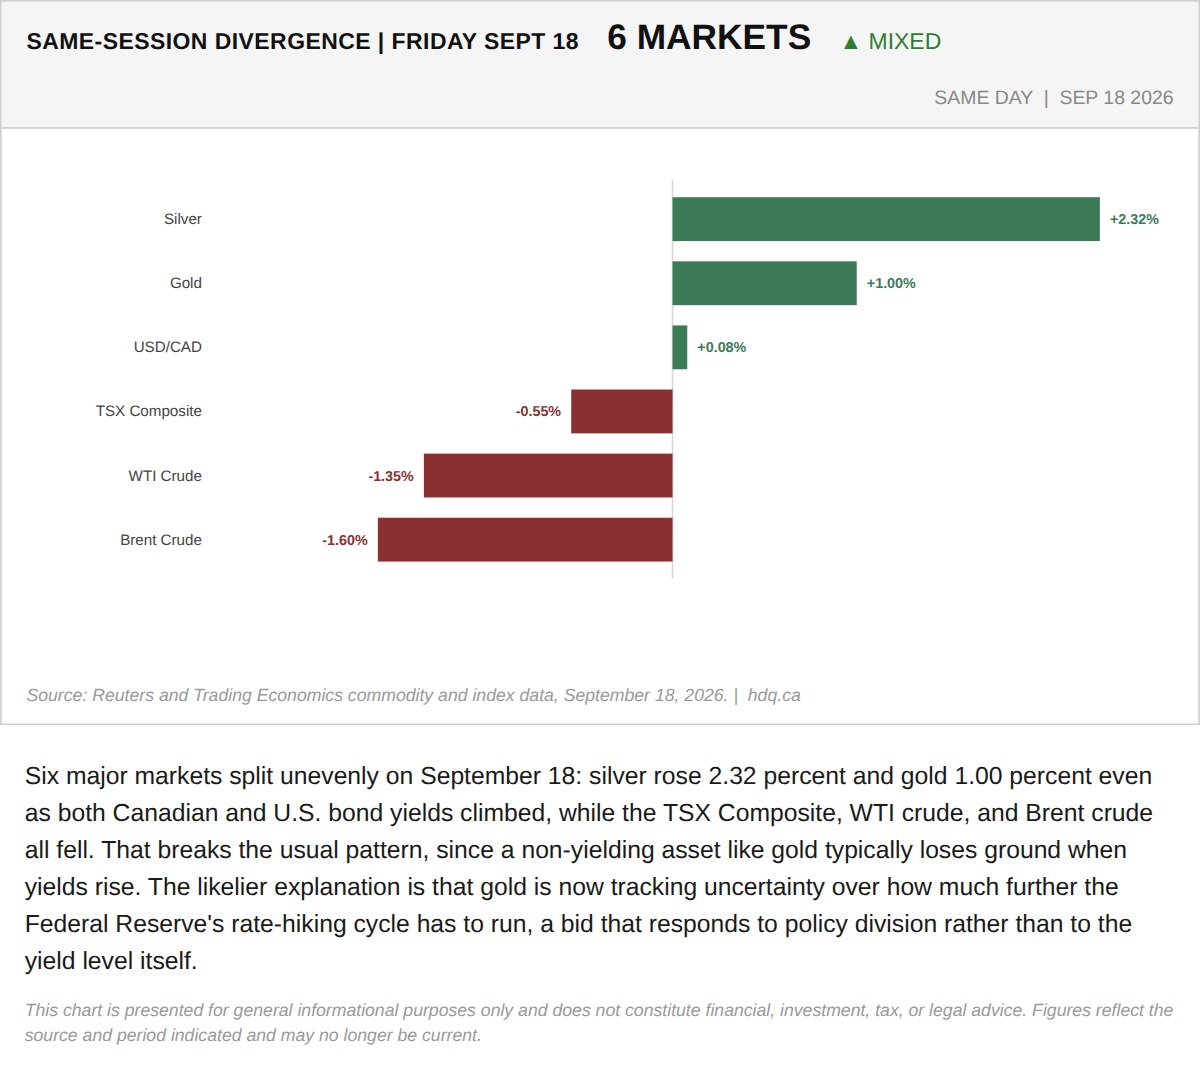
Six major markets split unevenly on September 18: silver rose 2.32 percent and gold 1.00 percent even as both Canadian and U.S.
Gold and Silver Rise With Yields, Breaking the Usual Pattern
September 18, 2026
View chart & download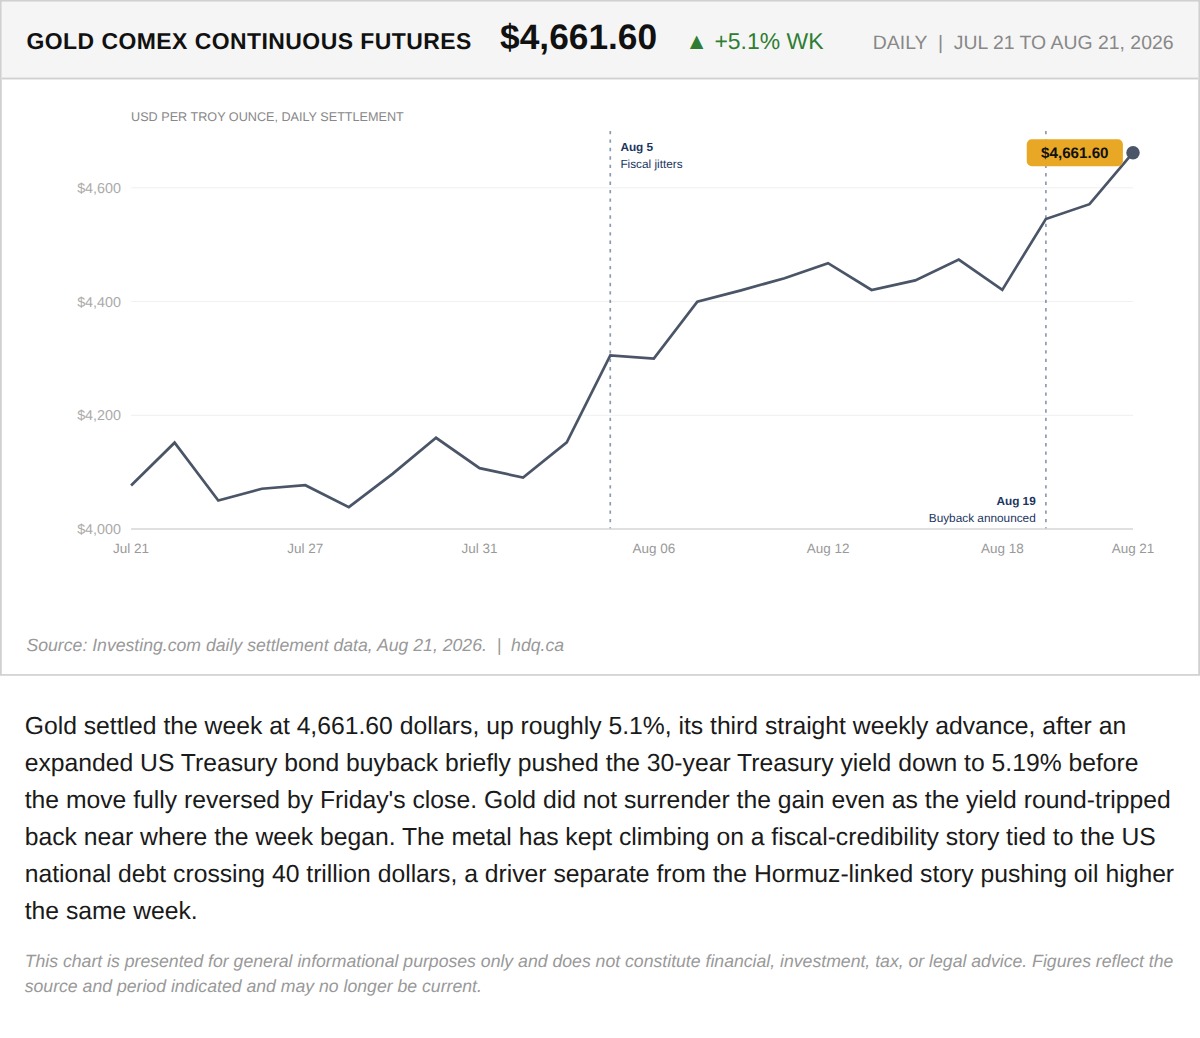
Gold settled the week at 4,661.60 dollars, up roughly 5.1%, its third straight weekly advance, after an expanded US Treasury bond buyback…
Gold Kept Its Gain After the Treasury Buyback That Triggered It Reversed
August 22, 2026
View chart & download
Brent was the only one of the three to finish above its starting level, while the index and gold both fell.
Brent, TSX and Gold Rebased to the August 31 Close
September 30, 2026
View chart & download
The Bank of Canada held its policy rate at 2.25% for a seventh straight time, yet Canadian yields rose as United States yields surged.
Government of Canada Benchmark Yields, September 2026
September 30, 2026
View chart & download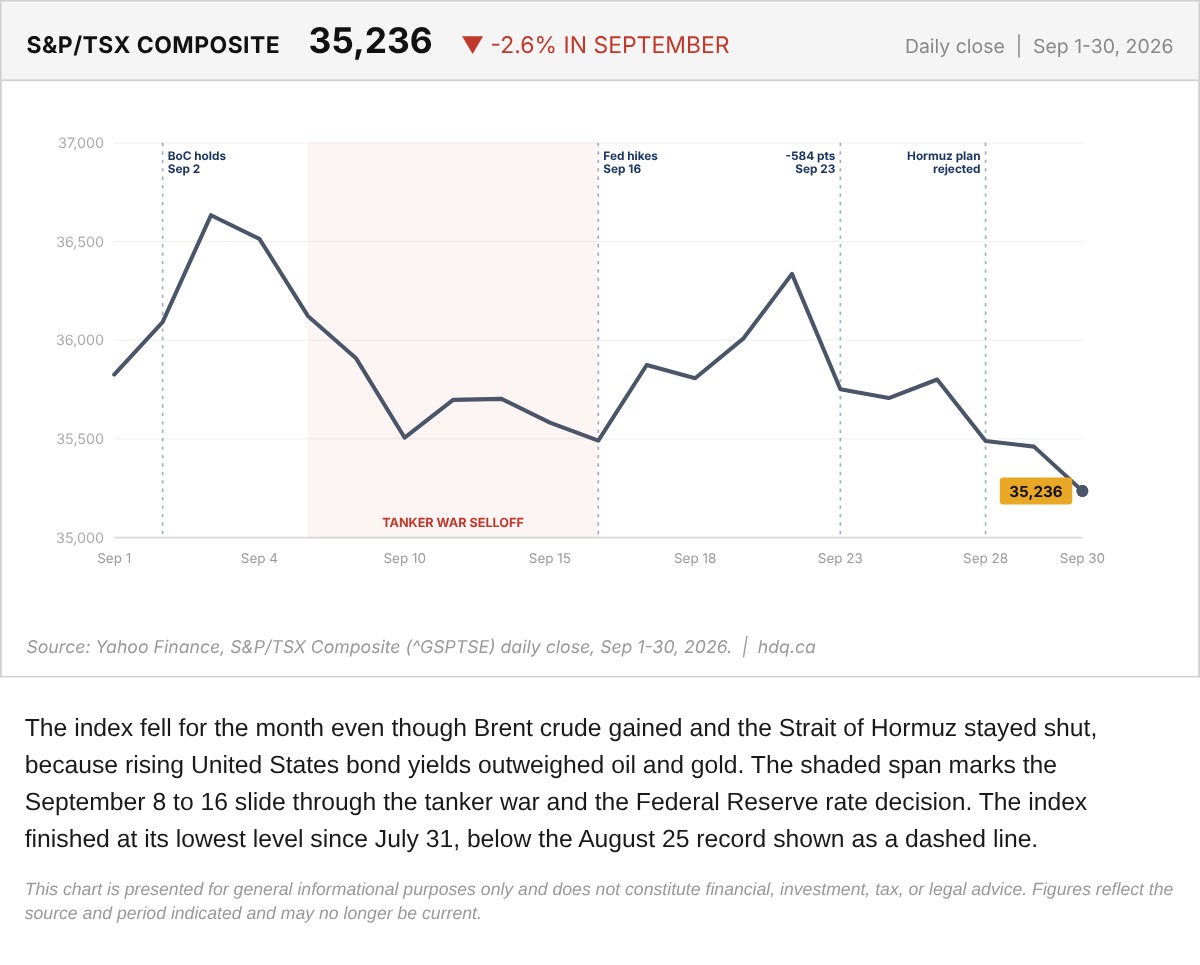
The index fell for the month even though Brent crude gained and the Strait of Hormuz stayed shut, because rising United States bond yields outweighed oil and gold.
S&P/TSX Composite Daily Close Through September 2026
September 30, 2026
View chart & download