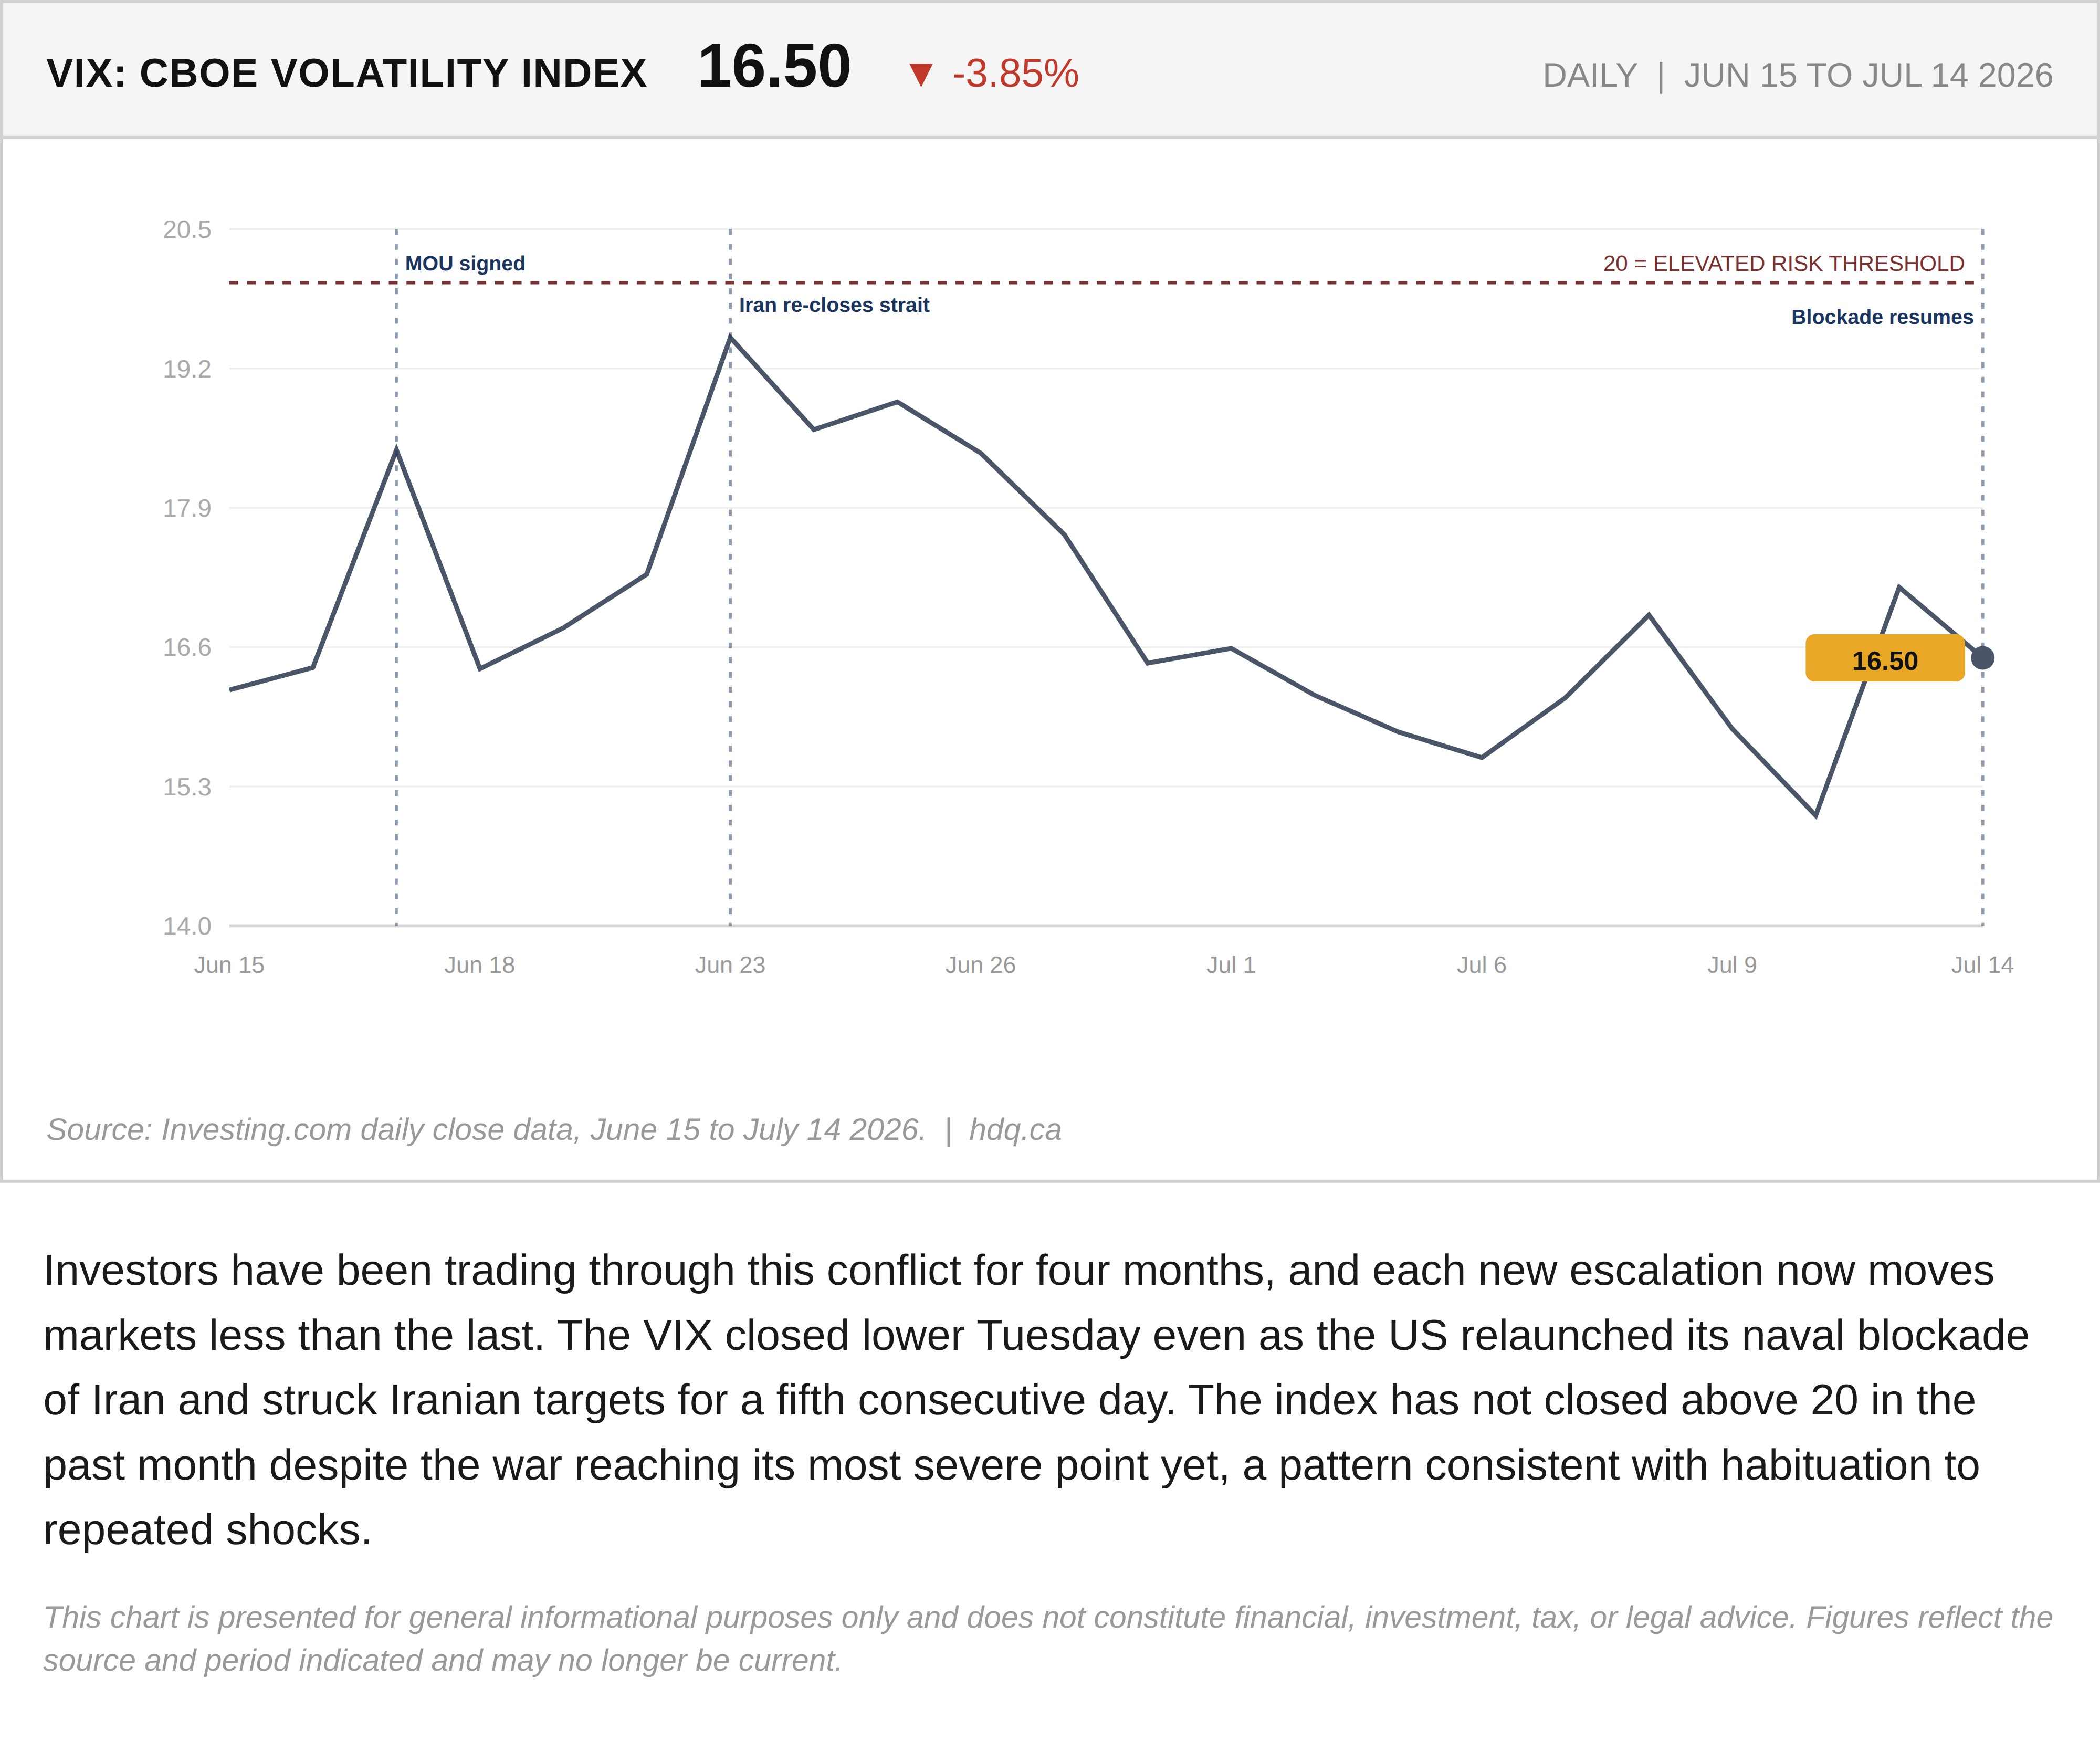
Investors have been trading through this conflict for four months, and each new escalation now moves markets less than the last. The VIX closed lower Tuesday even as the US relaunched its naval blockade of Iran and struck Iranian targets for a fifth consecutive day. The index has not closed above 20 in the past month despite the war reaching its most severe point yet, a pattern consistent with habituation to repeated shocks.
This chart is presented for general informational purposes only and does not constitute financial, investment, tax, or legal advice. Figures reflect the source and period indicated and may no longer be current.

Related charts
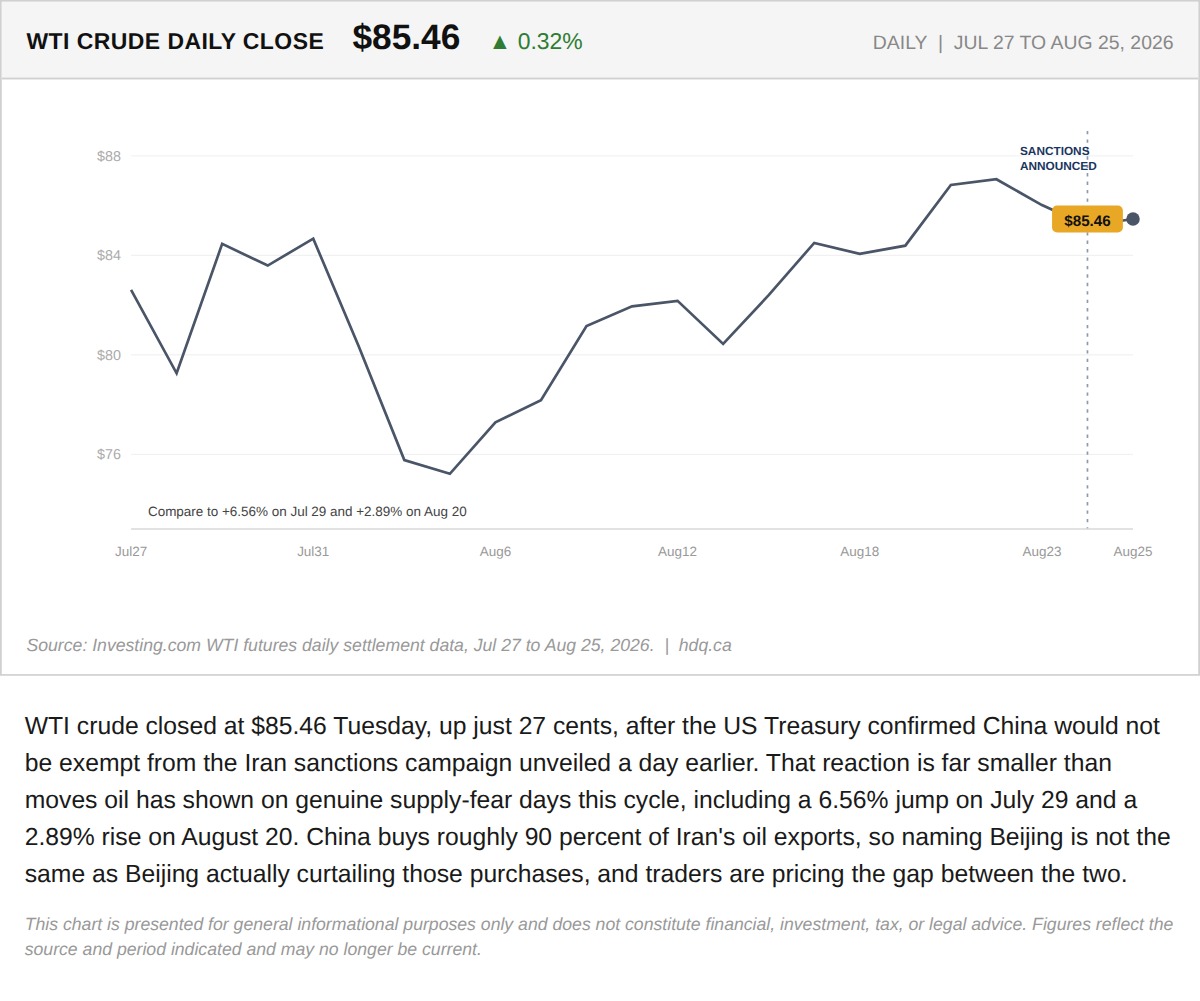
WTI crude closed at $85.46 Tuesday, up just 27 cents, after the US Treasury confirmed China would not be exempt from the Iran sanctions campaign unveiled a day earlier.
WTI Barely Moves After China Loses Its Iran Sanctions Exemption
August 25, 2026
View chart & download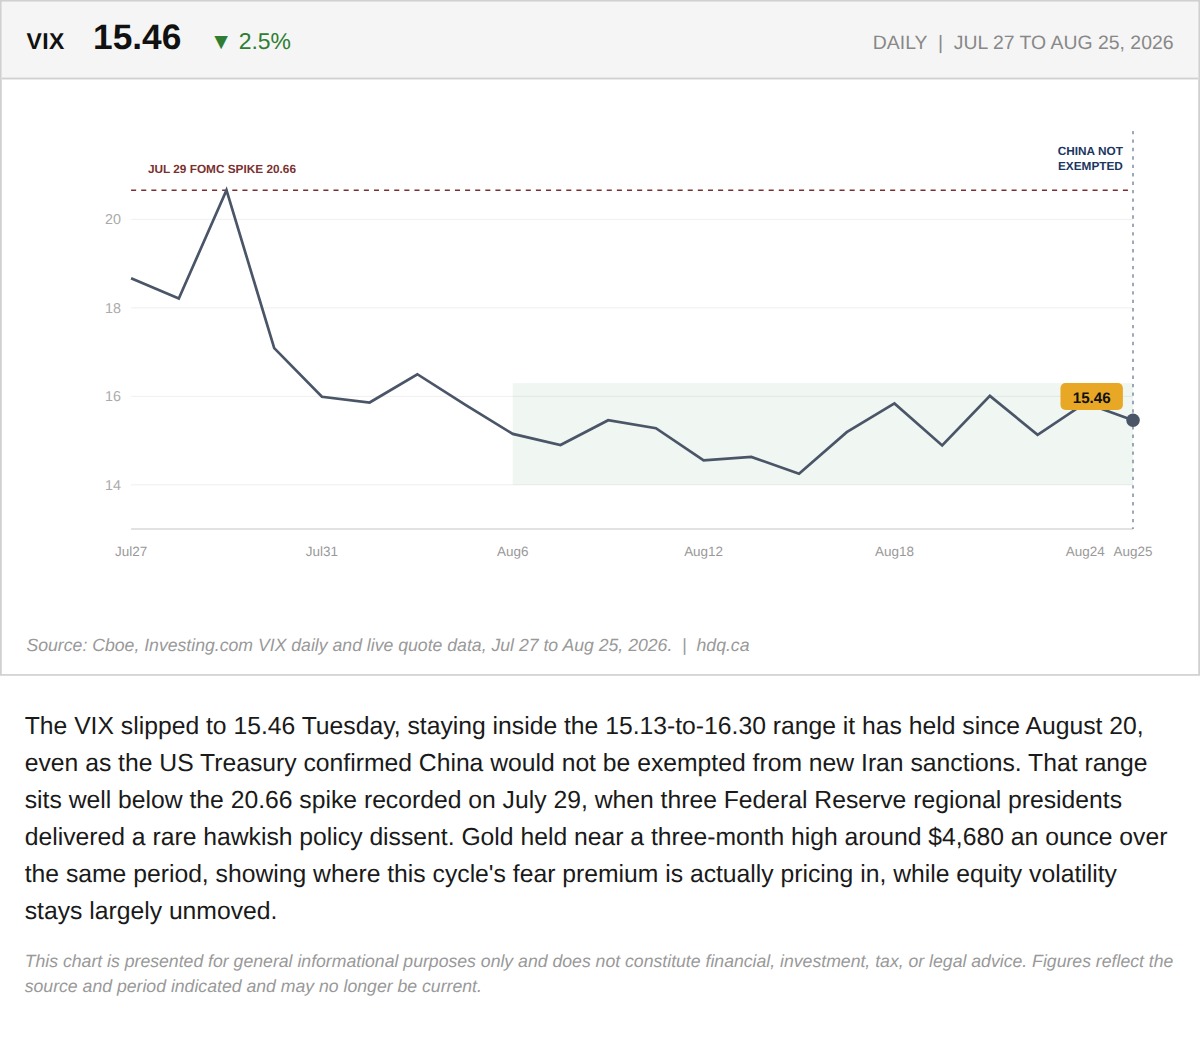
The VIX slipped to 15.46 Tuesday, staying inside the 15.13-to-16.30 range it has held since August 20, even as the US Treasury confirmed…
VIX Holds Below 16.3 Even as China's Iran Exemption Ends
August 25, 2026
View chart & download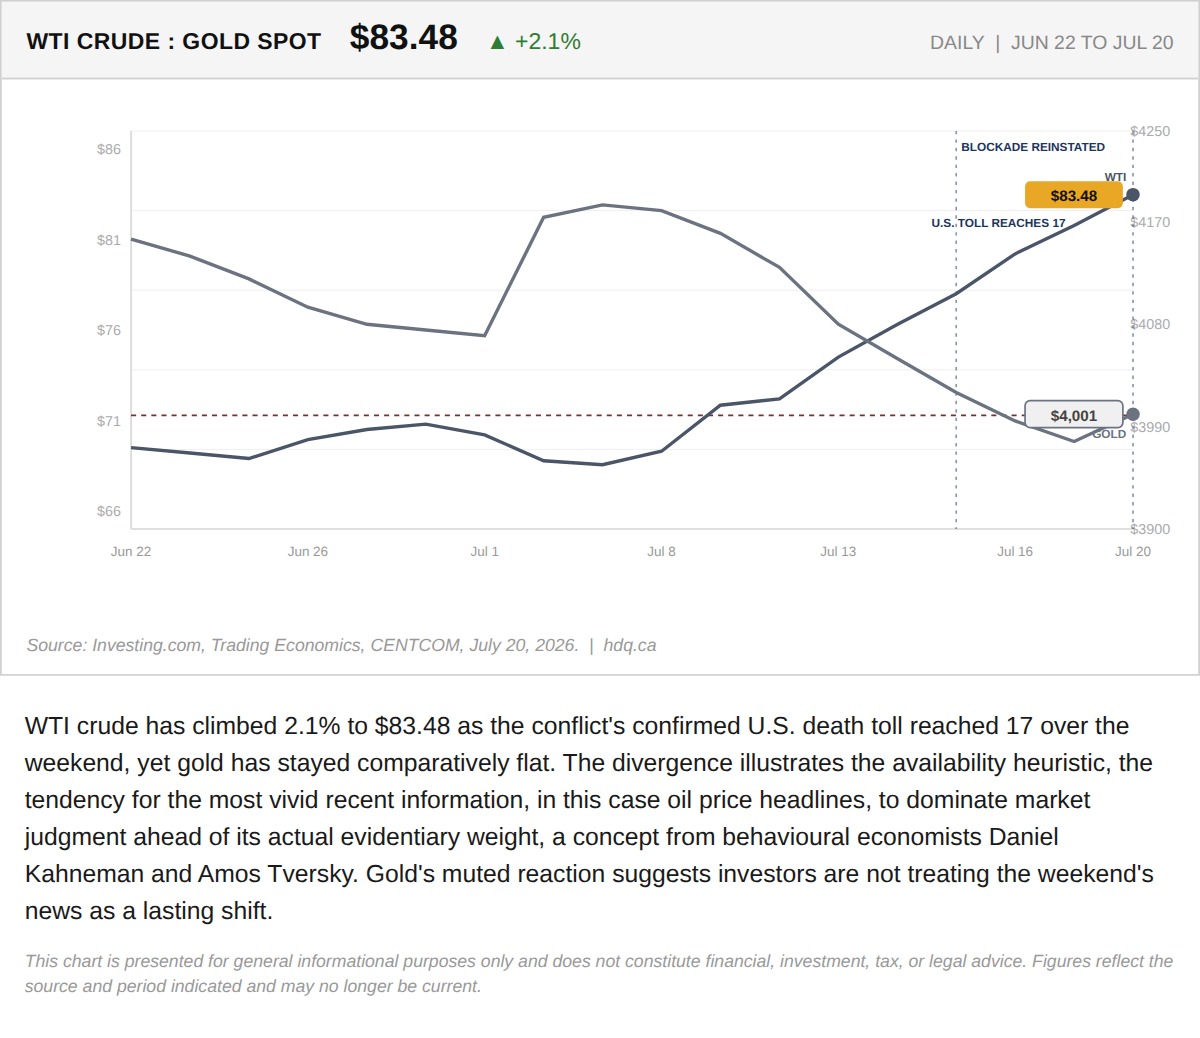
WTI crude has climbed 2.1% to $83.48 as the conflict's confirmed U.S.
Oil Spiked Past $85 as the War's U.S. Death Toll Hit 17. It Gave Back Most of the Move by Noon.
July 20, 2026
View chart & download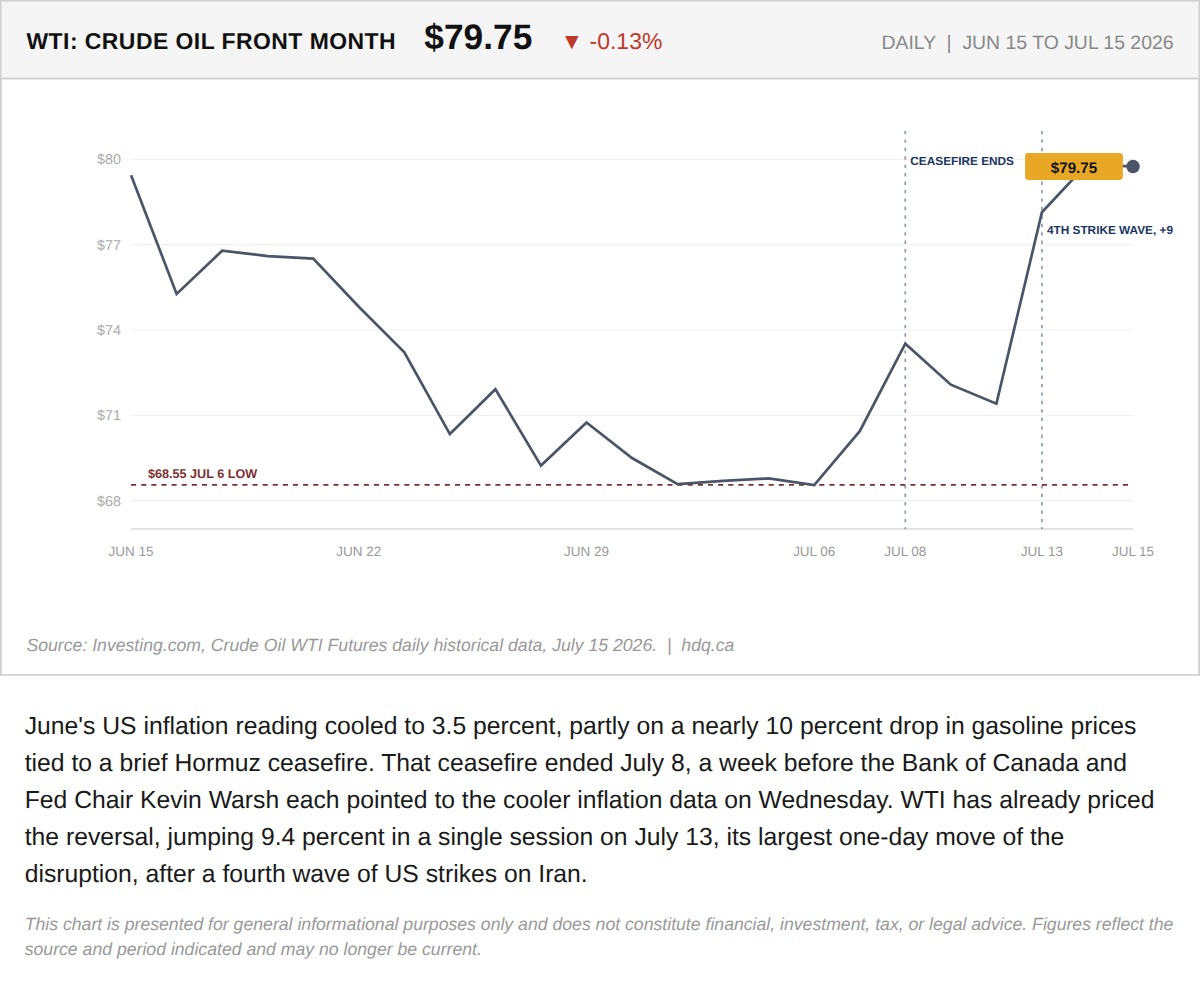
June's US inflation reading cooled to 3.5 percent, partly on a nearly 10 percent drop in gasoline prices tied to a brief Hormuz ceasefire.
Warsh and the Bank of Canada Both Cited a CPI Print Built on a Ceasefire That Had Already Ended
July 15, 2026
View chart & download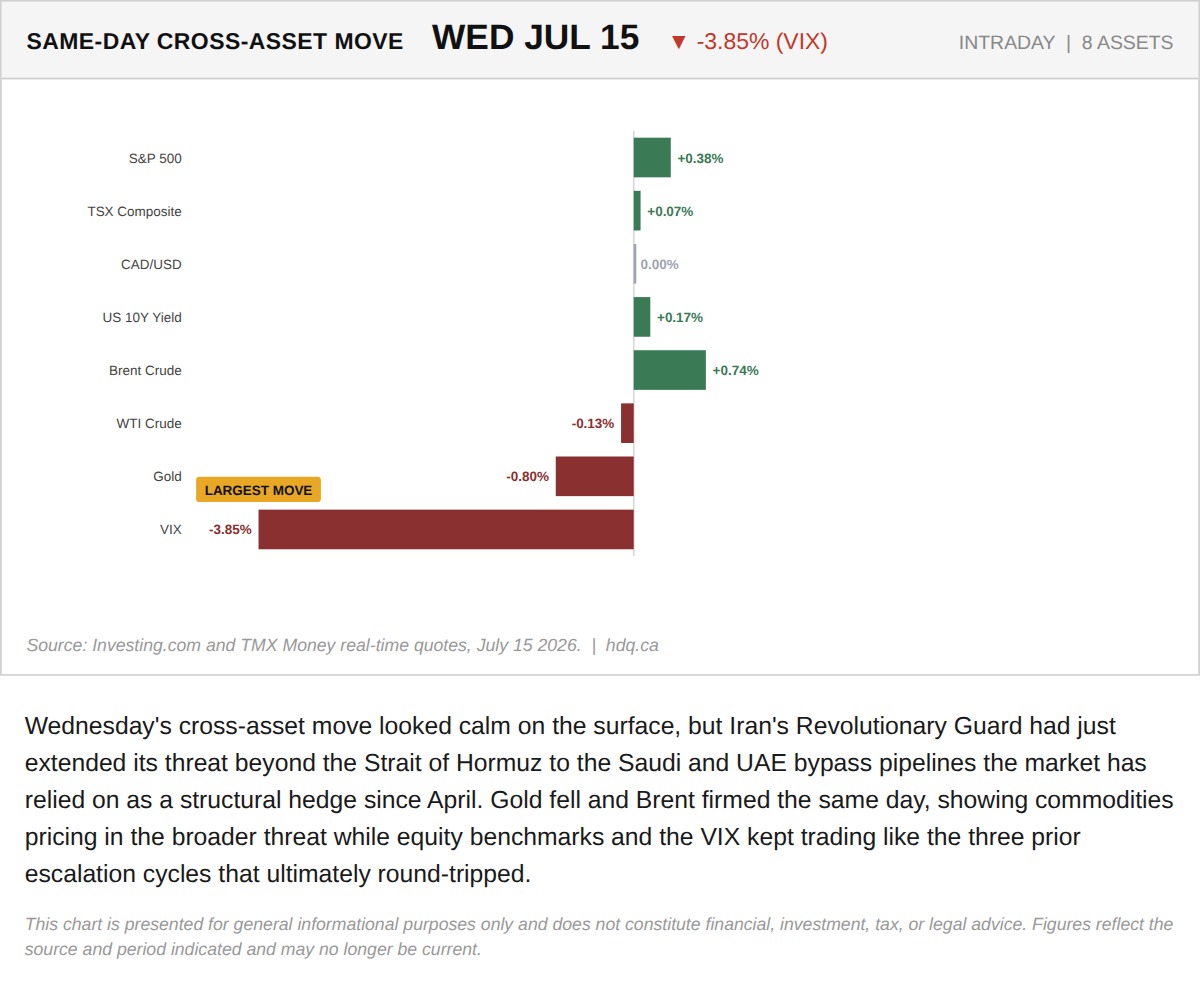
Wednesday's cross-asset move looked calm on the surface, but Iran's Revolutionary Guard had just extended its threat beyond the Strait of…
Warsh and the Bank of Canada Both Cited a CPI Print Built on a Ceasefire That Had Already Ended
July 15, 2026
View chart & download
Brent was the only one of the three to finish above its starting level, while the index and gold both fell.
Brent, TSX and Gold Rebased to the August 31 Close
September 30, 2026
View chart & download