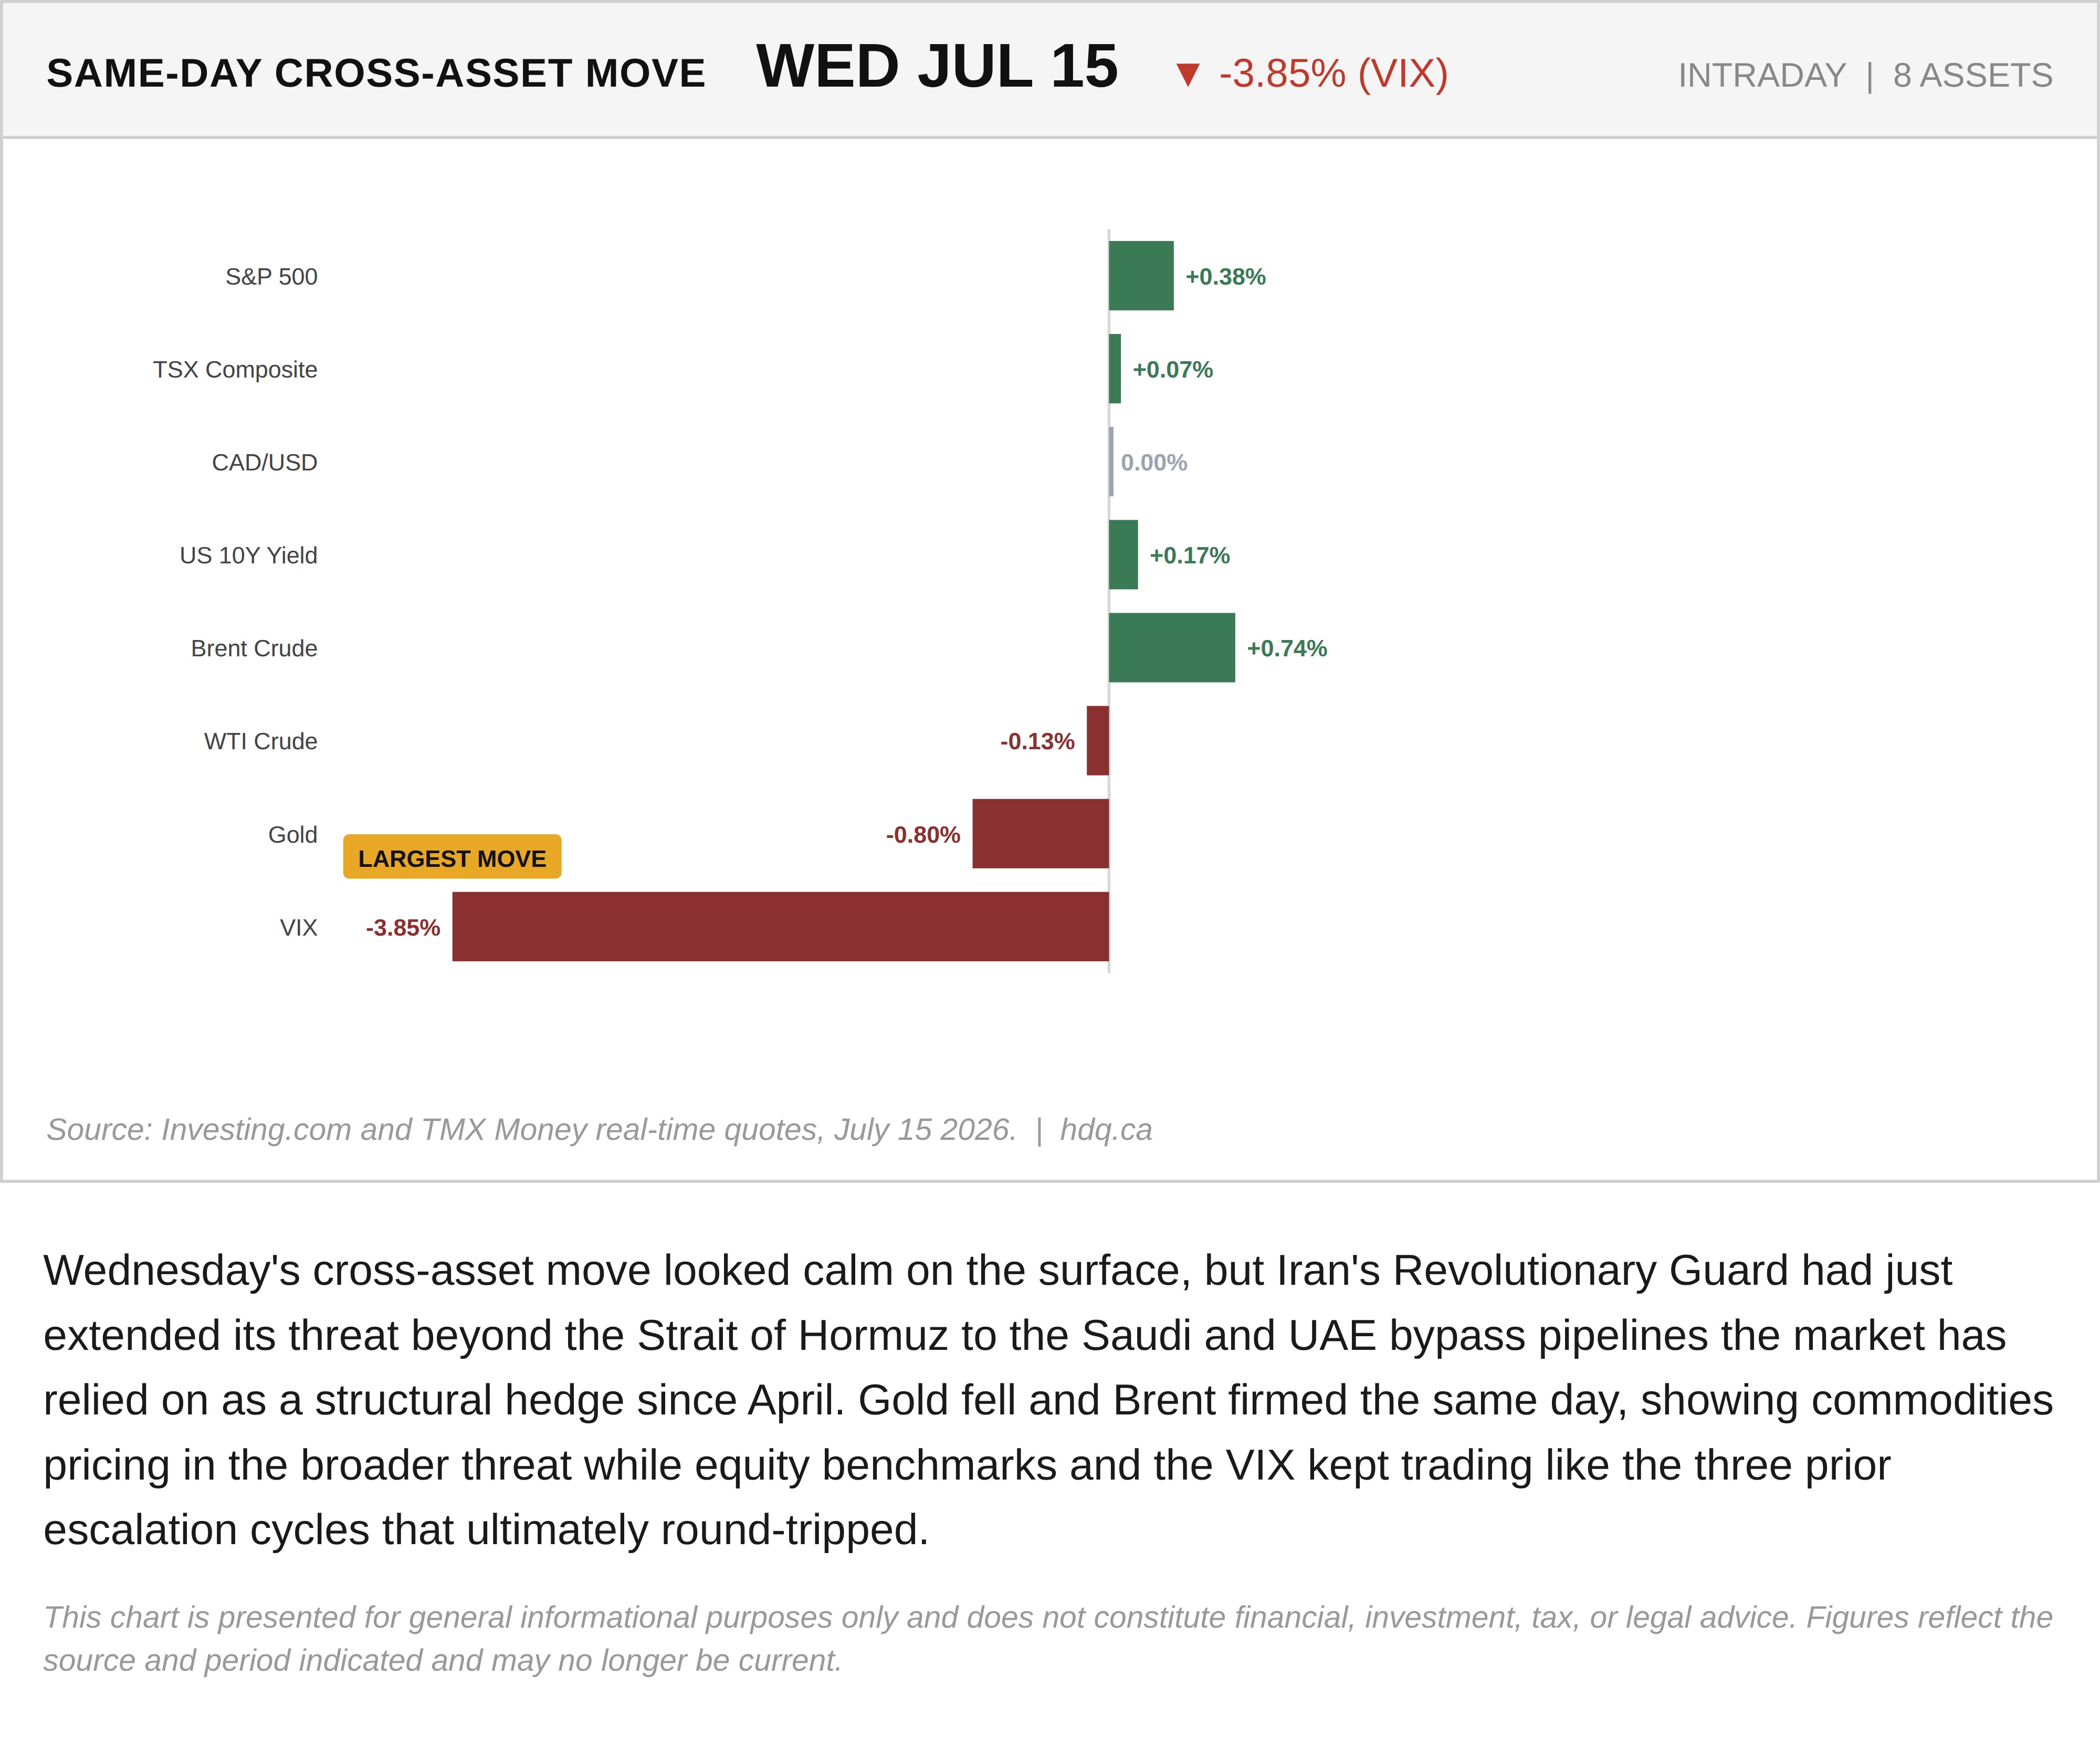
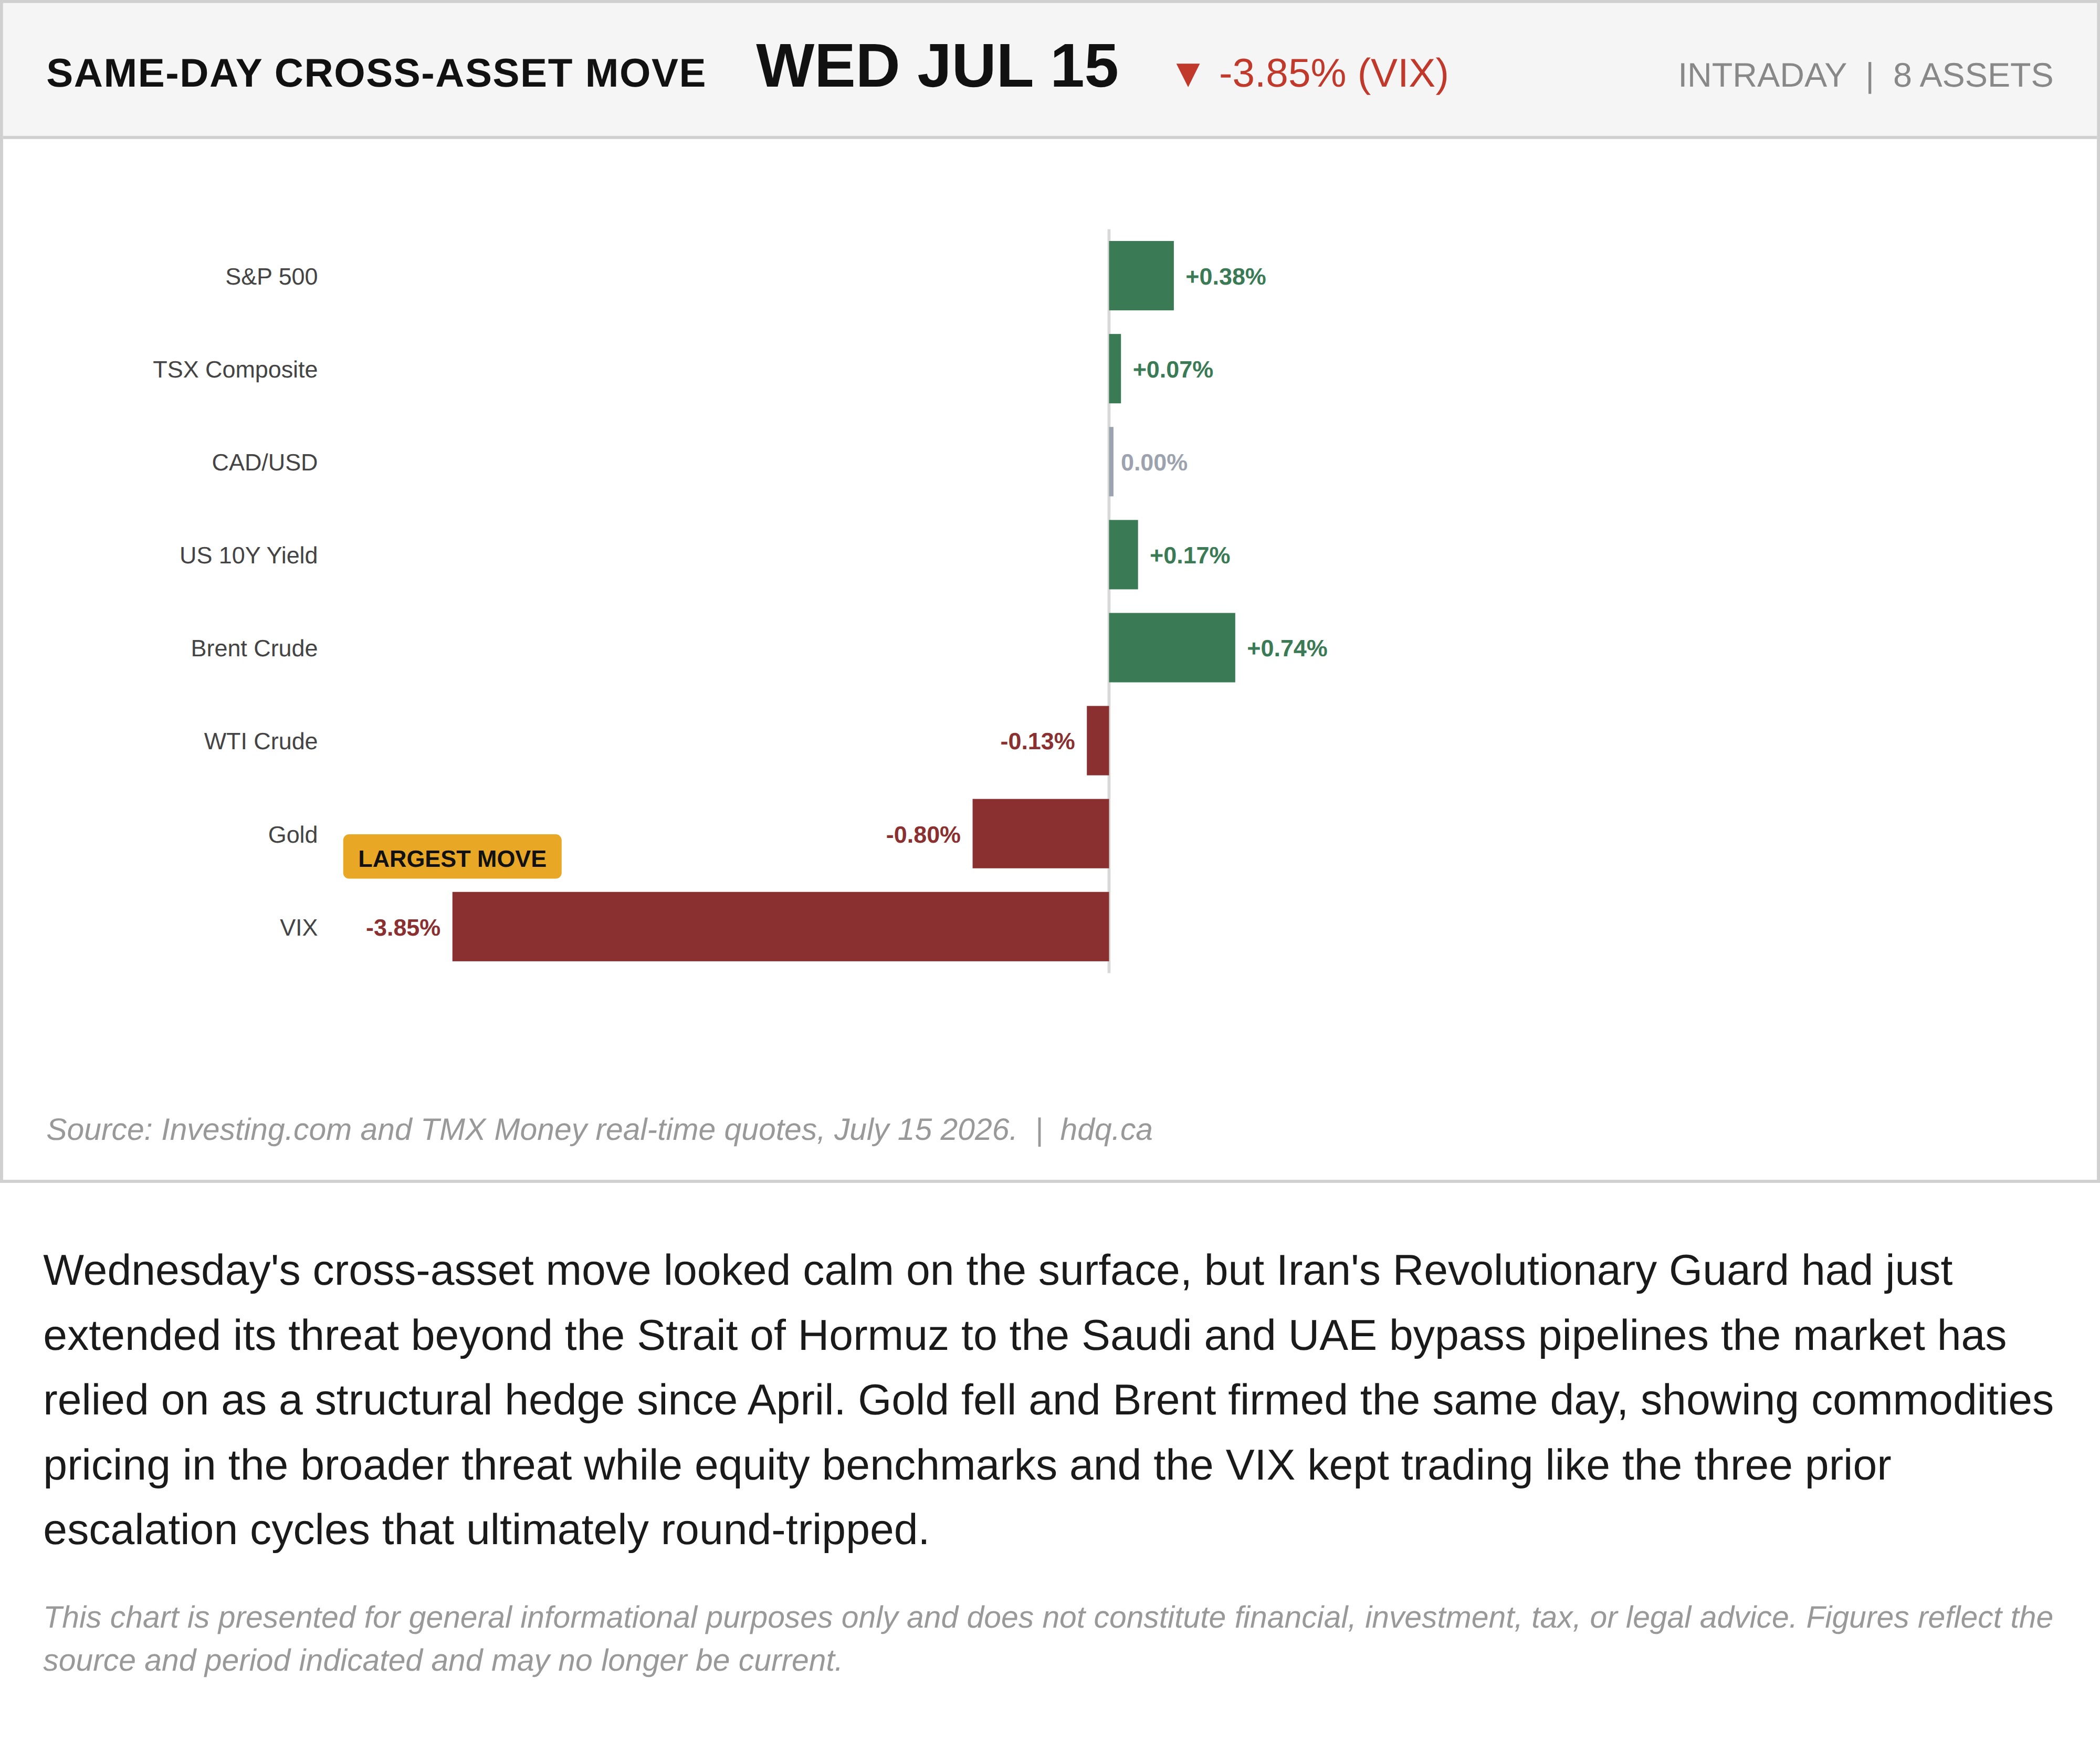
Wednesday's cross-asset move looked calm on the surface, but Iran's Revolutionary Guard had just extended its threat beyond the Strait of Hormuz to the Saudi and UAE bypass pipelines the market has relied on as a structural hedge since April. Gold fell and Brent firmed the same day, showing commodities pricing in the broader threat while equity benchmarks and the VIX kept trading like the three prior escalation cycles that ultimately round-tripped.
This chart is presented for general informational purposes only and does not constitute financial, investment, tax, or legal advice. Figures reflect the source and period indicated and may no longer be current.
Related charts
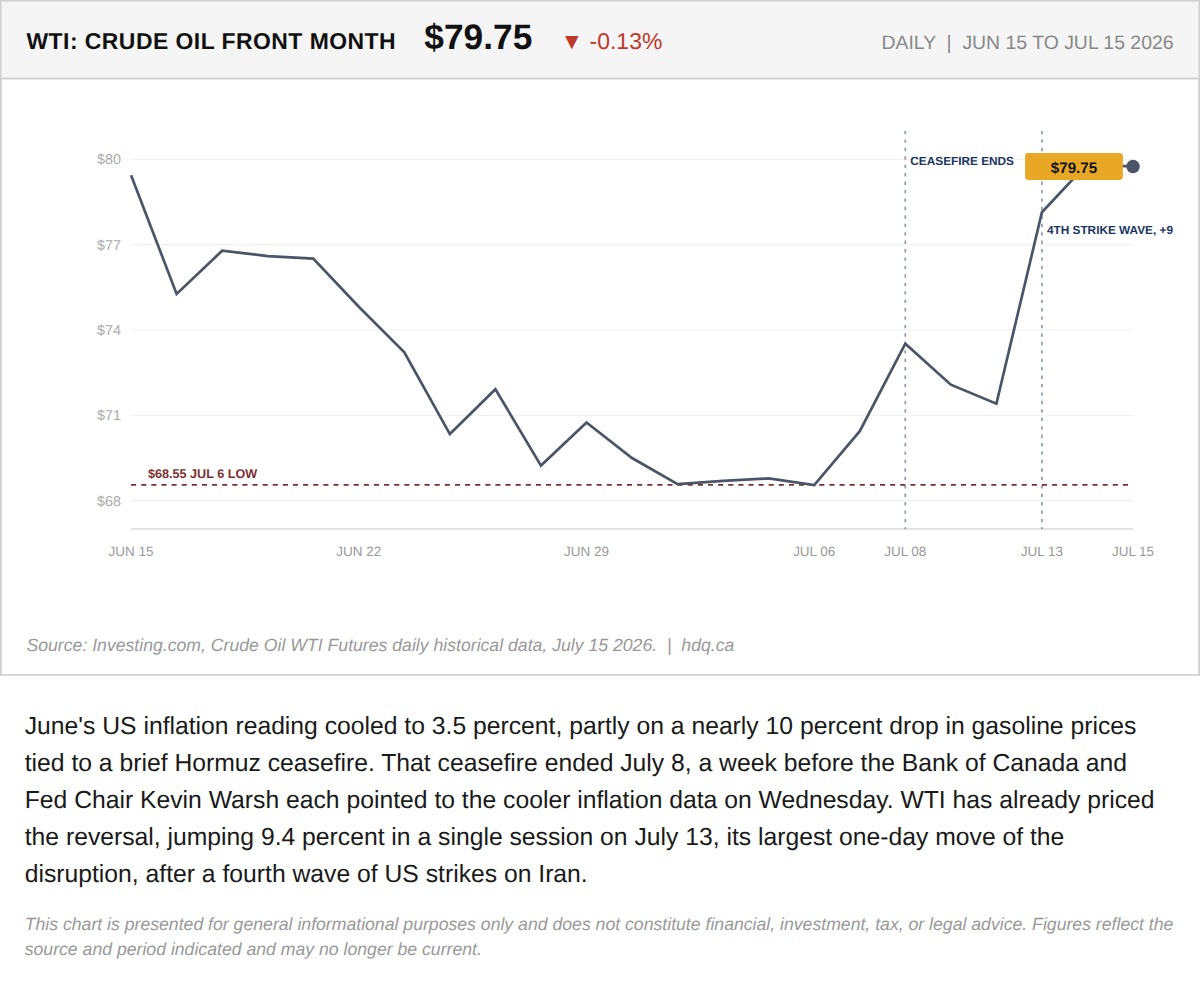
June's US inflation reading cooled to 3.5 percent, partly on a nearly 10 percent drop in gasoline prices tied to a brief Hormuz ceasefire.
Warsh and the Bank of Canada Both Cited a CPI Print Built on a Ceasefire That Had Already Ended
July 15, 2026
View chart & download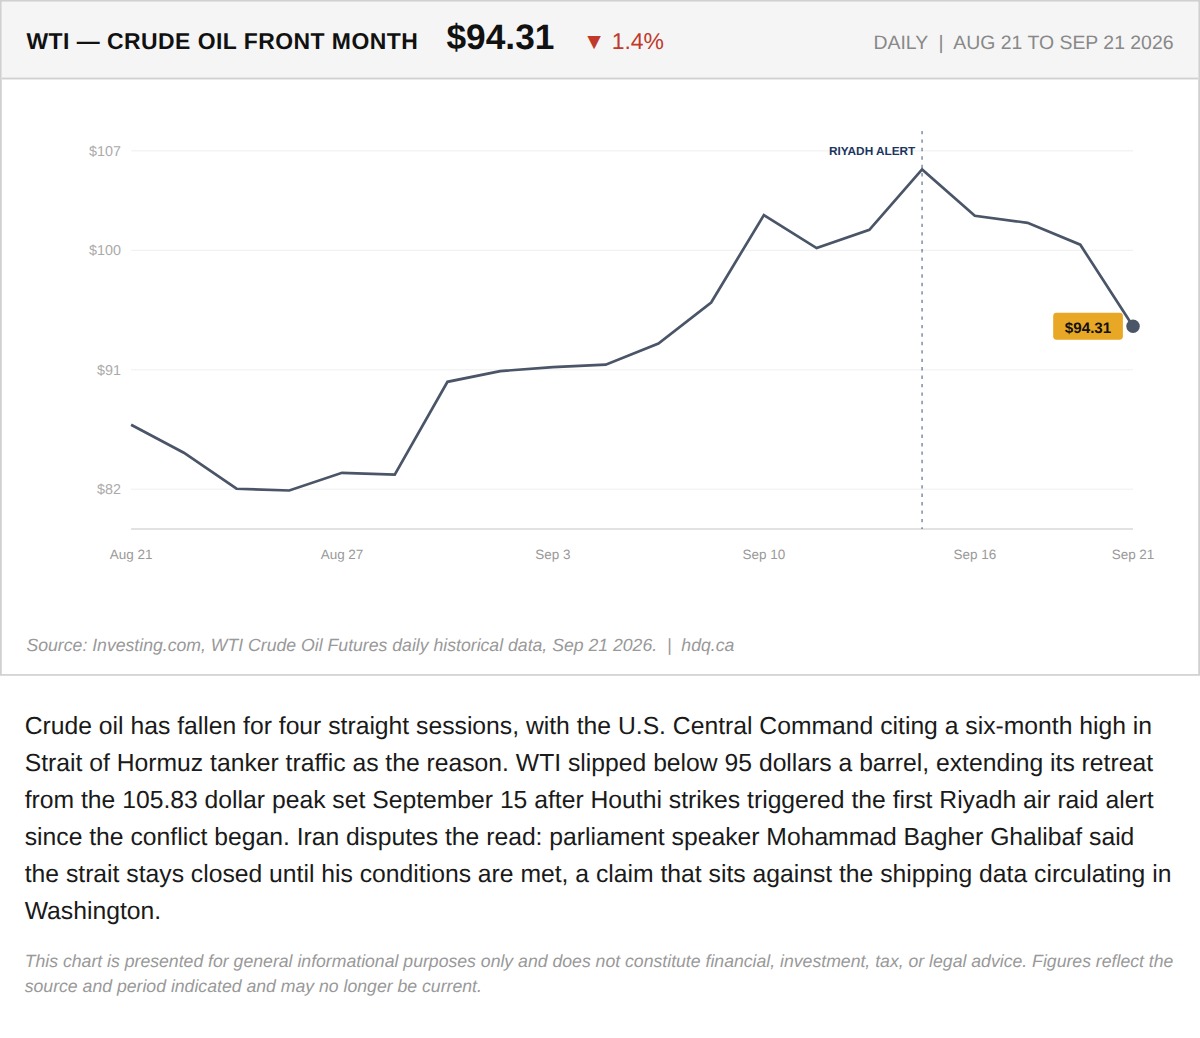
Crude oil has fallen for four straight sessions, with the U.S.
Oil Falls for a Fourth Session as Hormuz Shipping Data Is Disputed
September 21, 2026
View chart & download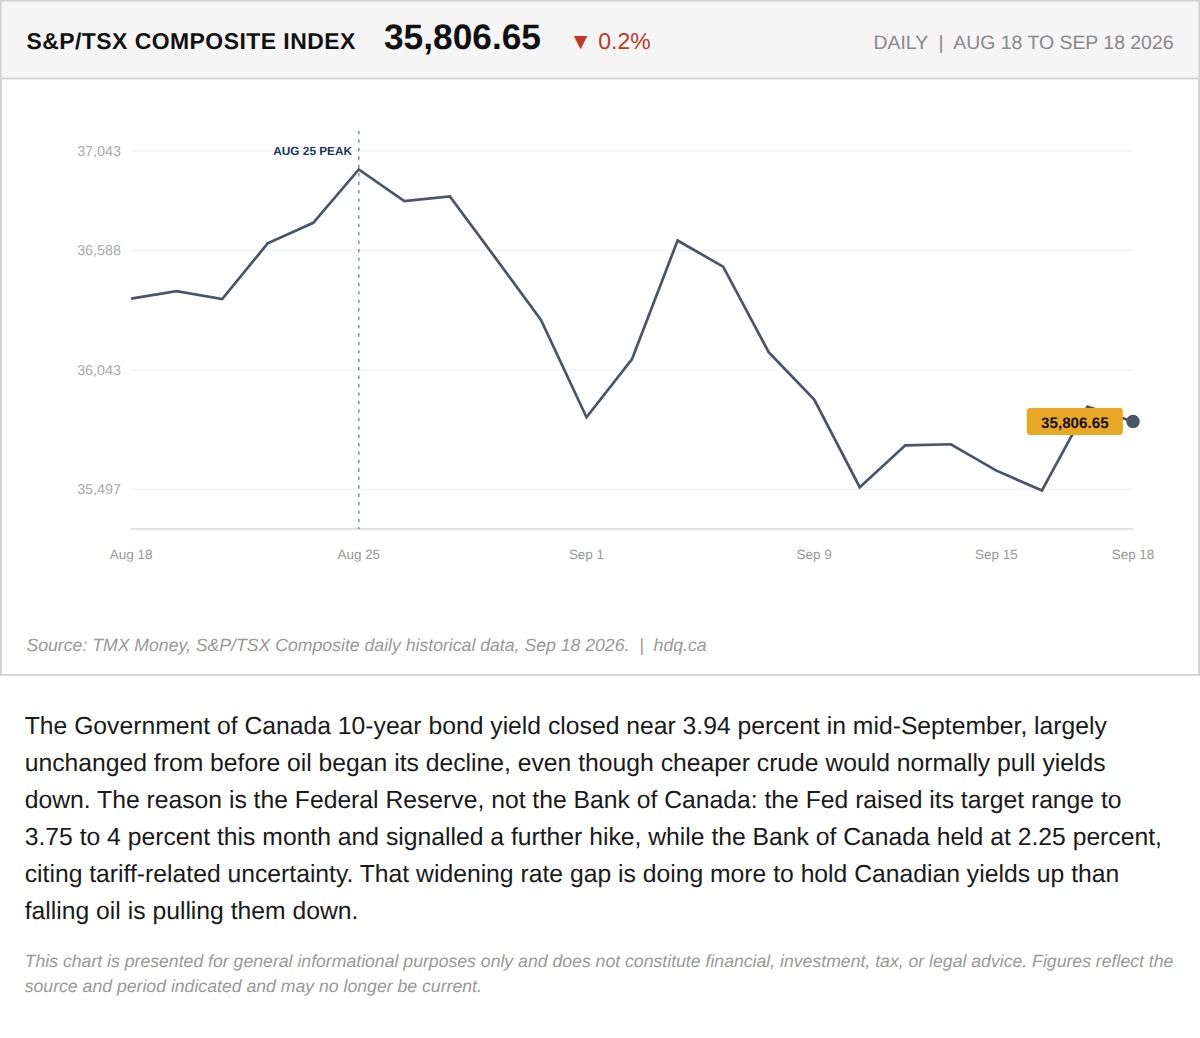
The Government of Canada 10-year bond yield closed near 3.94 percent in mid-September, largely unchanged from before oil began its decline,…
TSX Slides as Canadian Bond Yields Stay Elevated Despite Falling Oil
September 21, 2026
View chart & download
The S&P/TSX Composite closed July at 35,226, up 1.06% for the month, a modest headline figure that conceals sharp intra-month swings.
S&P/TSX Composite closes July up 1.06% after a volatile month
July 31, 2026
View chart & download
Brent and WTI crude both surged in July, with WTI ending the month at $85.47, up 23.0%, after round-tripping from a five-month low near $68.74.
WTI and Brent crude surge in July as the Iran ceasefire collapses
July 31, 2026
View chart & download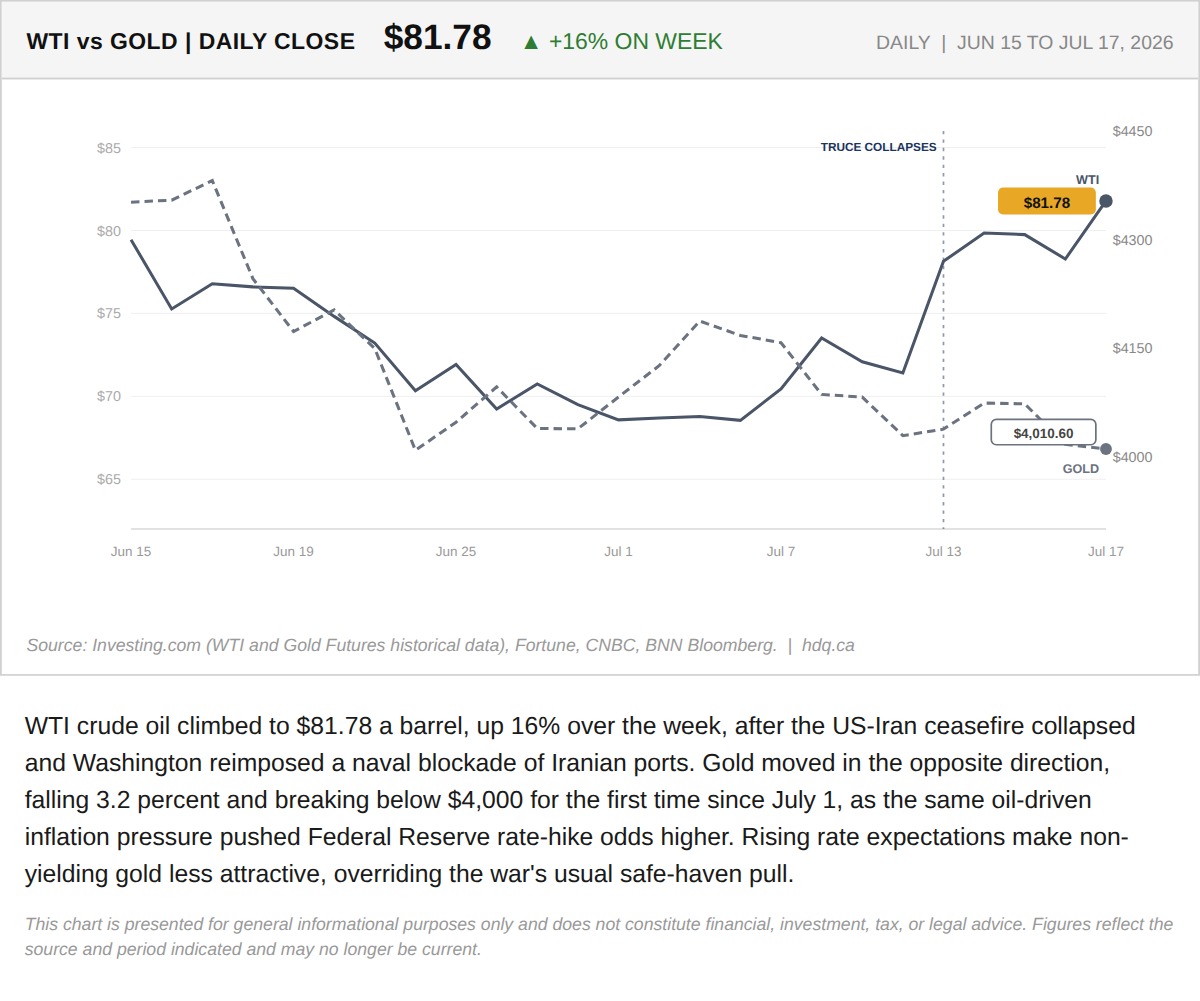
WTI crude oil climbed to $81.78 a barrel, up 16% over the week, after the US-Iran ceasefire collapsed and Washington reimposed a naval blockade of Iranian ports.
WTI crude oil and gold prices diverge after Iran truce collapse
July 18, 2026
View chart & download