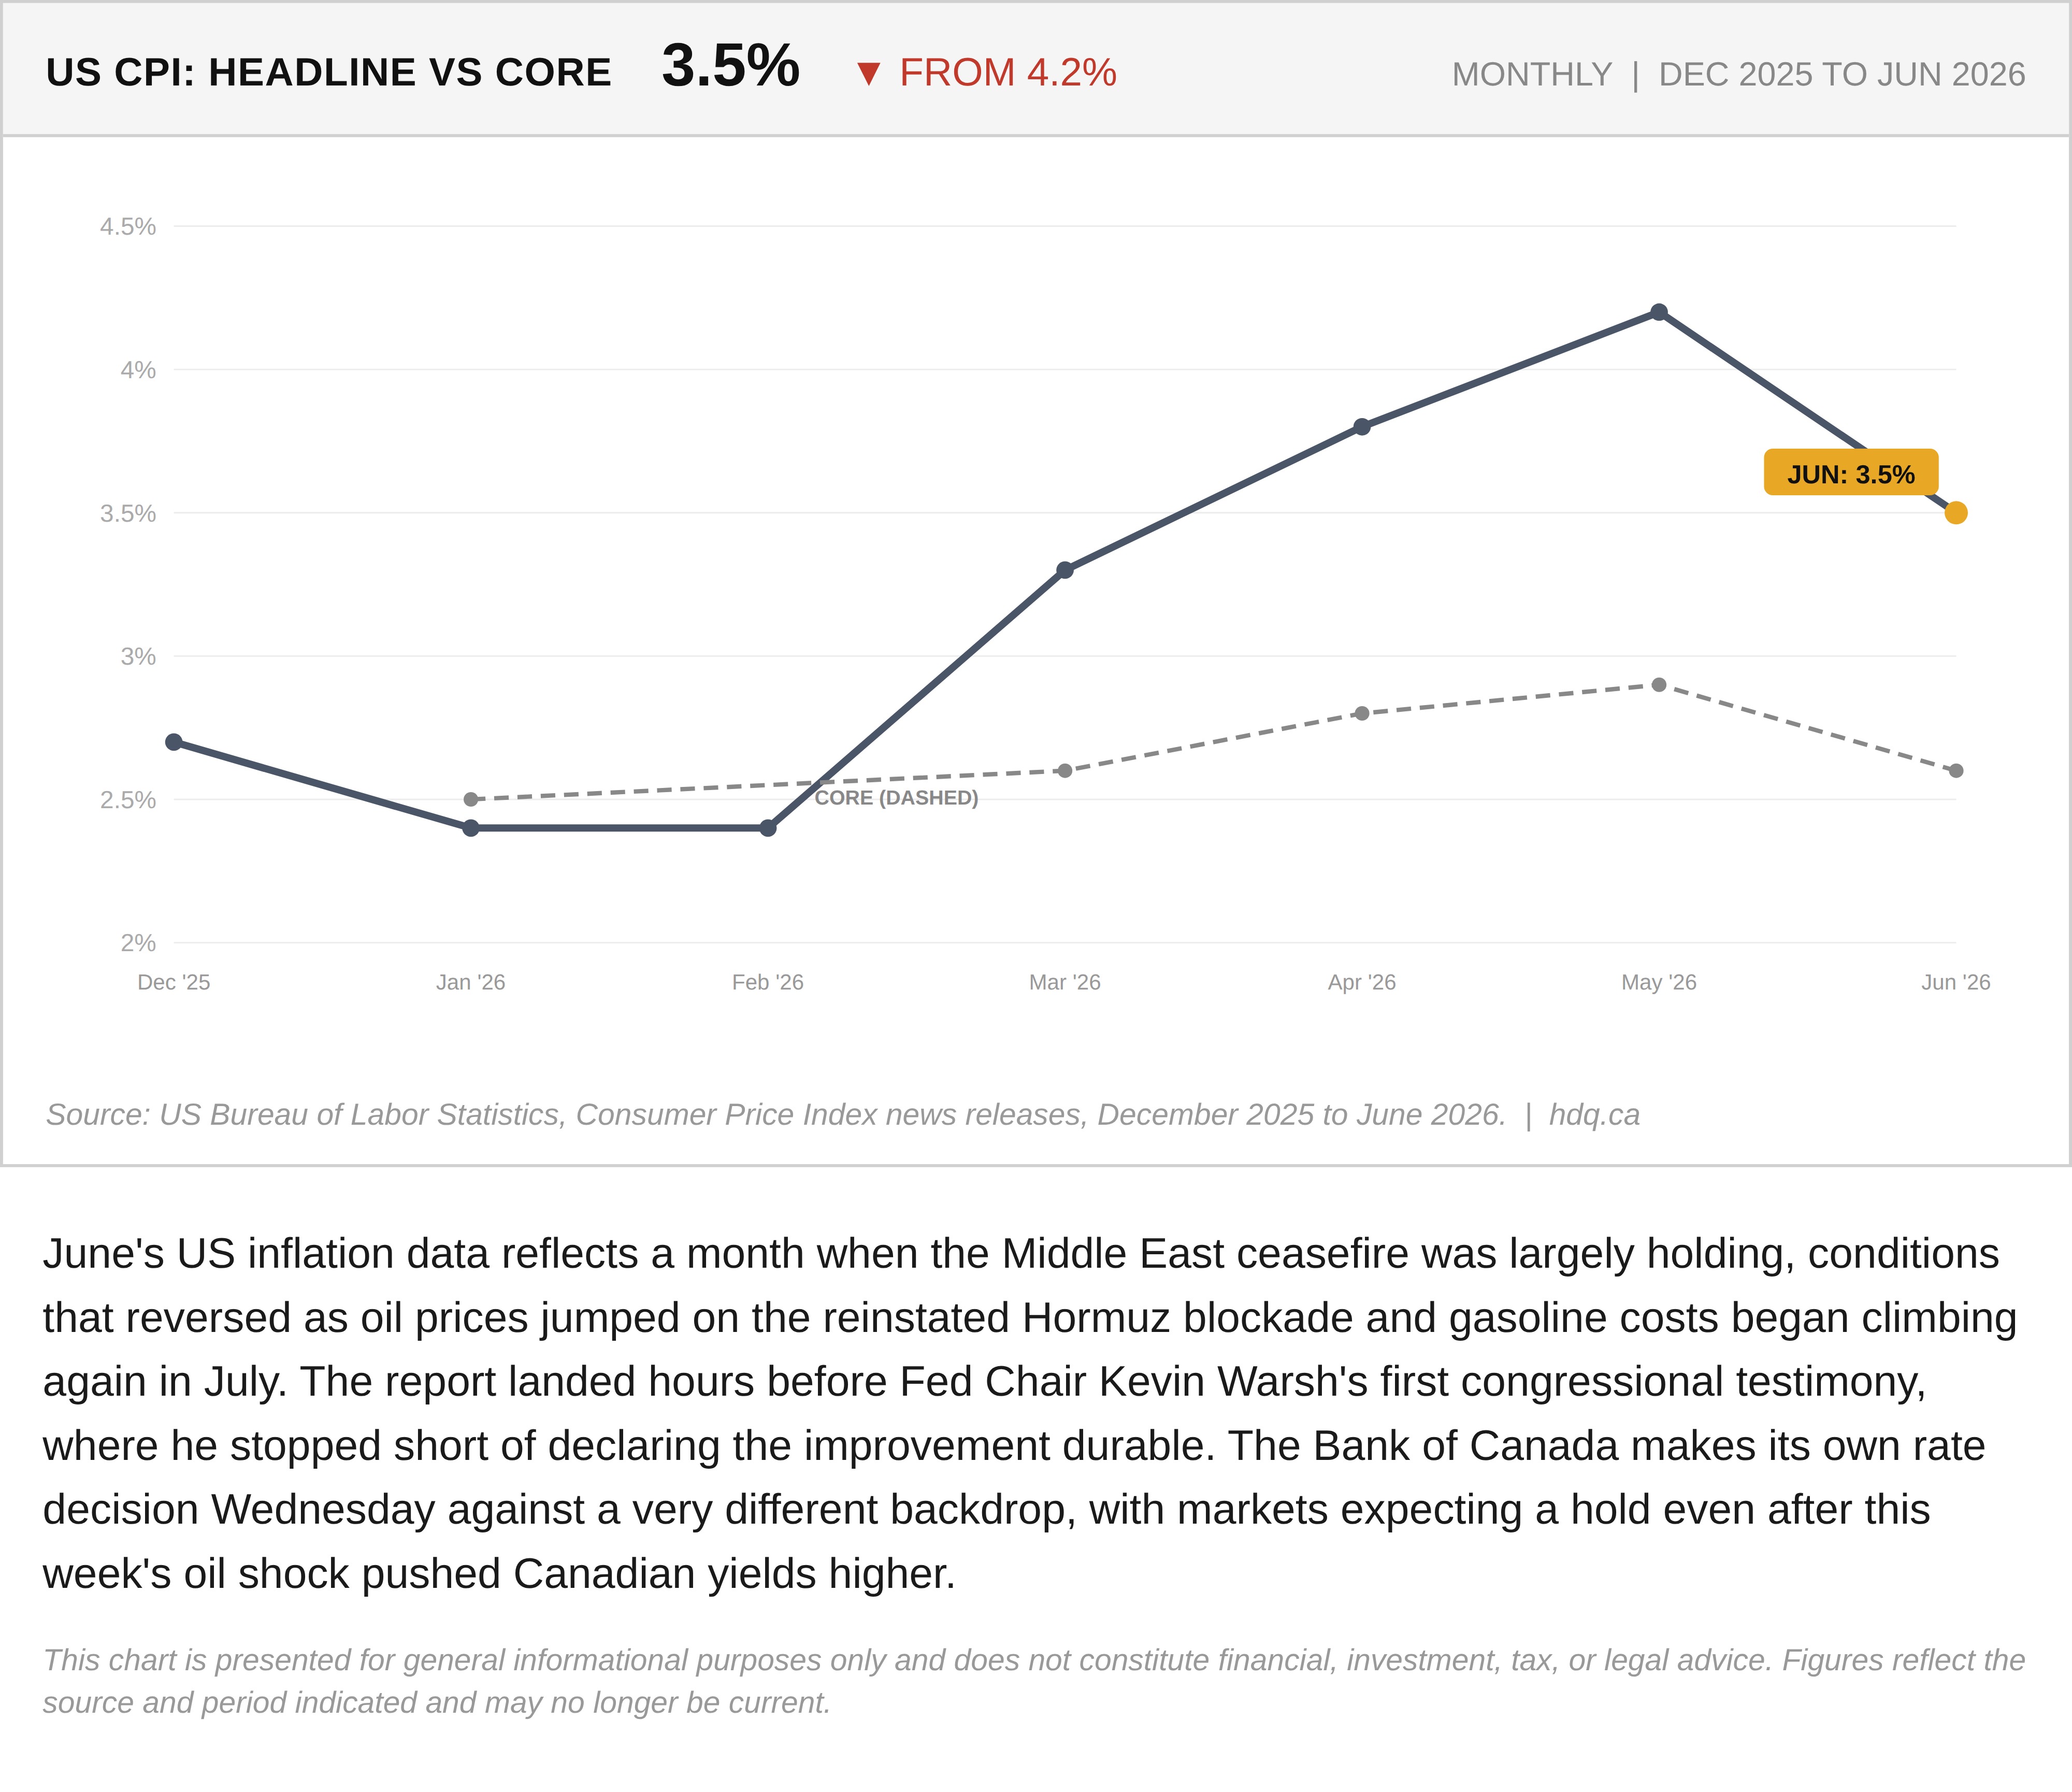
June's US inflation data reflects a month when the Middle East ceasefire was largely holding, conditions that reversed as oil prices jumped on the reinstated Hormuz blockade and gasoline costs began climbing again in July. The report landed hours before Fed Chair Kevin Warsh's first congressional testimony, where he stopped short of declaring the improvement durable. The Bank of Canada makes its own rate decision Wednesday against a very different backdrop, with markets expecting a hold even after this week's oil shock pushed Canadian yields higher.
This chart is presented for general informational purposes only and does not constitute financial, investment, tax, or legal advice. Figures reflect the source and period indicated and may no longer be current.

Related charts
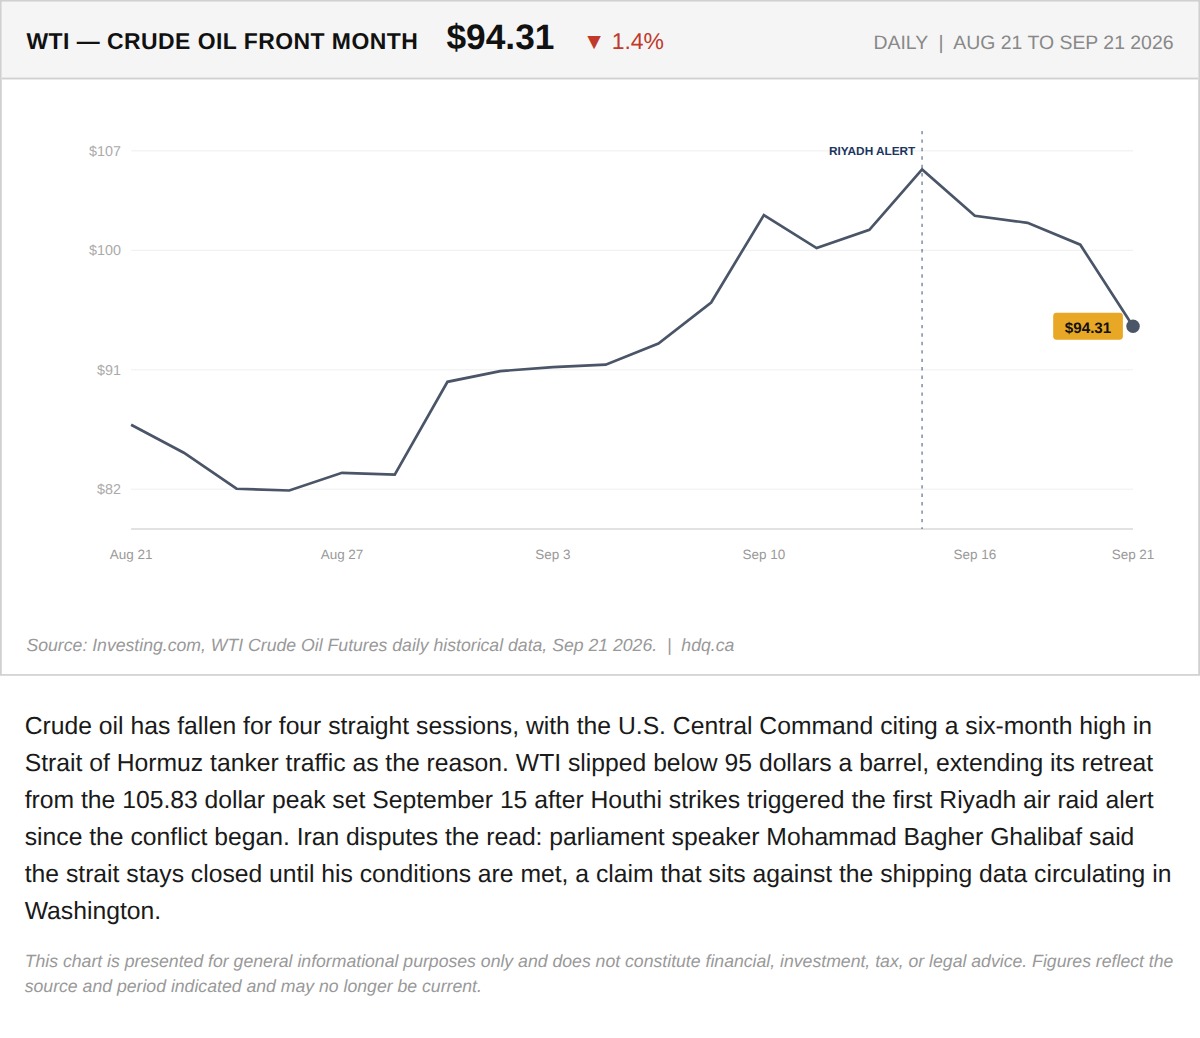
Crude oil has fallen for four straight sessions, with the U.S.
Oil Falls for a Fourth Session as Hormuz Shipping Data Is Disputed
September 21, 2026
View chart & download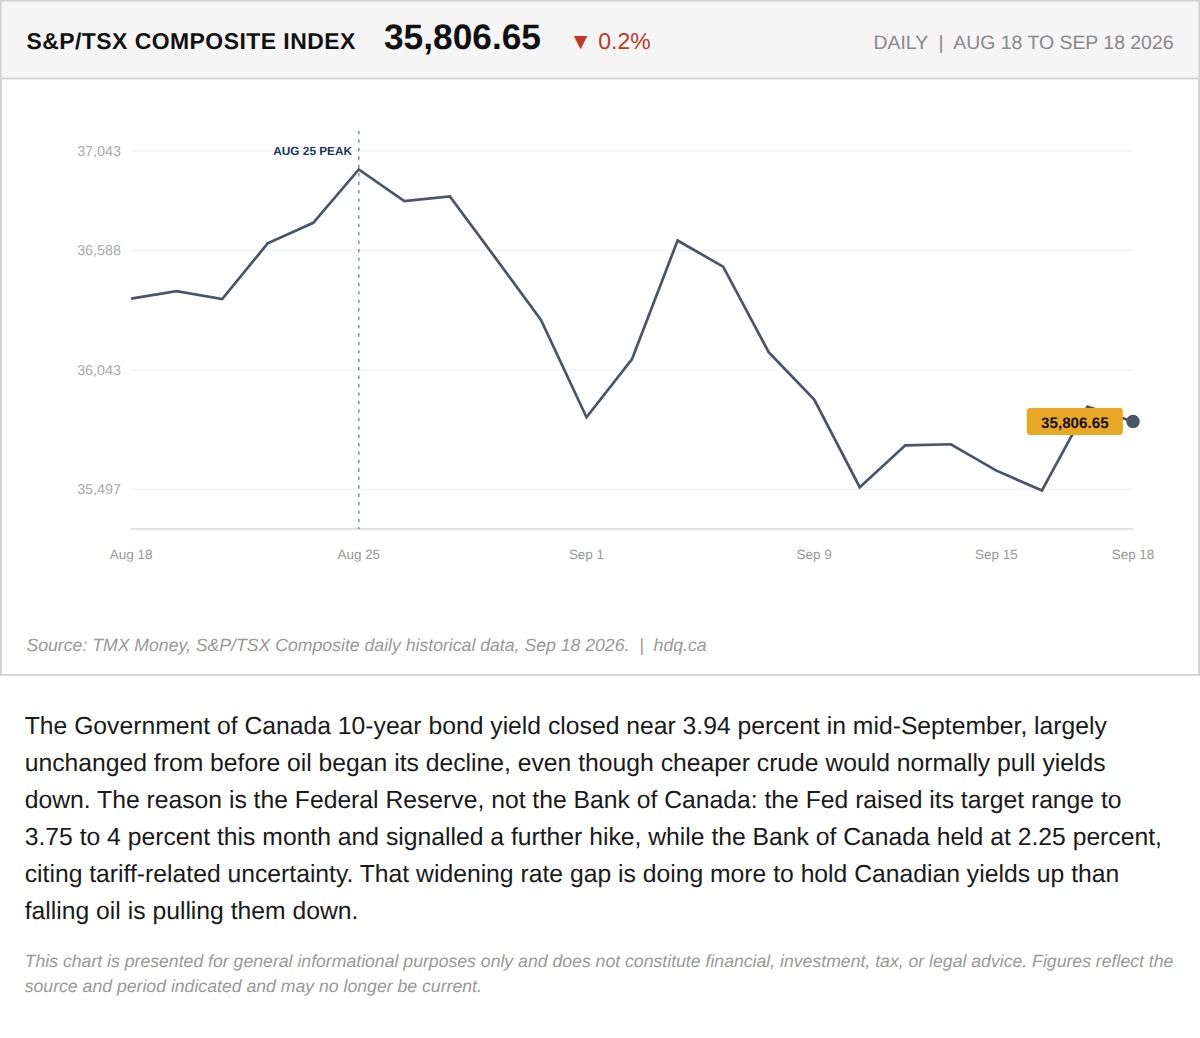
The Government of Canada 10-year bond yield closed near 3.94 percent in mid-September, largely unchanged from before oil began its decline,…
TSX Slides as Canadian Bond Yields Stay Elevated Despite Falling Oil
September 21, 2026
View chart & download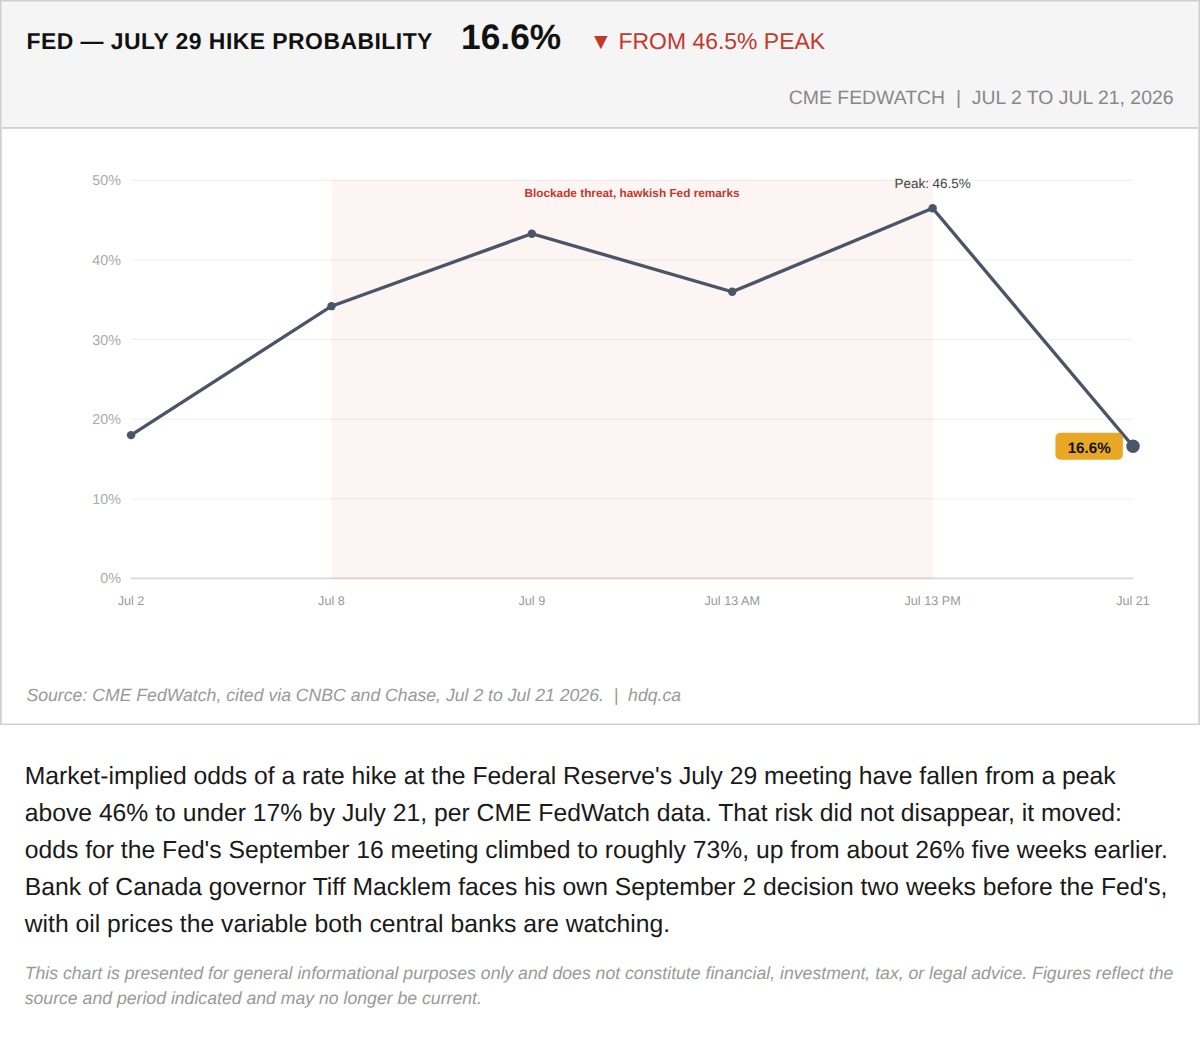
Market-implied odds of a rate hike at the Federal Reserve's July 29 meeting have fallen from a peak above 46% to under 17% by July 21, per CME FedWatch data.
The Fed Odds Faded. The BoC's September Dilemma Didn't.
July 23, 2026
View chart & download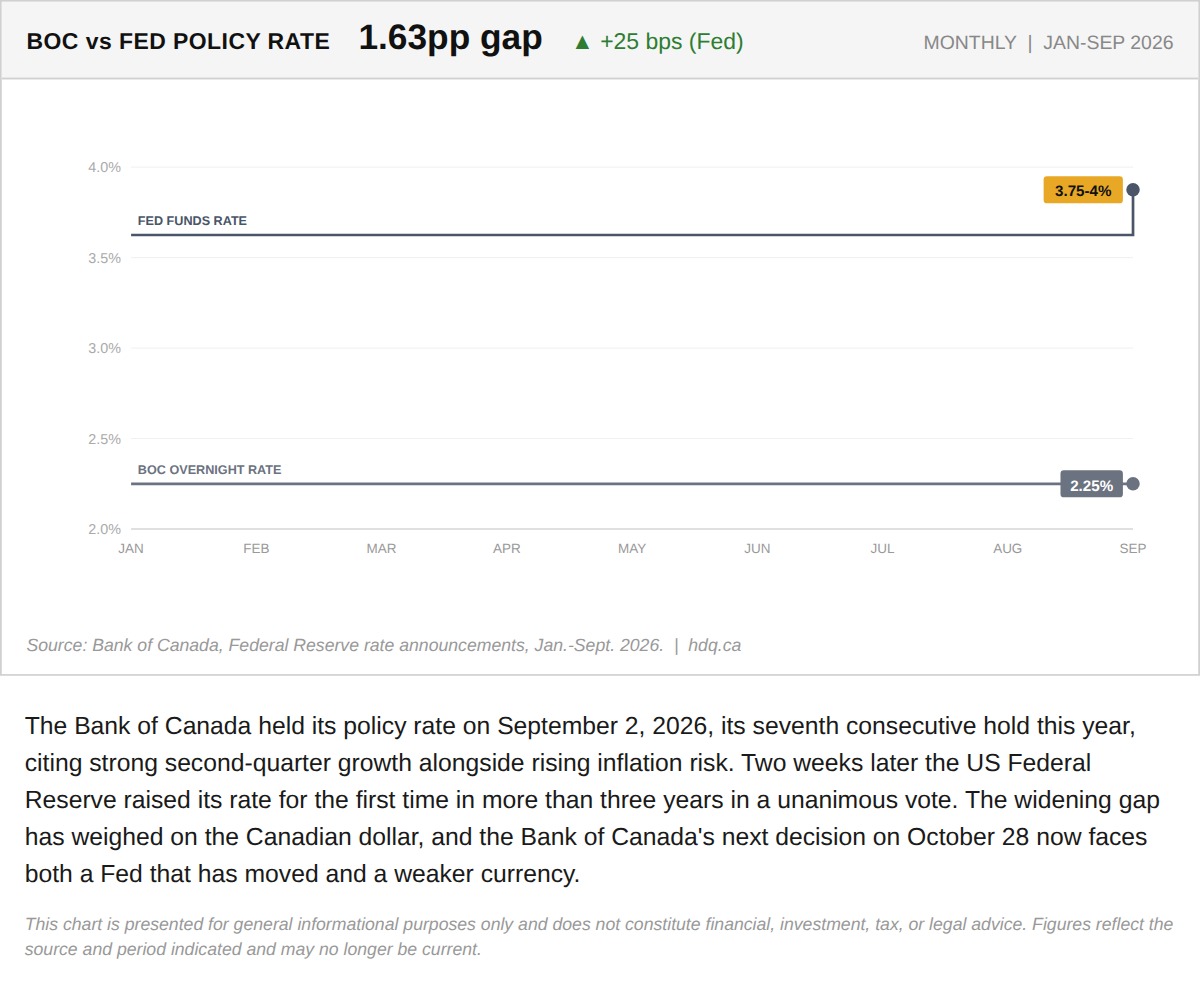
The Bank of Canada held its policy rate on September 2, 2026, its seventh consecutive hold this year, citing strong second-quarter growth alongside rising inflation risk.
The Bank of Canada Has Held Seven Times This Year. The Fed Just Broke Its Own Pattern.
September 23, 2026
View chart & download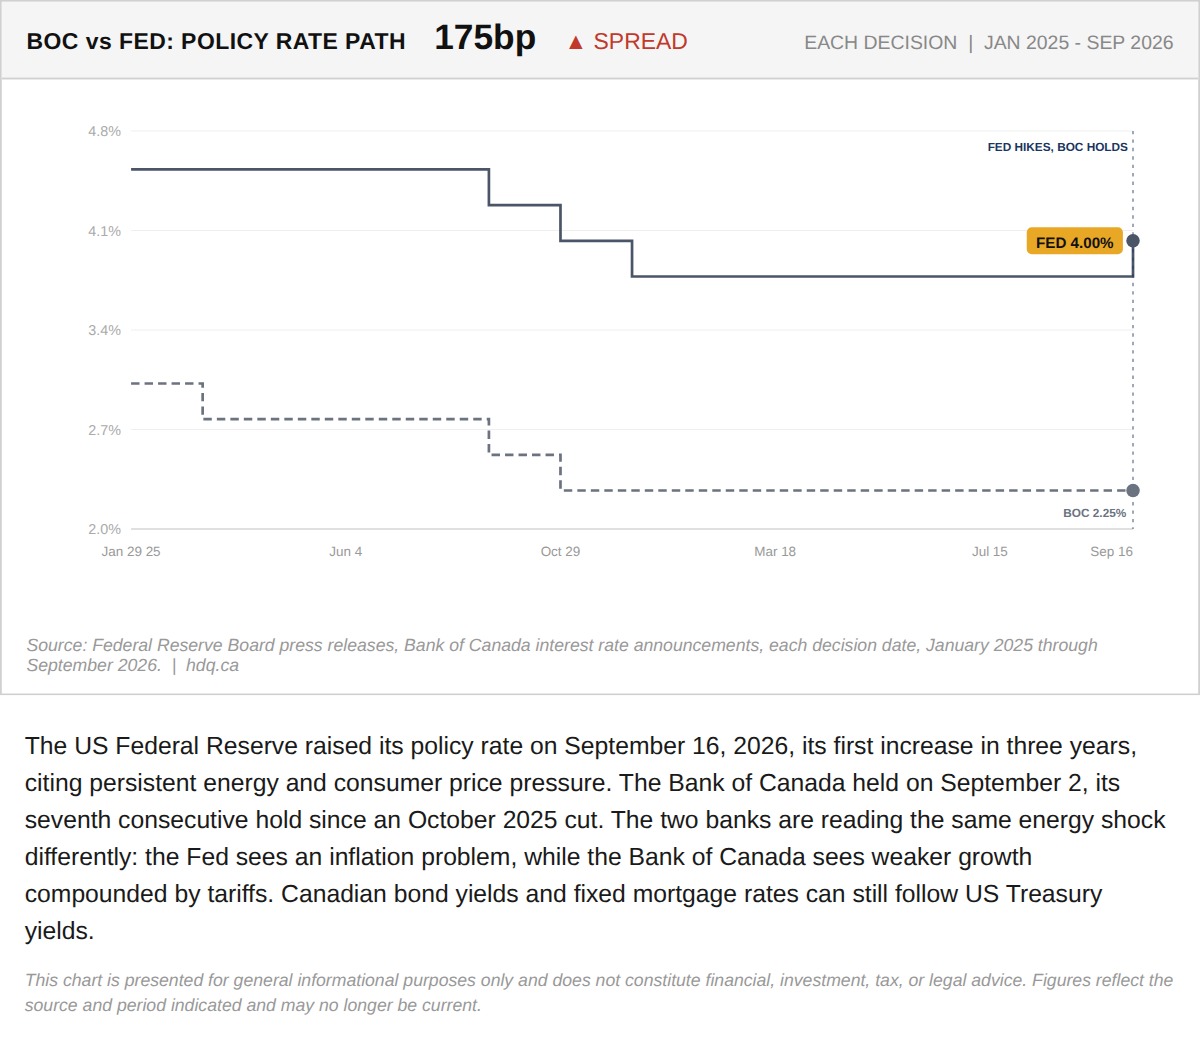
The US Federal Reserve raised its policy rate on September 16, 2026, its first increase in three years, citing persistent energy and consumer price pressure.
Why the Fed Just Broke Rank With the Bank of Canada
September 22, 2026
View chart & download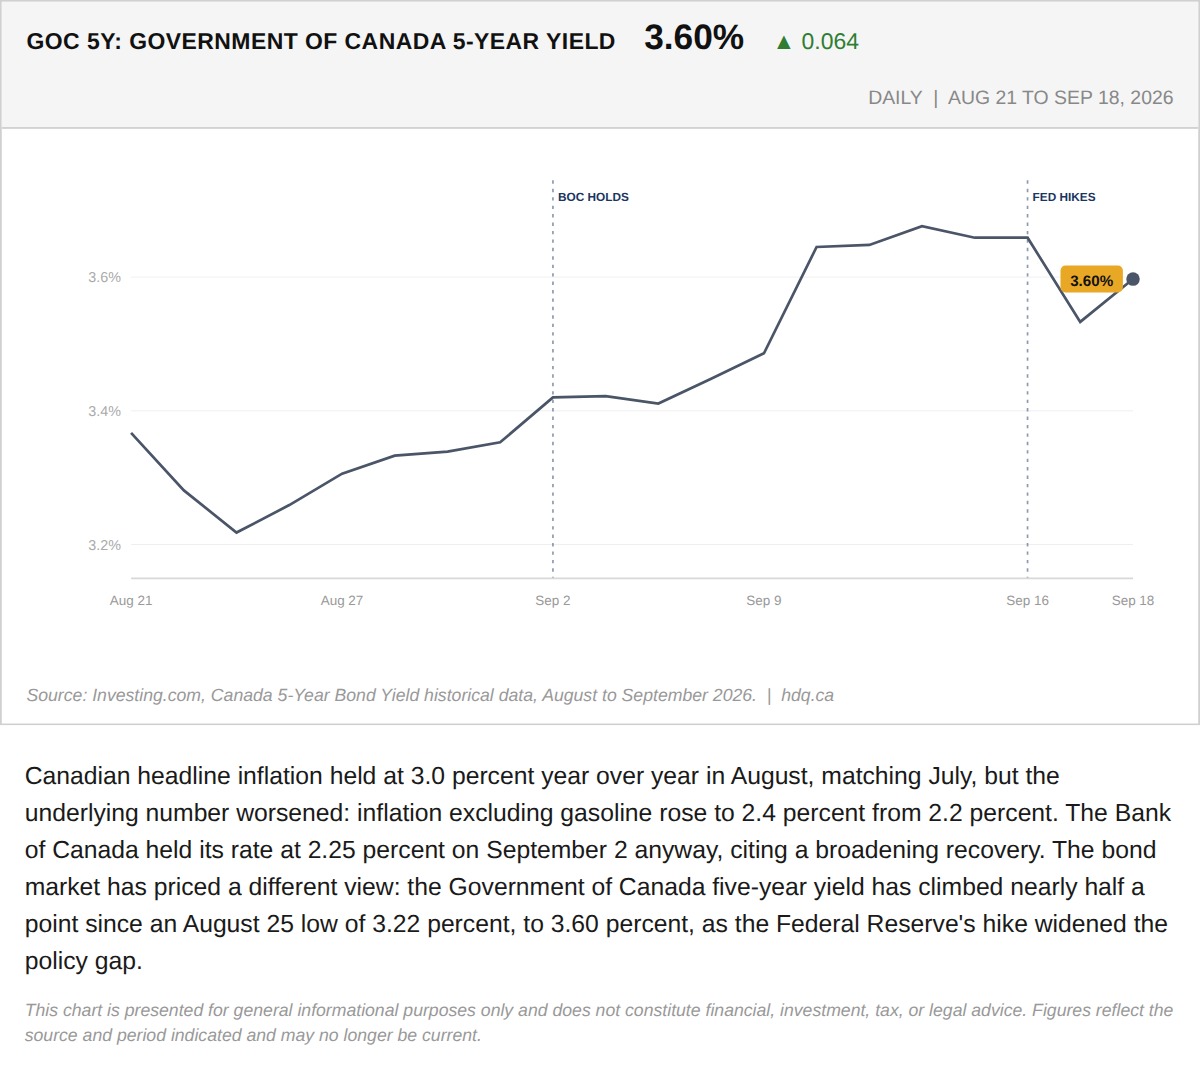
Canadian headline inflation held at 3.0 percent year over year in August, matching July, but the underlying number worsened: inflation…
The Bond Market Already Moved Before the Bank of Canada Has To
September 21, 2026
View chart & download