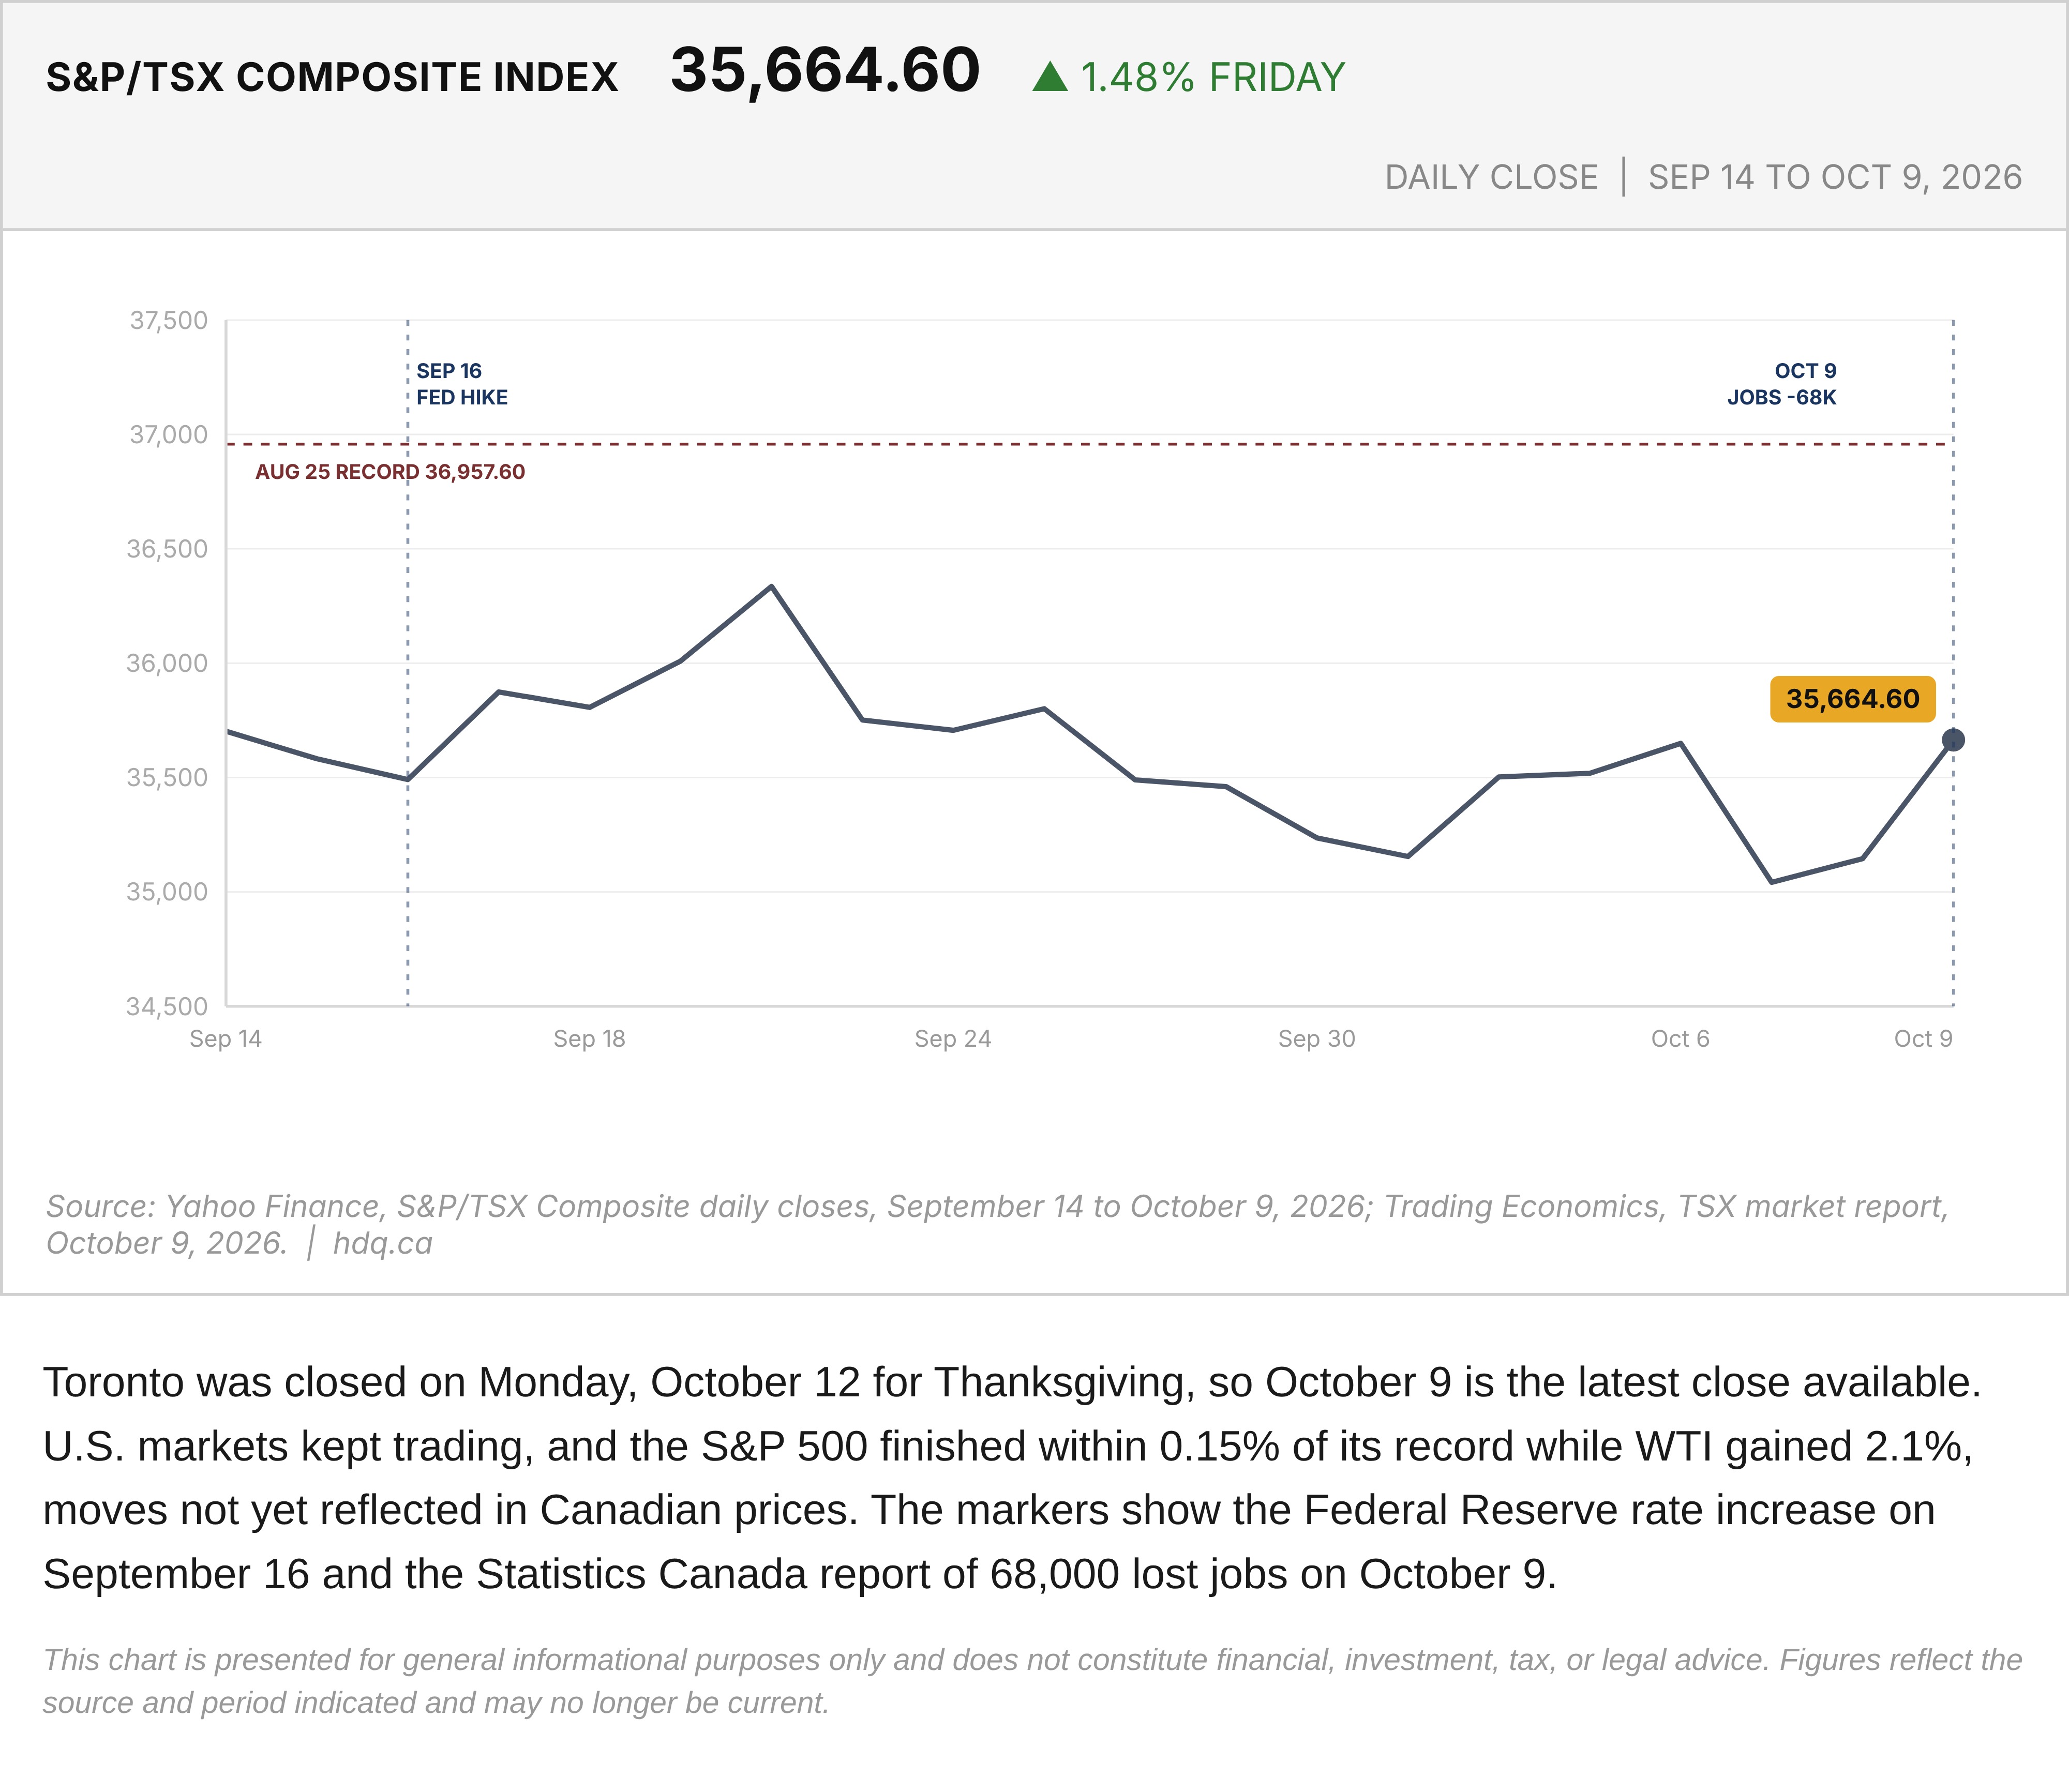
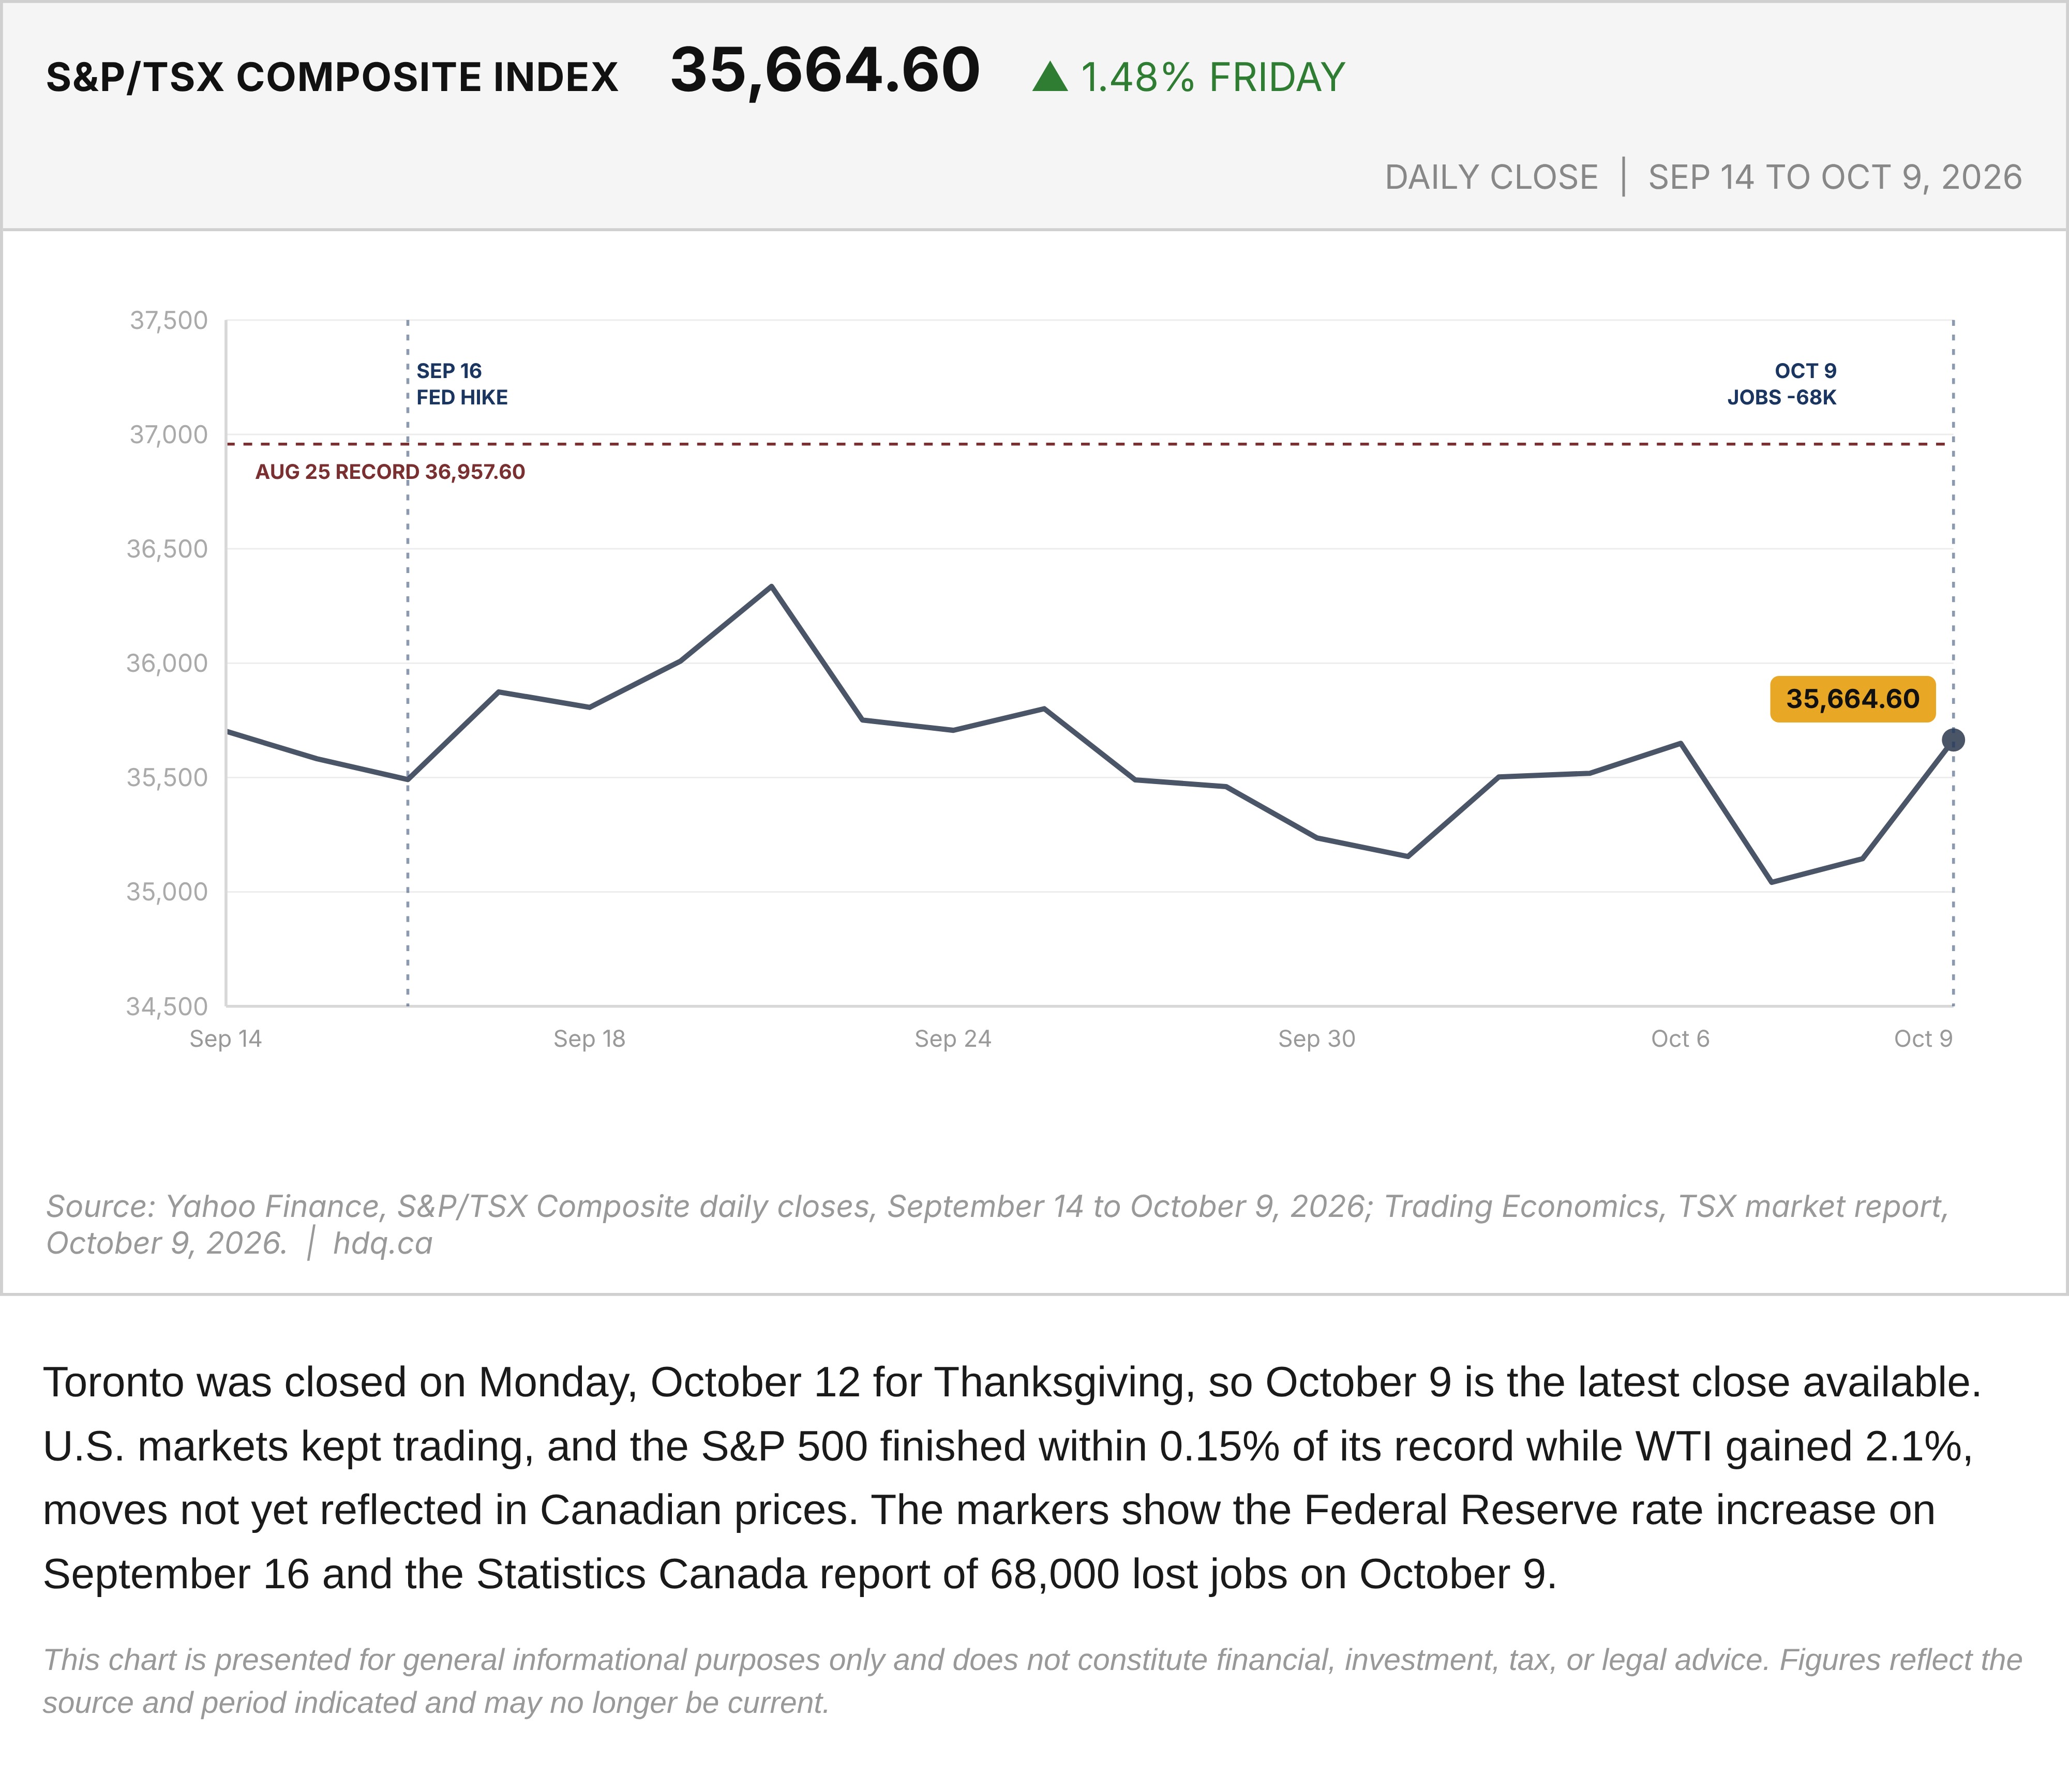
Toronto was closed on Monday, October 12 for Thanksgiving, so October 9 is the latest close available. U.S. markets kept trading, and the S&P 500 finished within 0.15% of its record while WTI gained 2.1%, moves not yet reflected in Canadian prices. The markers show the Federal Reserve rate increase on September 16 and the Statistics Canada report of 68,000 lost jobs on October 9.
This chart is presented for general informational purposes only and does not constitute financial, investment, tax, or legal advice. Figures reflect the source and period indicated and may no longer be current.
Related charts
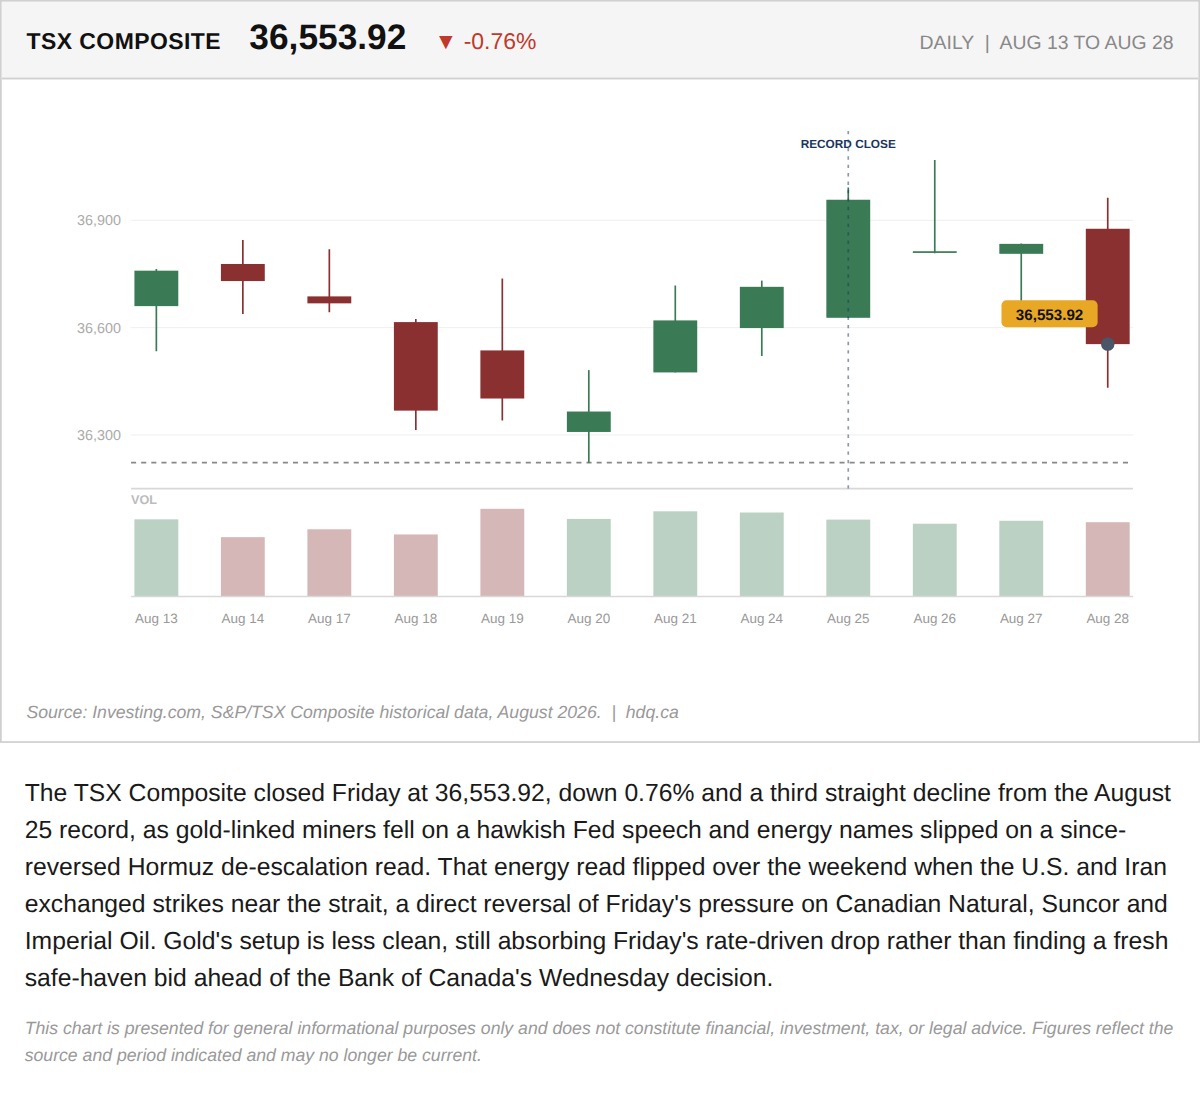
The TSX Composite closed Friday at 36,553.92, down 0.76% and a third straight decline from the August 25 record, as gold-linked miners fell…
The TSX Set a Record Close Six Sessions Ago. It Has Given Back 400 Points Since
August 31, 2026
View chart & download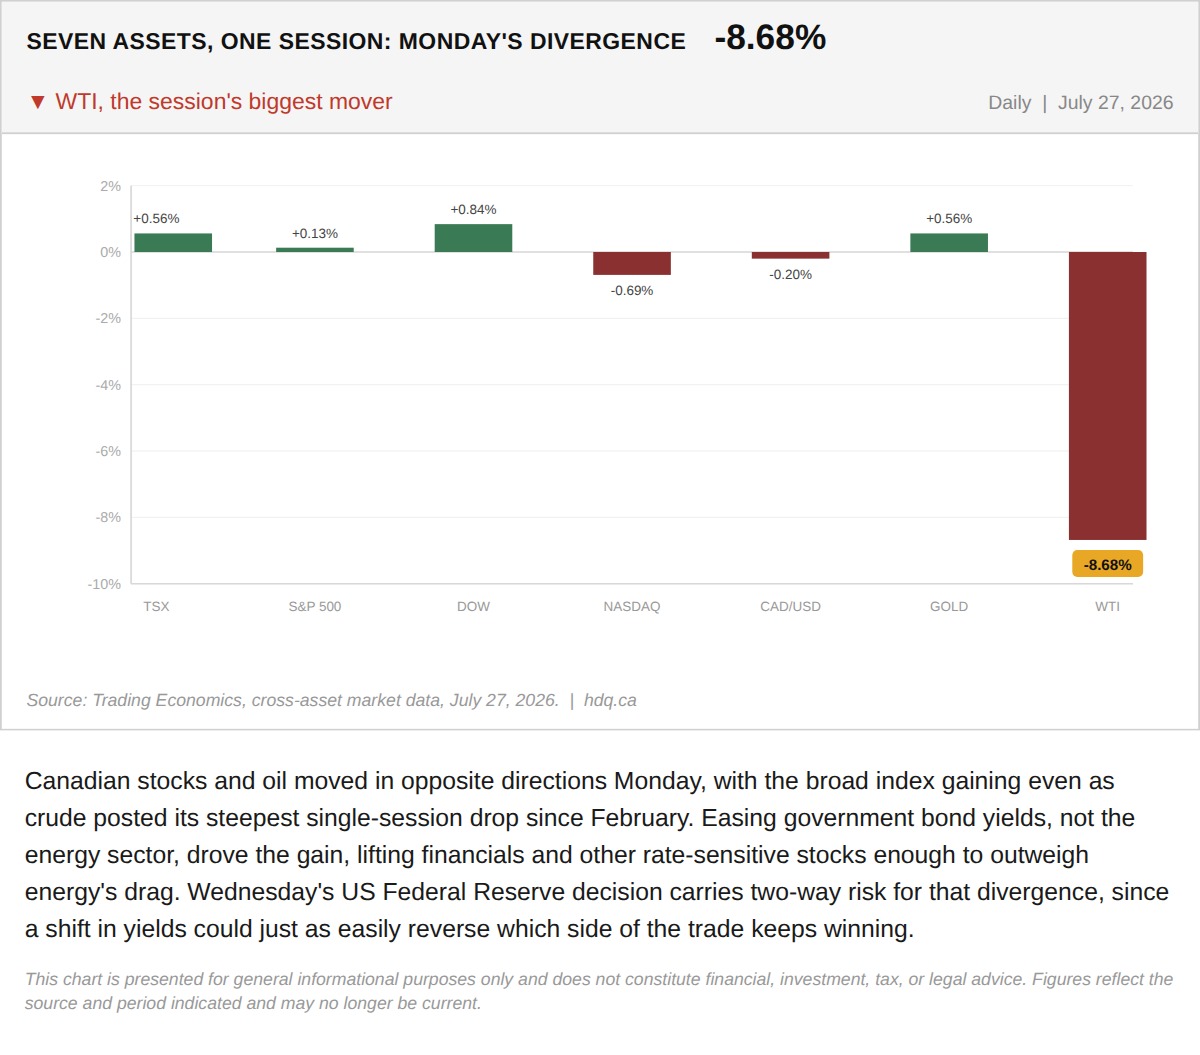
Canadian stocks and oil moved in opposite directions Monday, with the broad index gaining even as crude posted its steepest single-session drop since February.
The TSX Gained 0.56% Monday While Oil Fell 8.7%. That Divergence Is the Trade.
July 28, 2026
View chart & download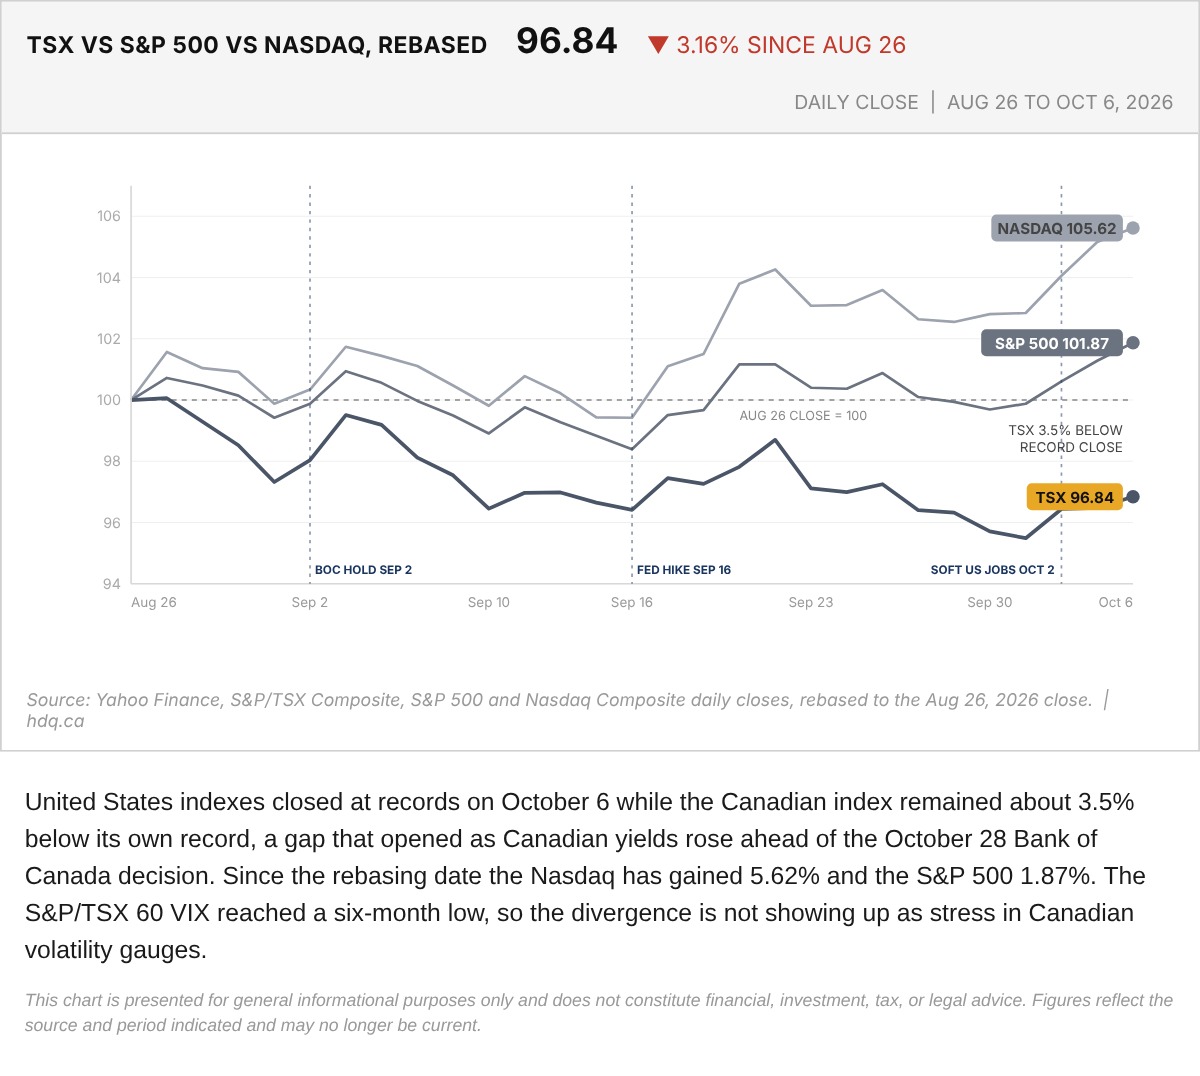
United States indexes closed at records on October 6 while the Canadian index remained about 3.5% below its own record, a gap that opened…
TSX, S&P 500 and Nasdaq Rebased to the August 26 Close
October 7, 2026
View chart & download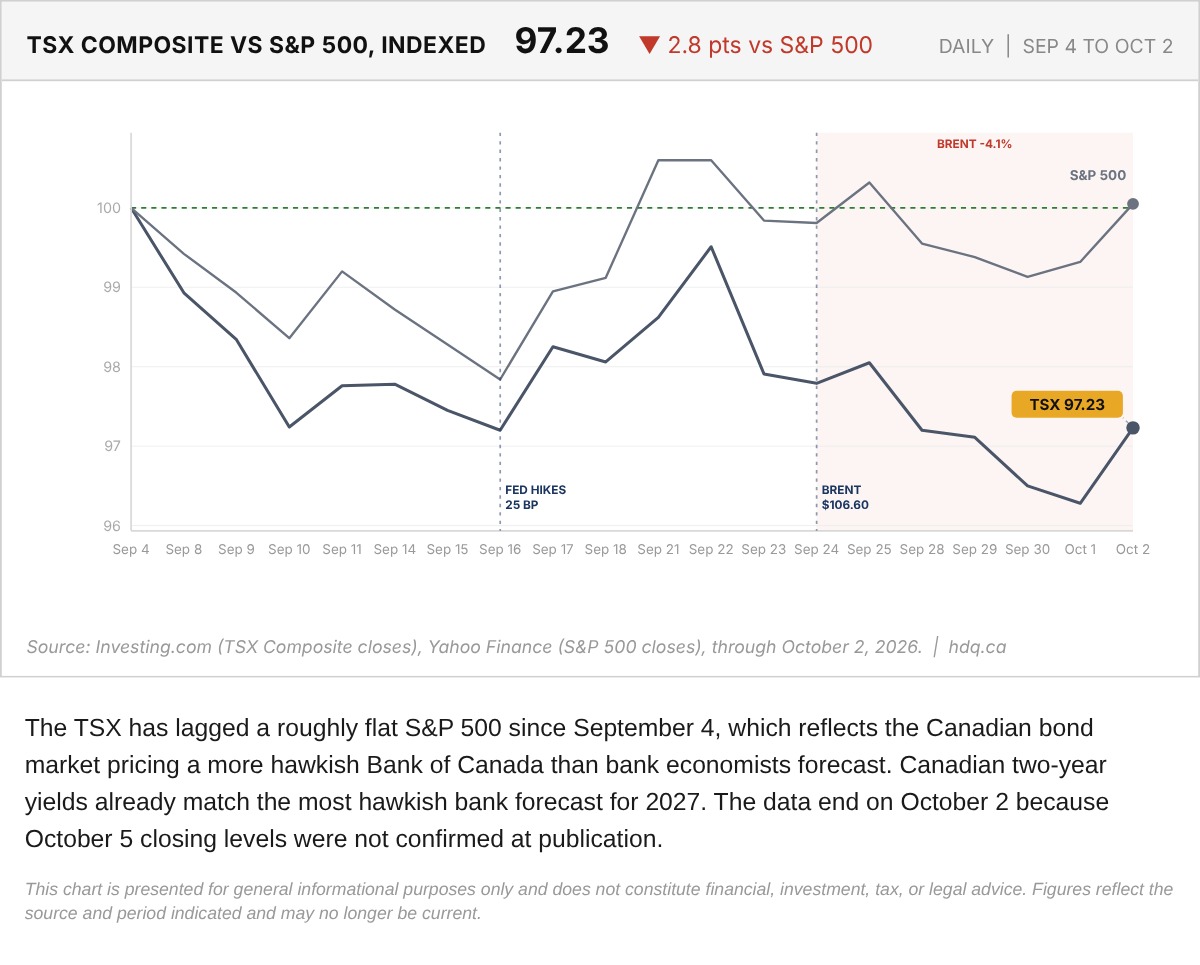
The TSX has lagged a roughly flat S&P 500 since September 4, which reflects the Canadian bond market pricing a more hawkish Bank of Canada than bank economists forecast.
TSX Composite Versus S&P 500, Indexed to September 4, 2026
October 5, 2026
View chart & download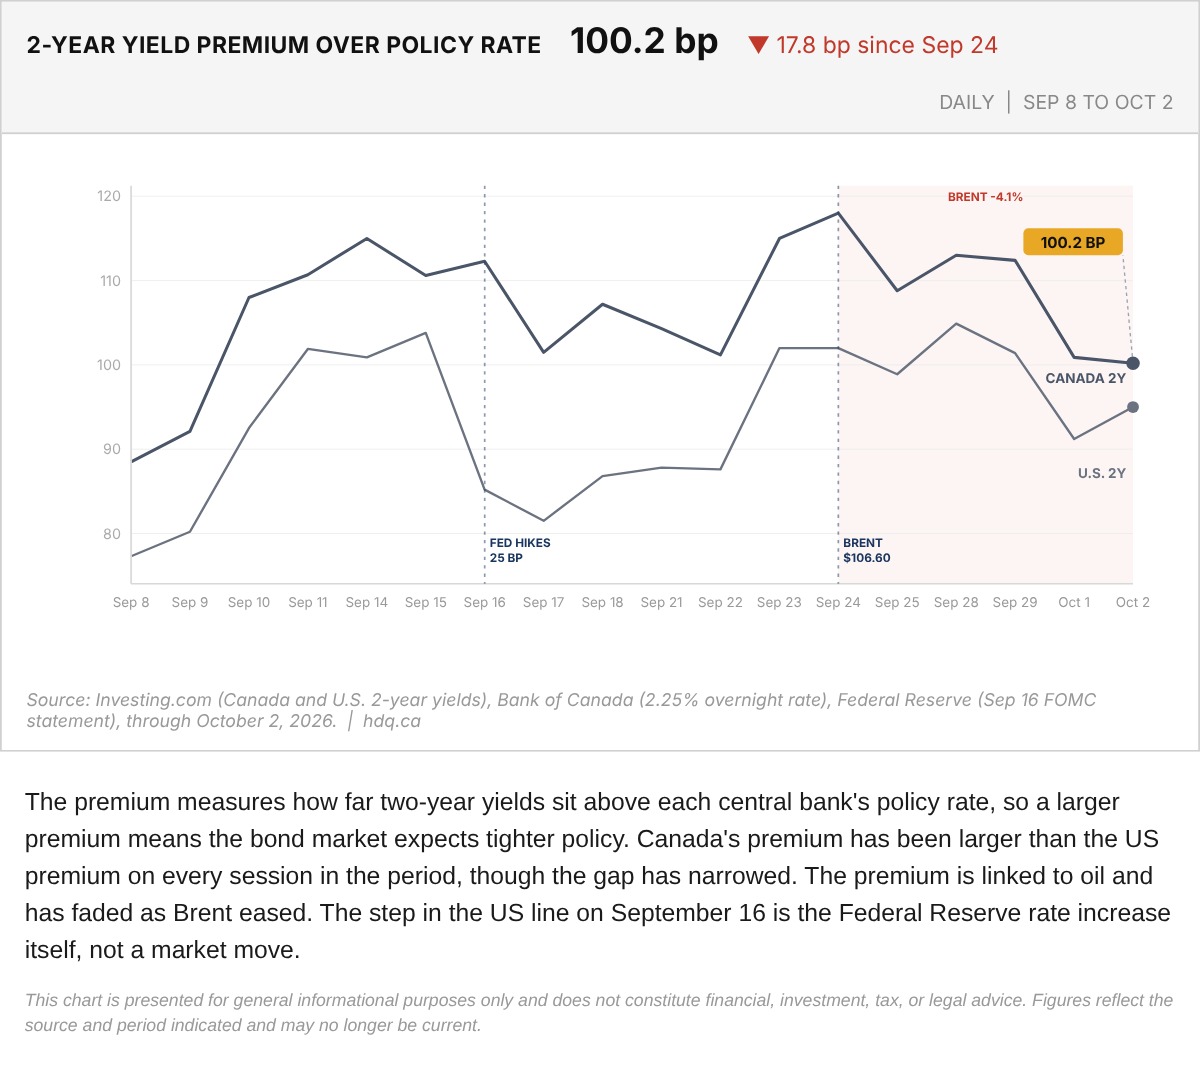
The premium measures how far two-year yields sit above each central bank's policy rate, so a larger premium means the bond market expects tighter policy.
Two-Year Yield Premium Over Policy Rate: Canada and the US, September 8 to October 2, 2026
October 5, 2026
View chart & download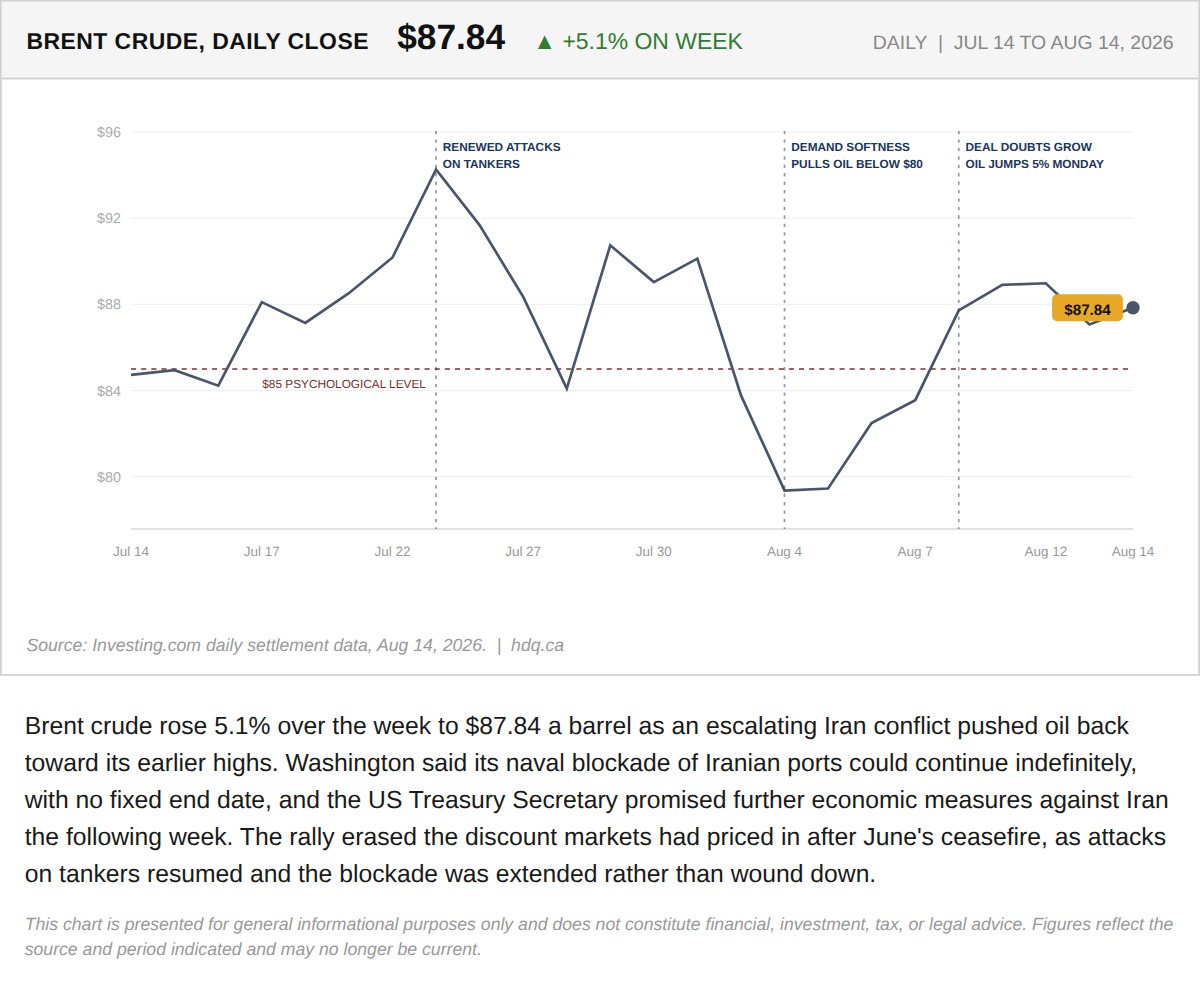
Brent crude rose 5.1% over the week to $87.84 a barrel as an escalating Iran conflict pushed oil back toward its earlier highs.
The TSX and Gold Both Set Records This Week. That Should Not Happen Together.
August 15, 2026
View chart & download