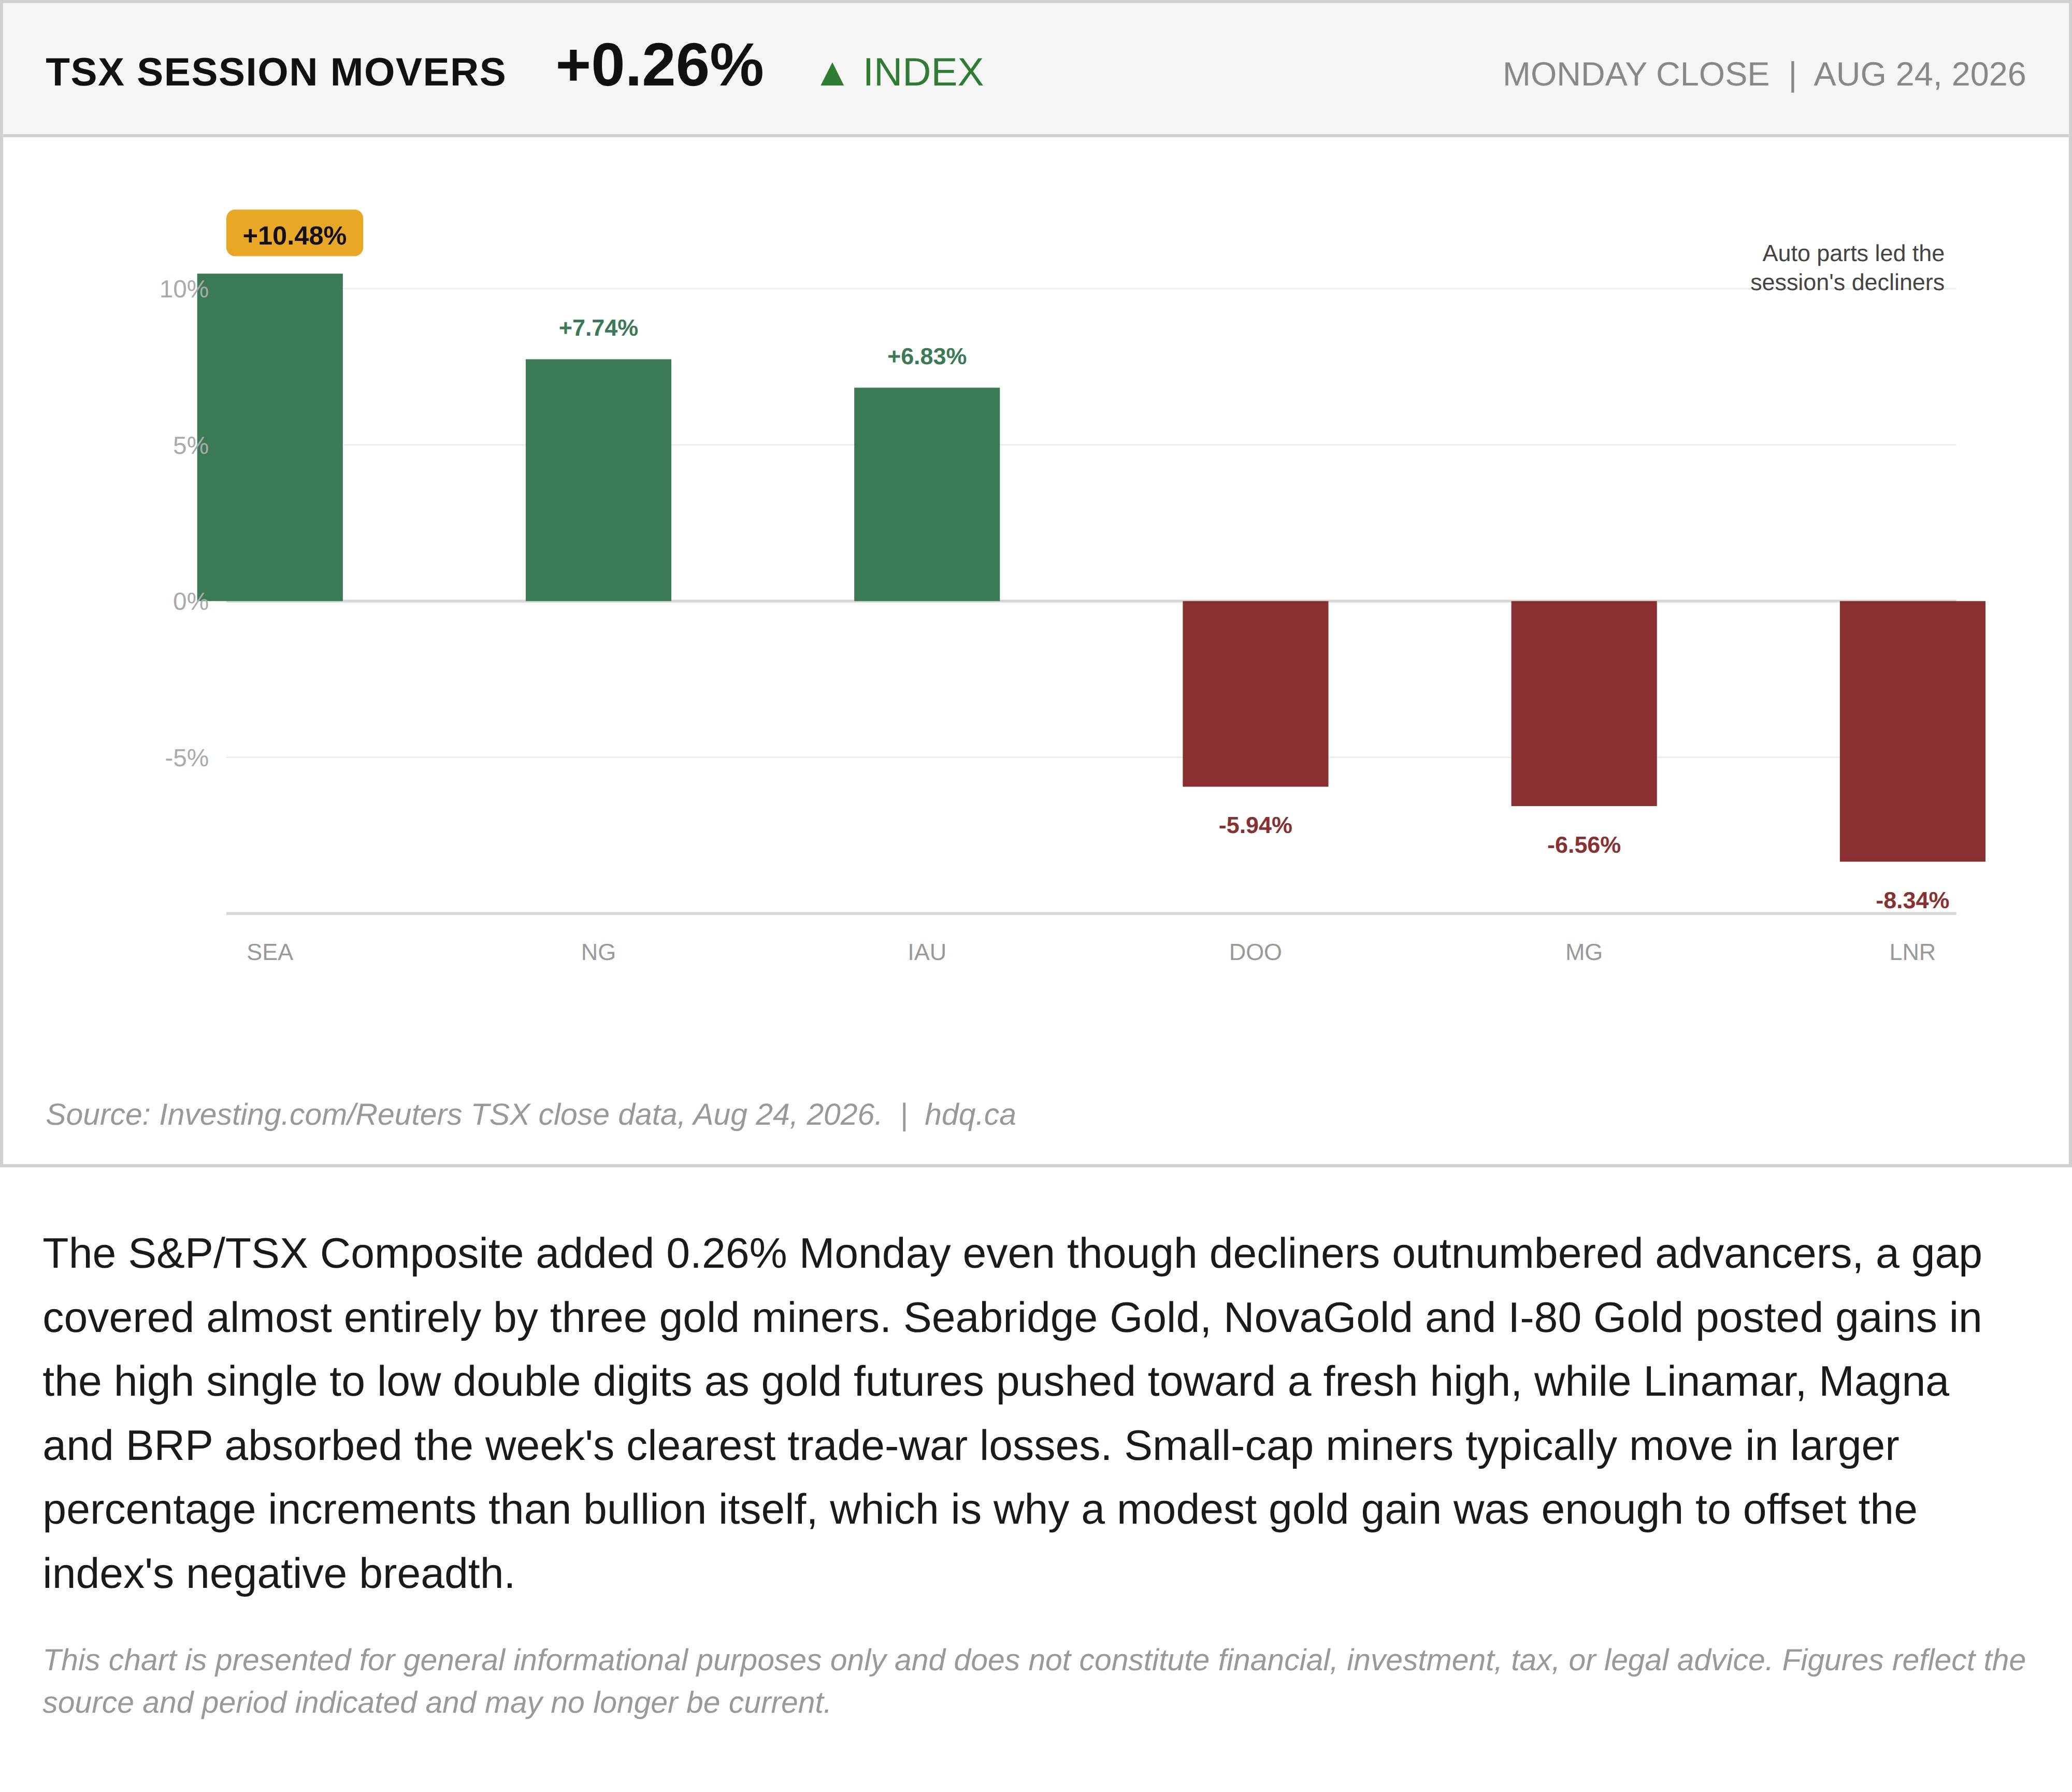
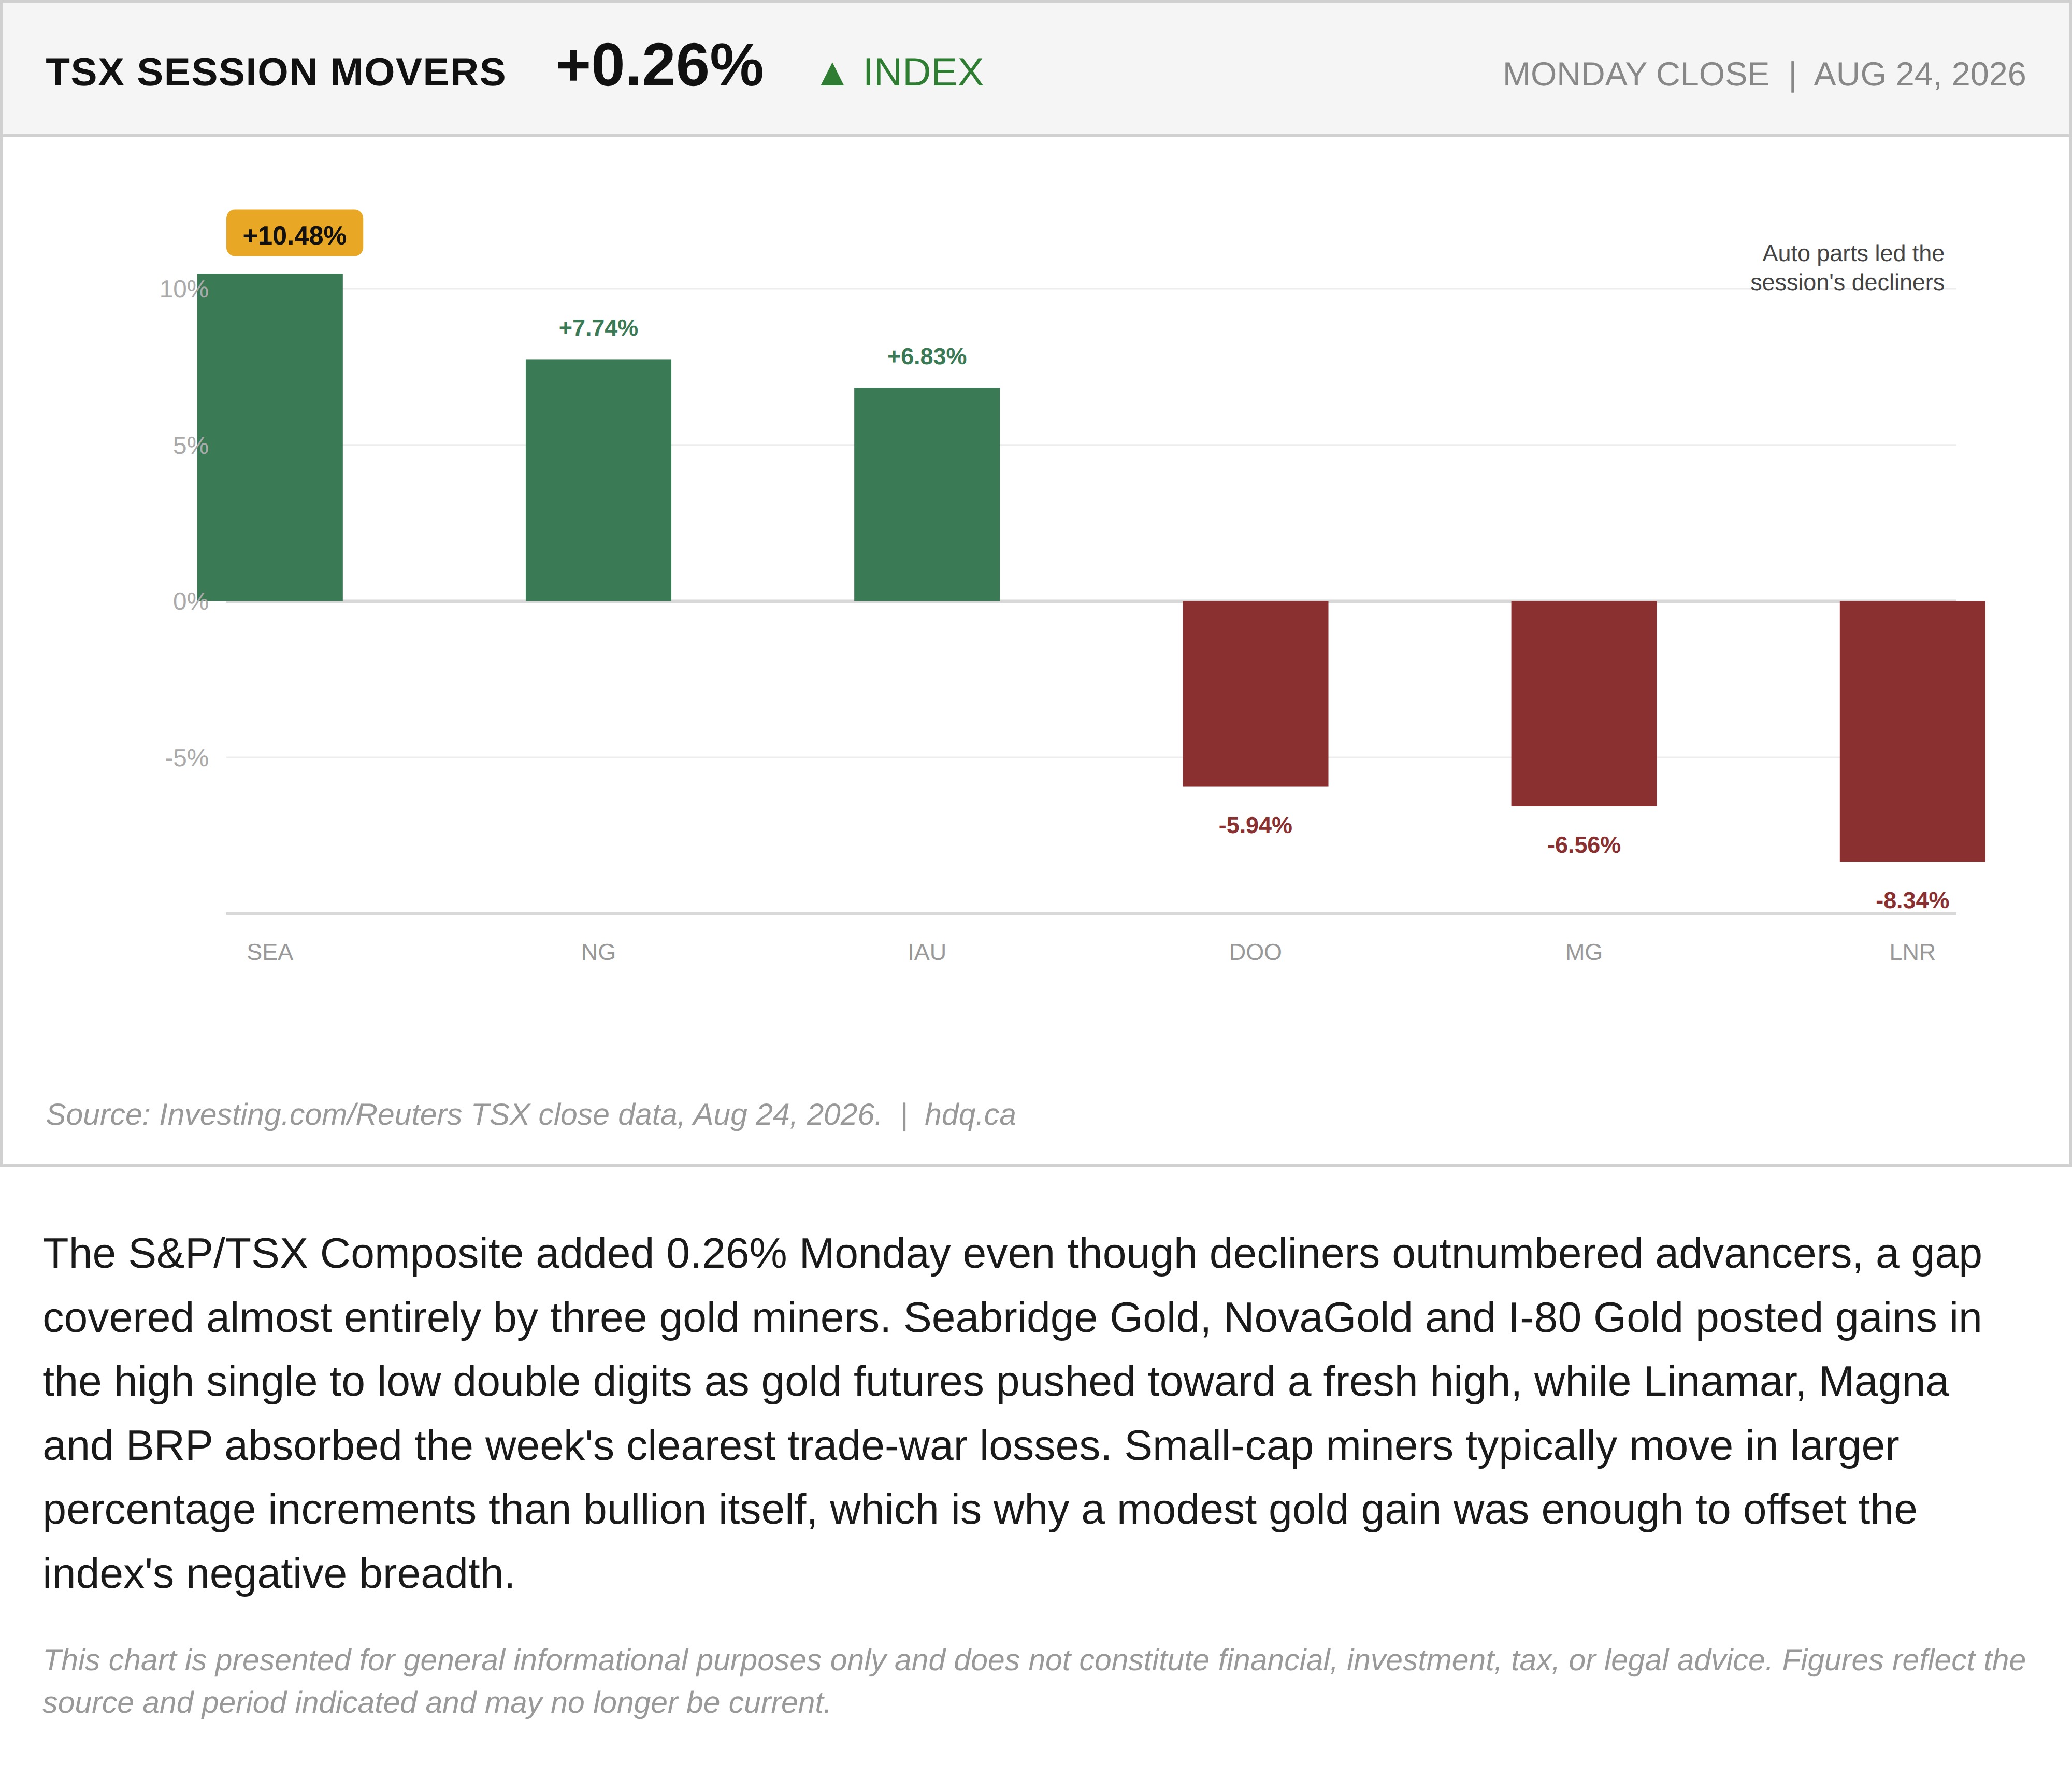
The S&P/TSX Composite added 0.26% Monday even though decliners outnumbered advancers, a gap covered almost entirely by three gold miners. Seabridge Gold, NovaGold and I-80 Gold posted gains in the high single to low double digits as gold futures pushed toward a fresh high, while Linamar, Magna and BRP absorbed the week's clearest trade-war losses. Small-cap miners typically move in larger percentage increments than bullion itself, which is why a modest gold gain was enough to offset the index's negative breadth.
This chart is presented for general informational purposes only and does not constitute financial, investment, tax, or legal advice. Figures reflect the source and period indicated and may no longer be current.
Related charts
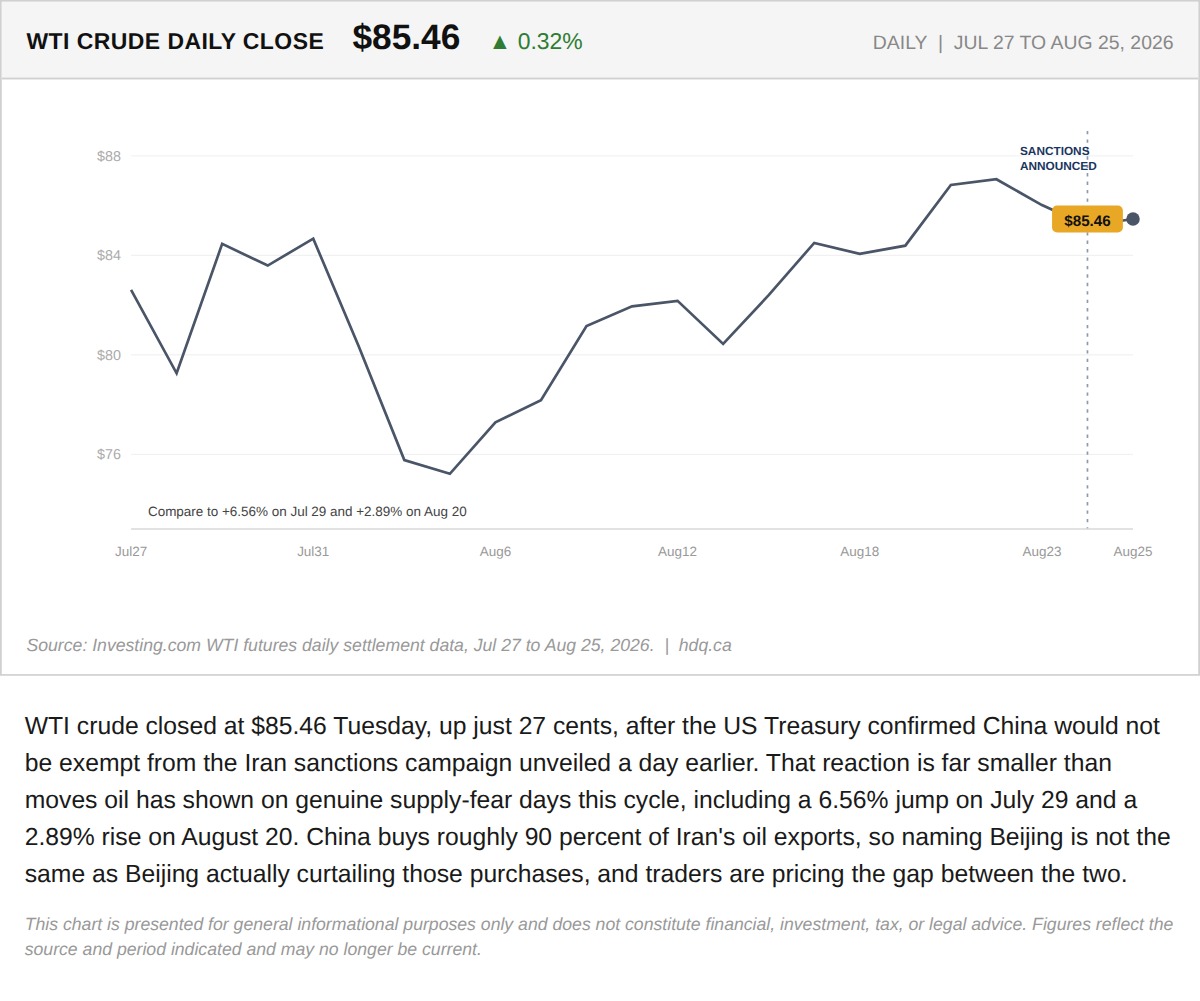
WTI crude closed at $85.46 Tuesday, up just 27 cents, after the US Treasury confirmed China would not be exempt from the Iran sanctions campaign unveiled a day earlier.
WTI Barely Moves After China Loses Its Iran Sanctions Exemption
August 25, 2026
View chart & download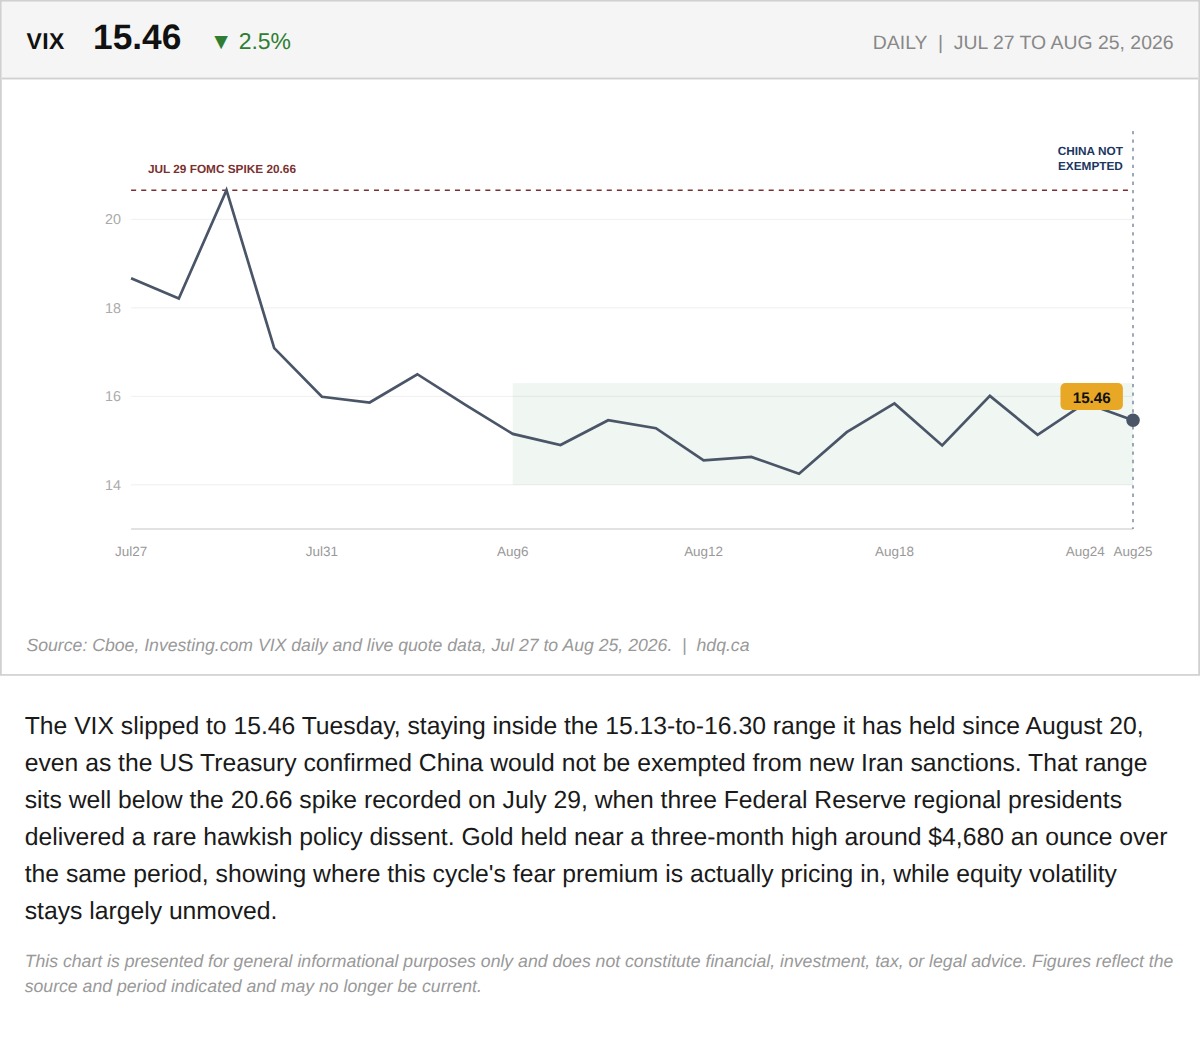
The VIX slipped to 15.46 Tuesday, staying inside the 15.13-to-16.30 range it has held since August 20, even as the US Treasury confirmed…
VIX Holds Below 16.3 Even as China's Iran Exemption Ends
August 25, 2026
View chart & download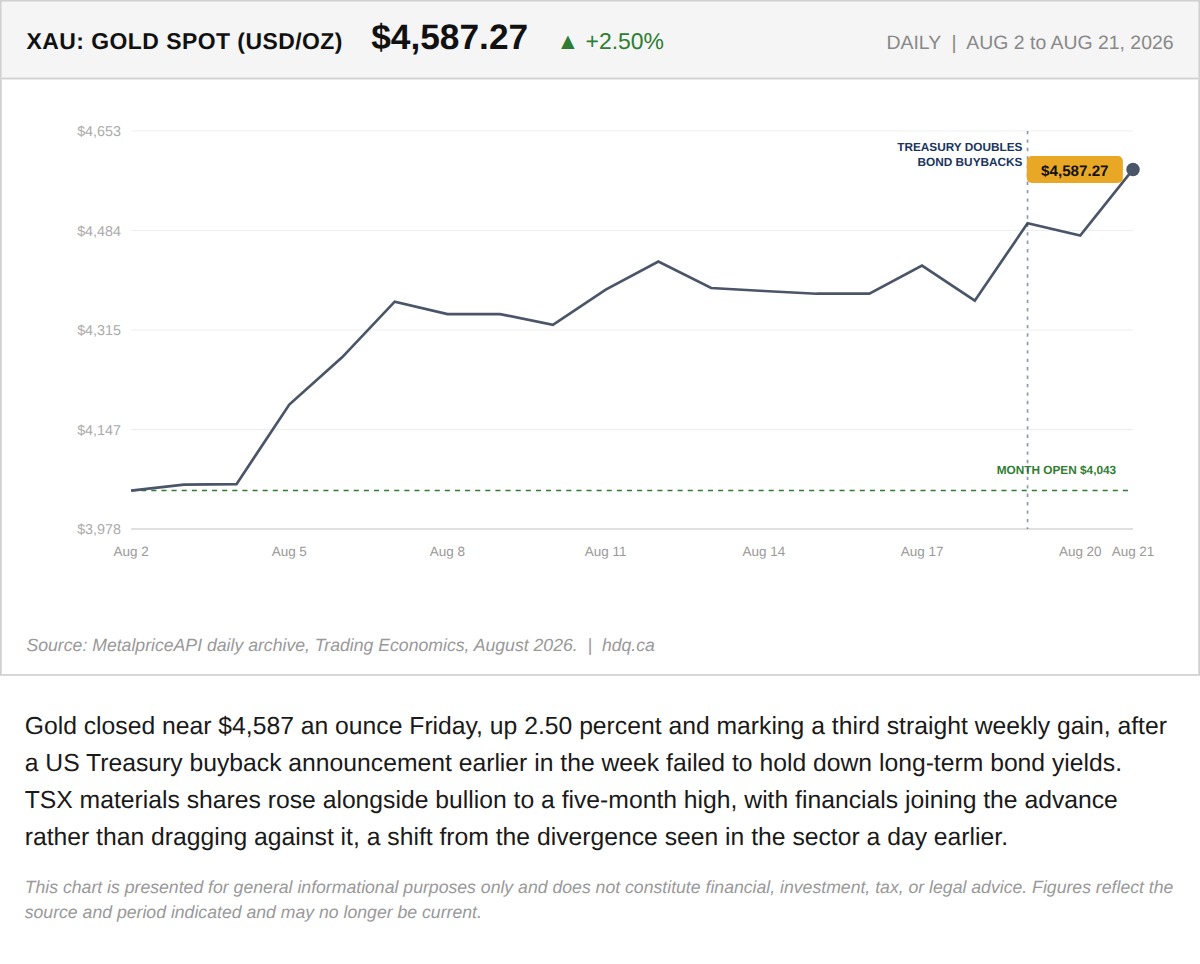
Gold closed near $4,587 an ounce Friday, up 2.50 percent and marking a third straight weekly gain, after a US Treasury buyback announcement…
Gold Extends Third Straight Weekly Gain to $4,587 an Ounce
August 21, 2026
View chart & download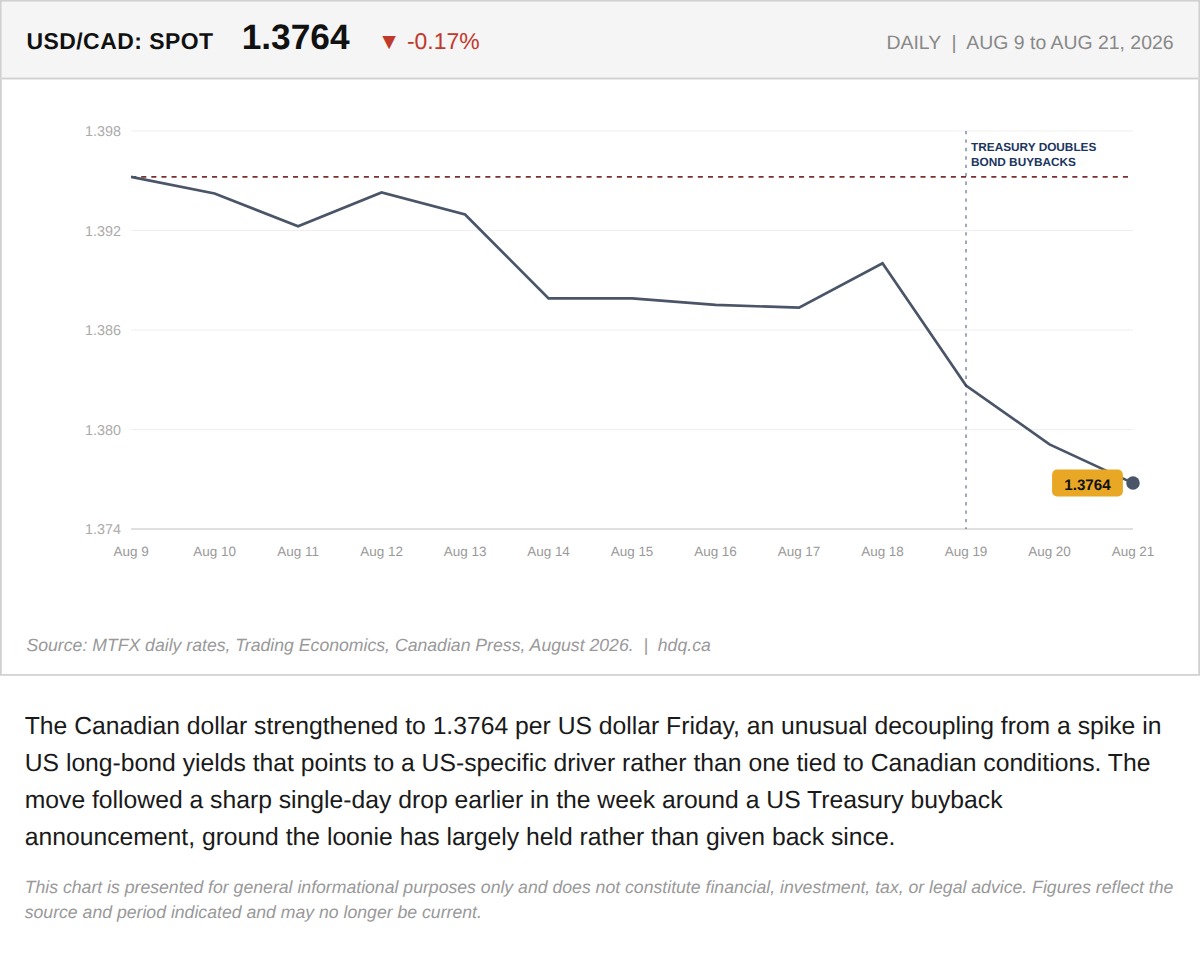
The Canadian dollar strengthened to 1.3764 per US dollar Friday, an unusual decoupling from a spike in US long-bond yields that points to a…
Canadian Dollar Strengthens to 1.3764 Per USD, Decoupling From US Yields
August 21, 2026
View chart & download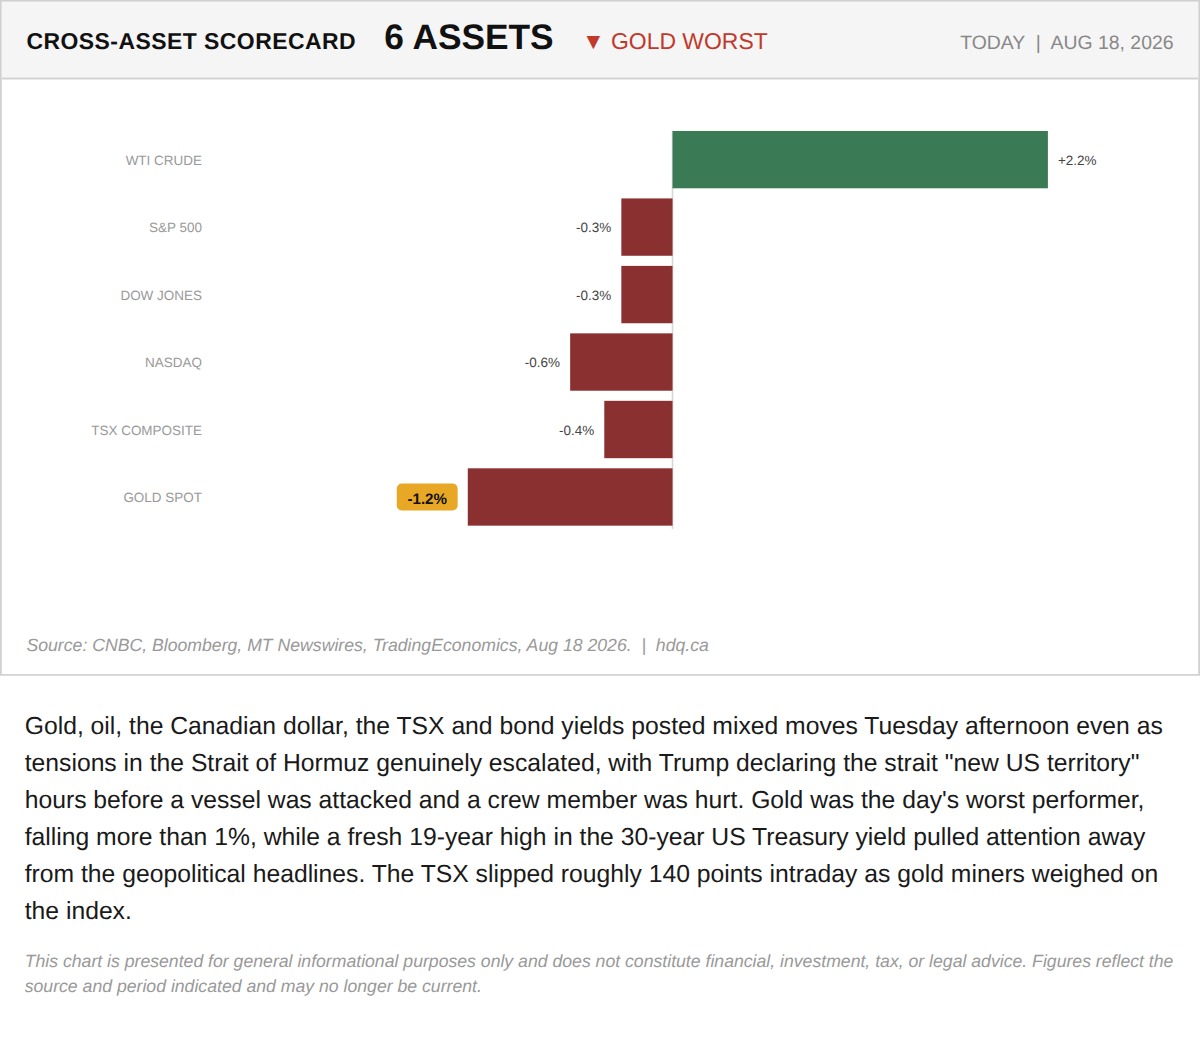
Gold, oil, the Canadian dollar, the TSX and bond yields posted mixed moves Tuesday afternoon even as tensions in the Strait of Hormuz…
Cross-Asset Scorecard as Hormuz Escalates
August 18, 2026
View chart & download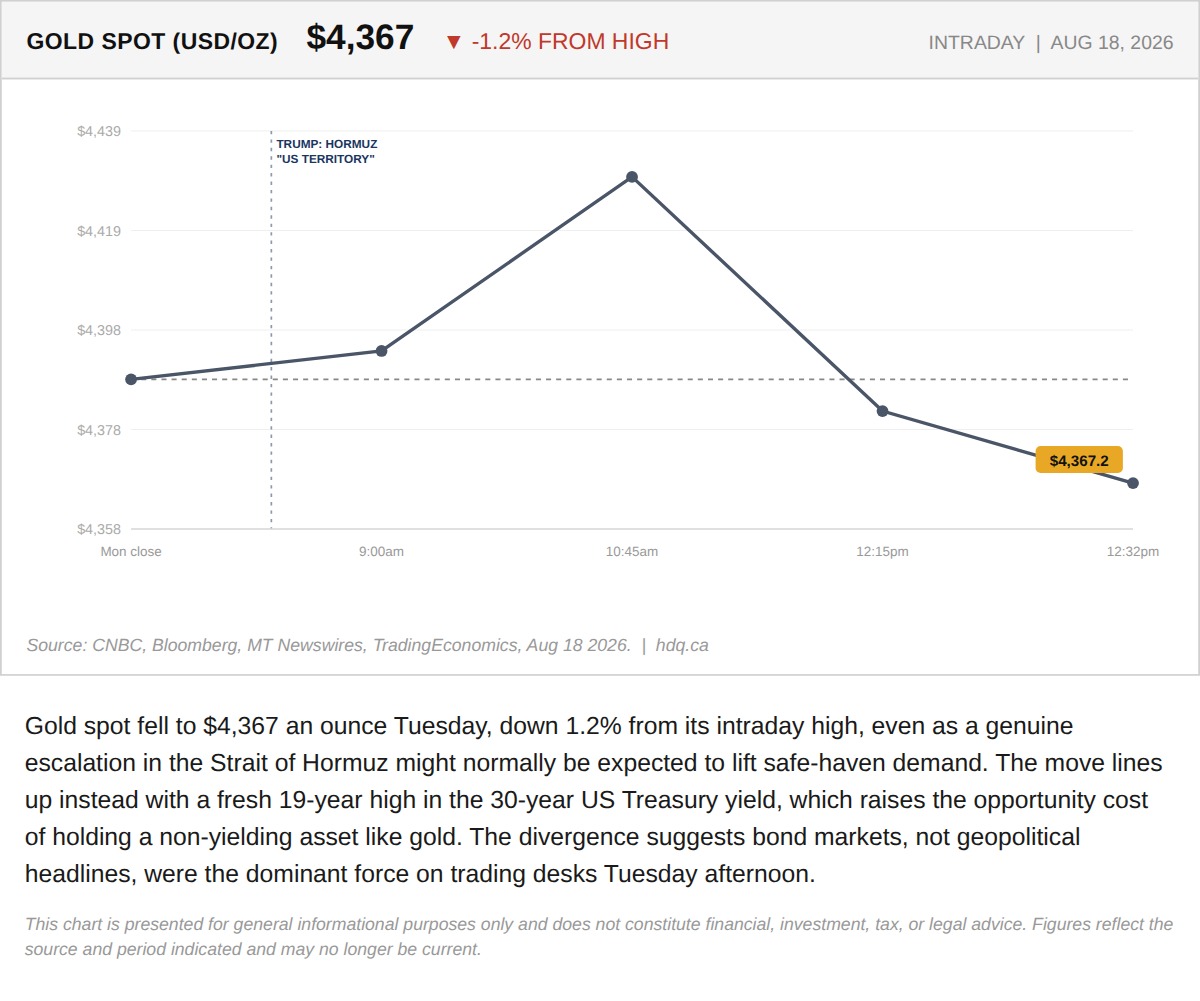
Gold spot fell to $4,367 an ounce Tuesday, down 1.2% from its intraday high, even as a genuine escalation in the Strait of Hormuz might…
Gold Falls as Treasury Yields Hit a 19-Year High
August 18, 2026
View chart & download