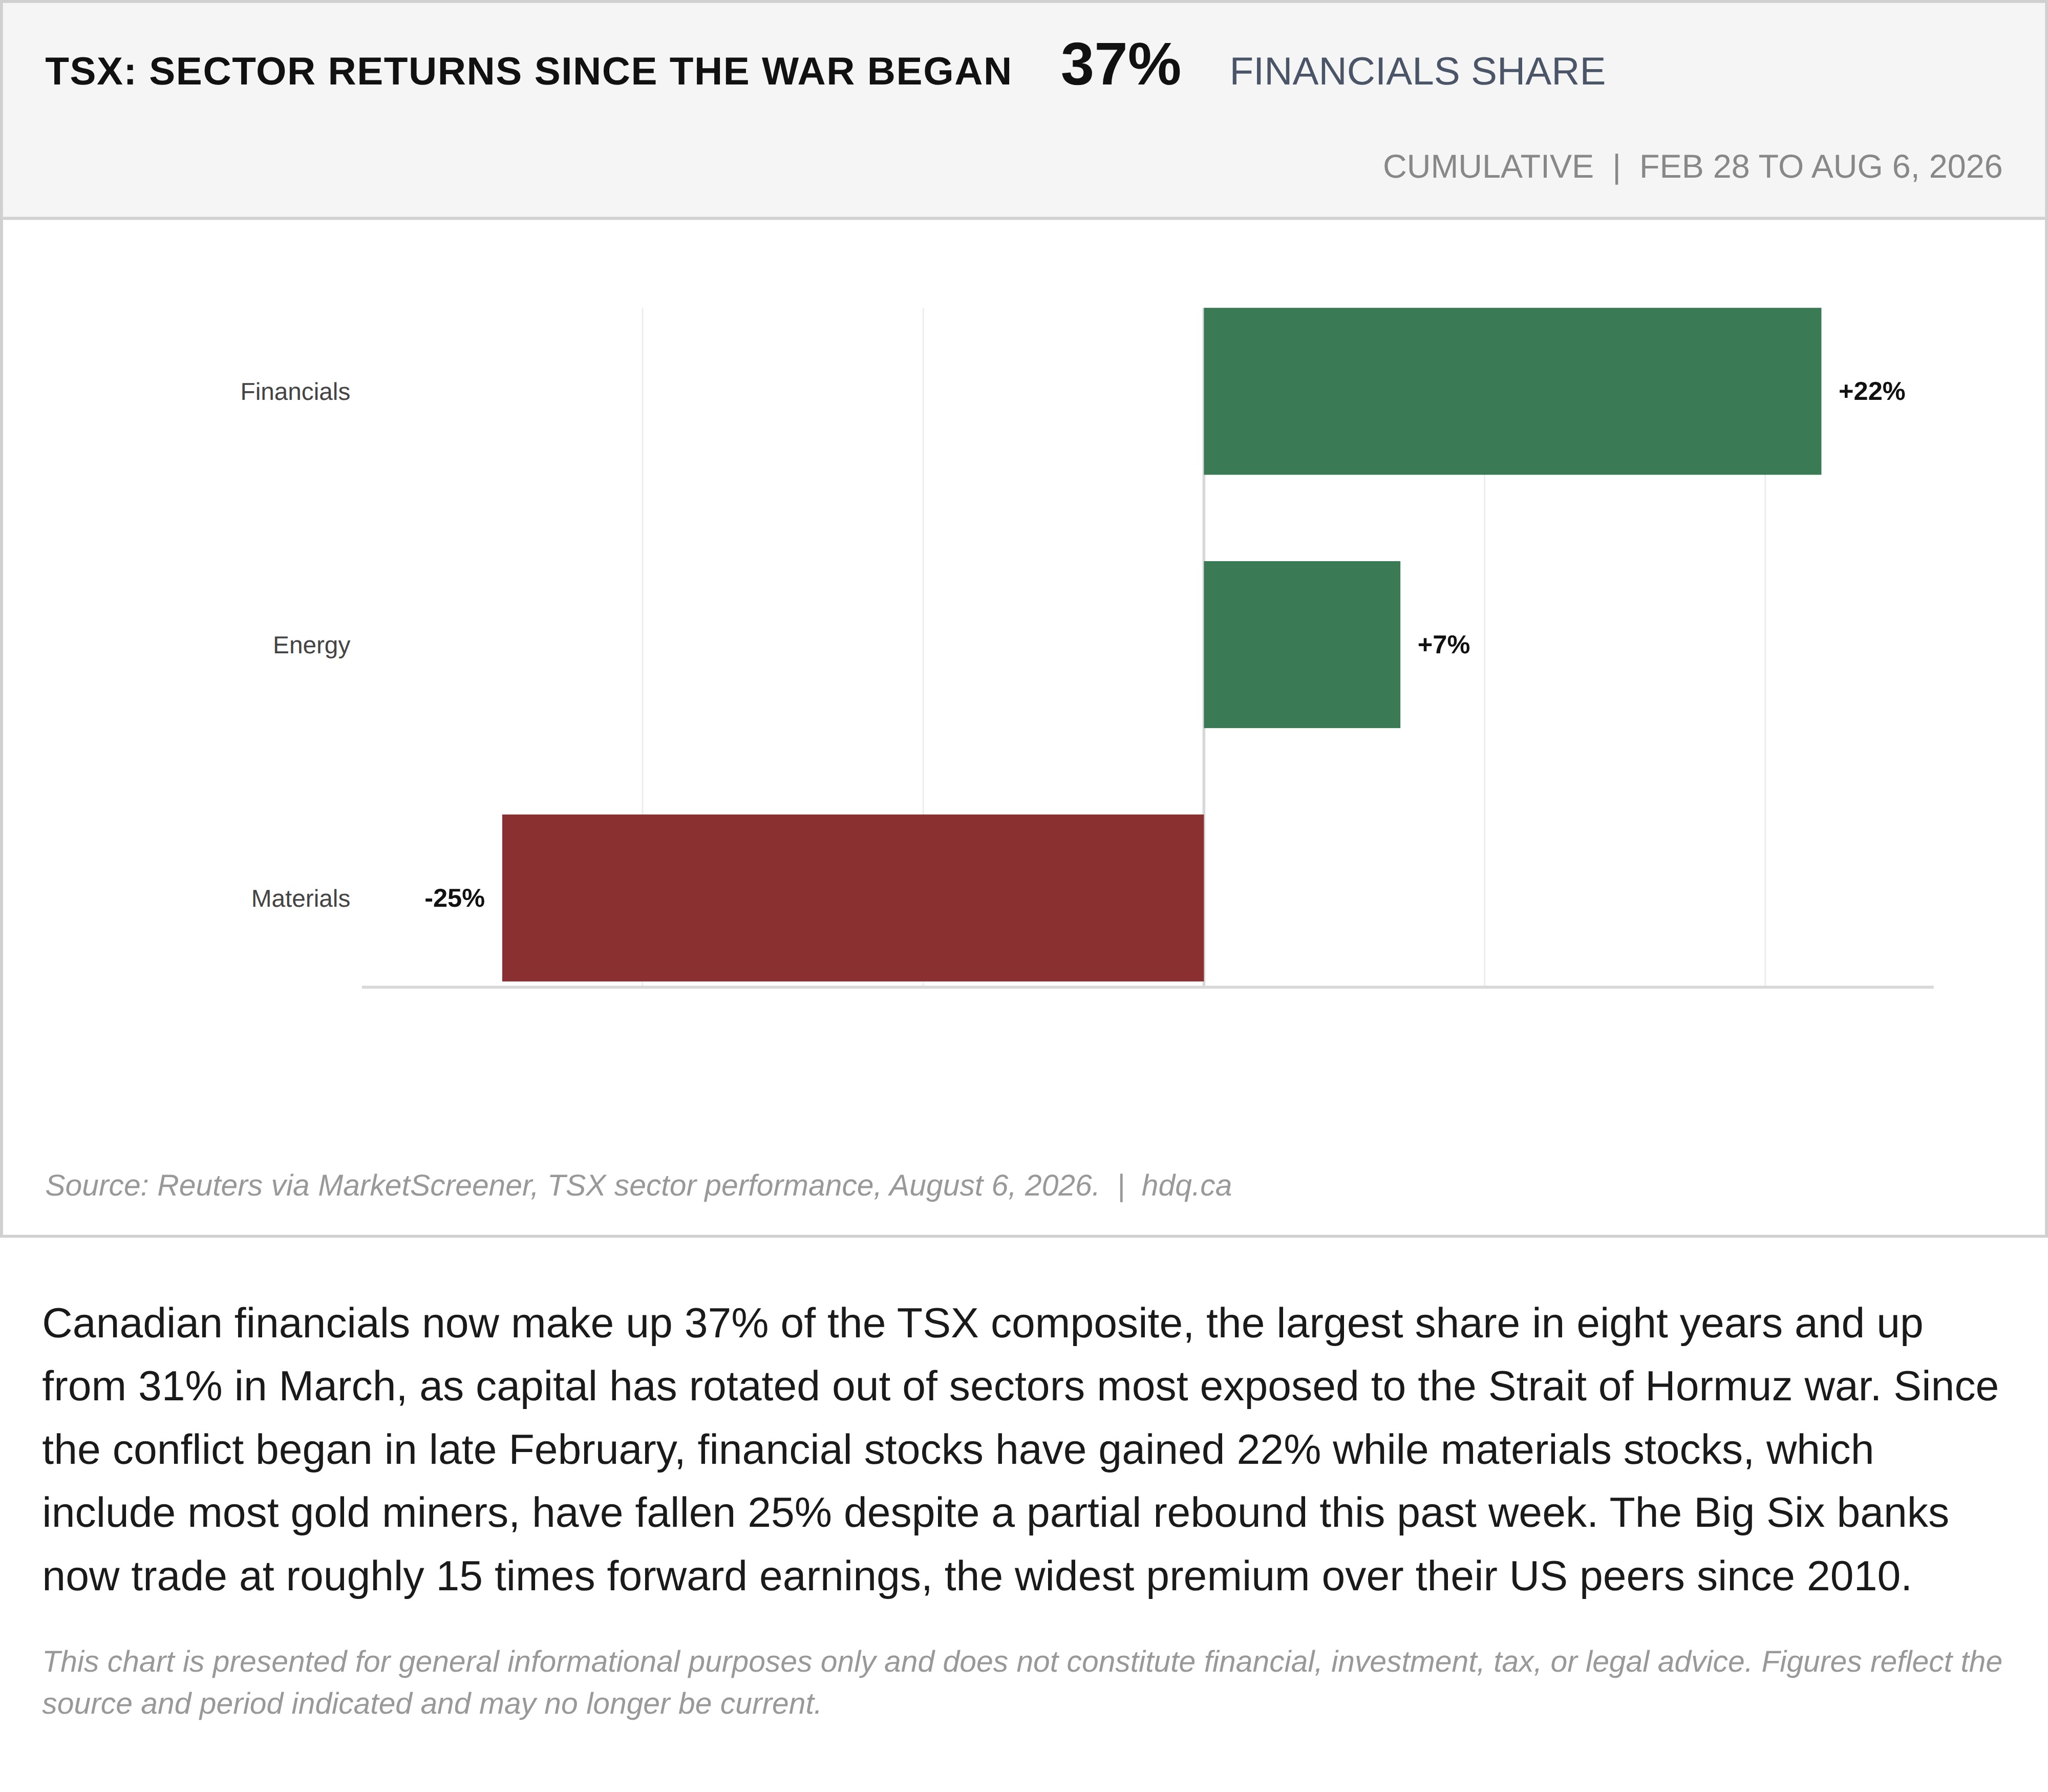
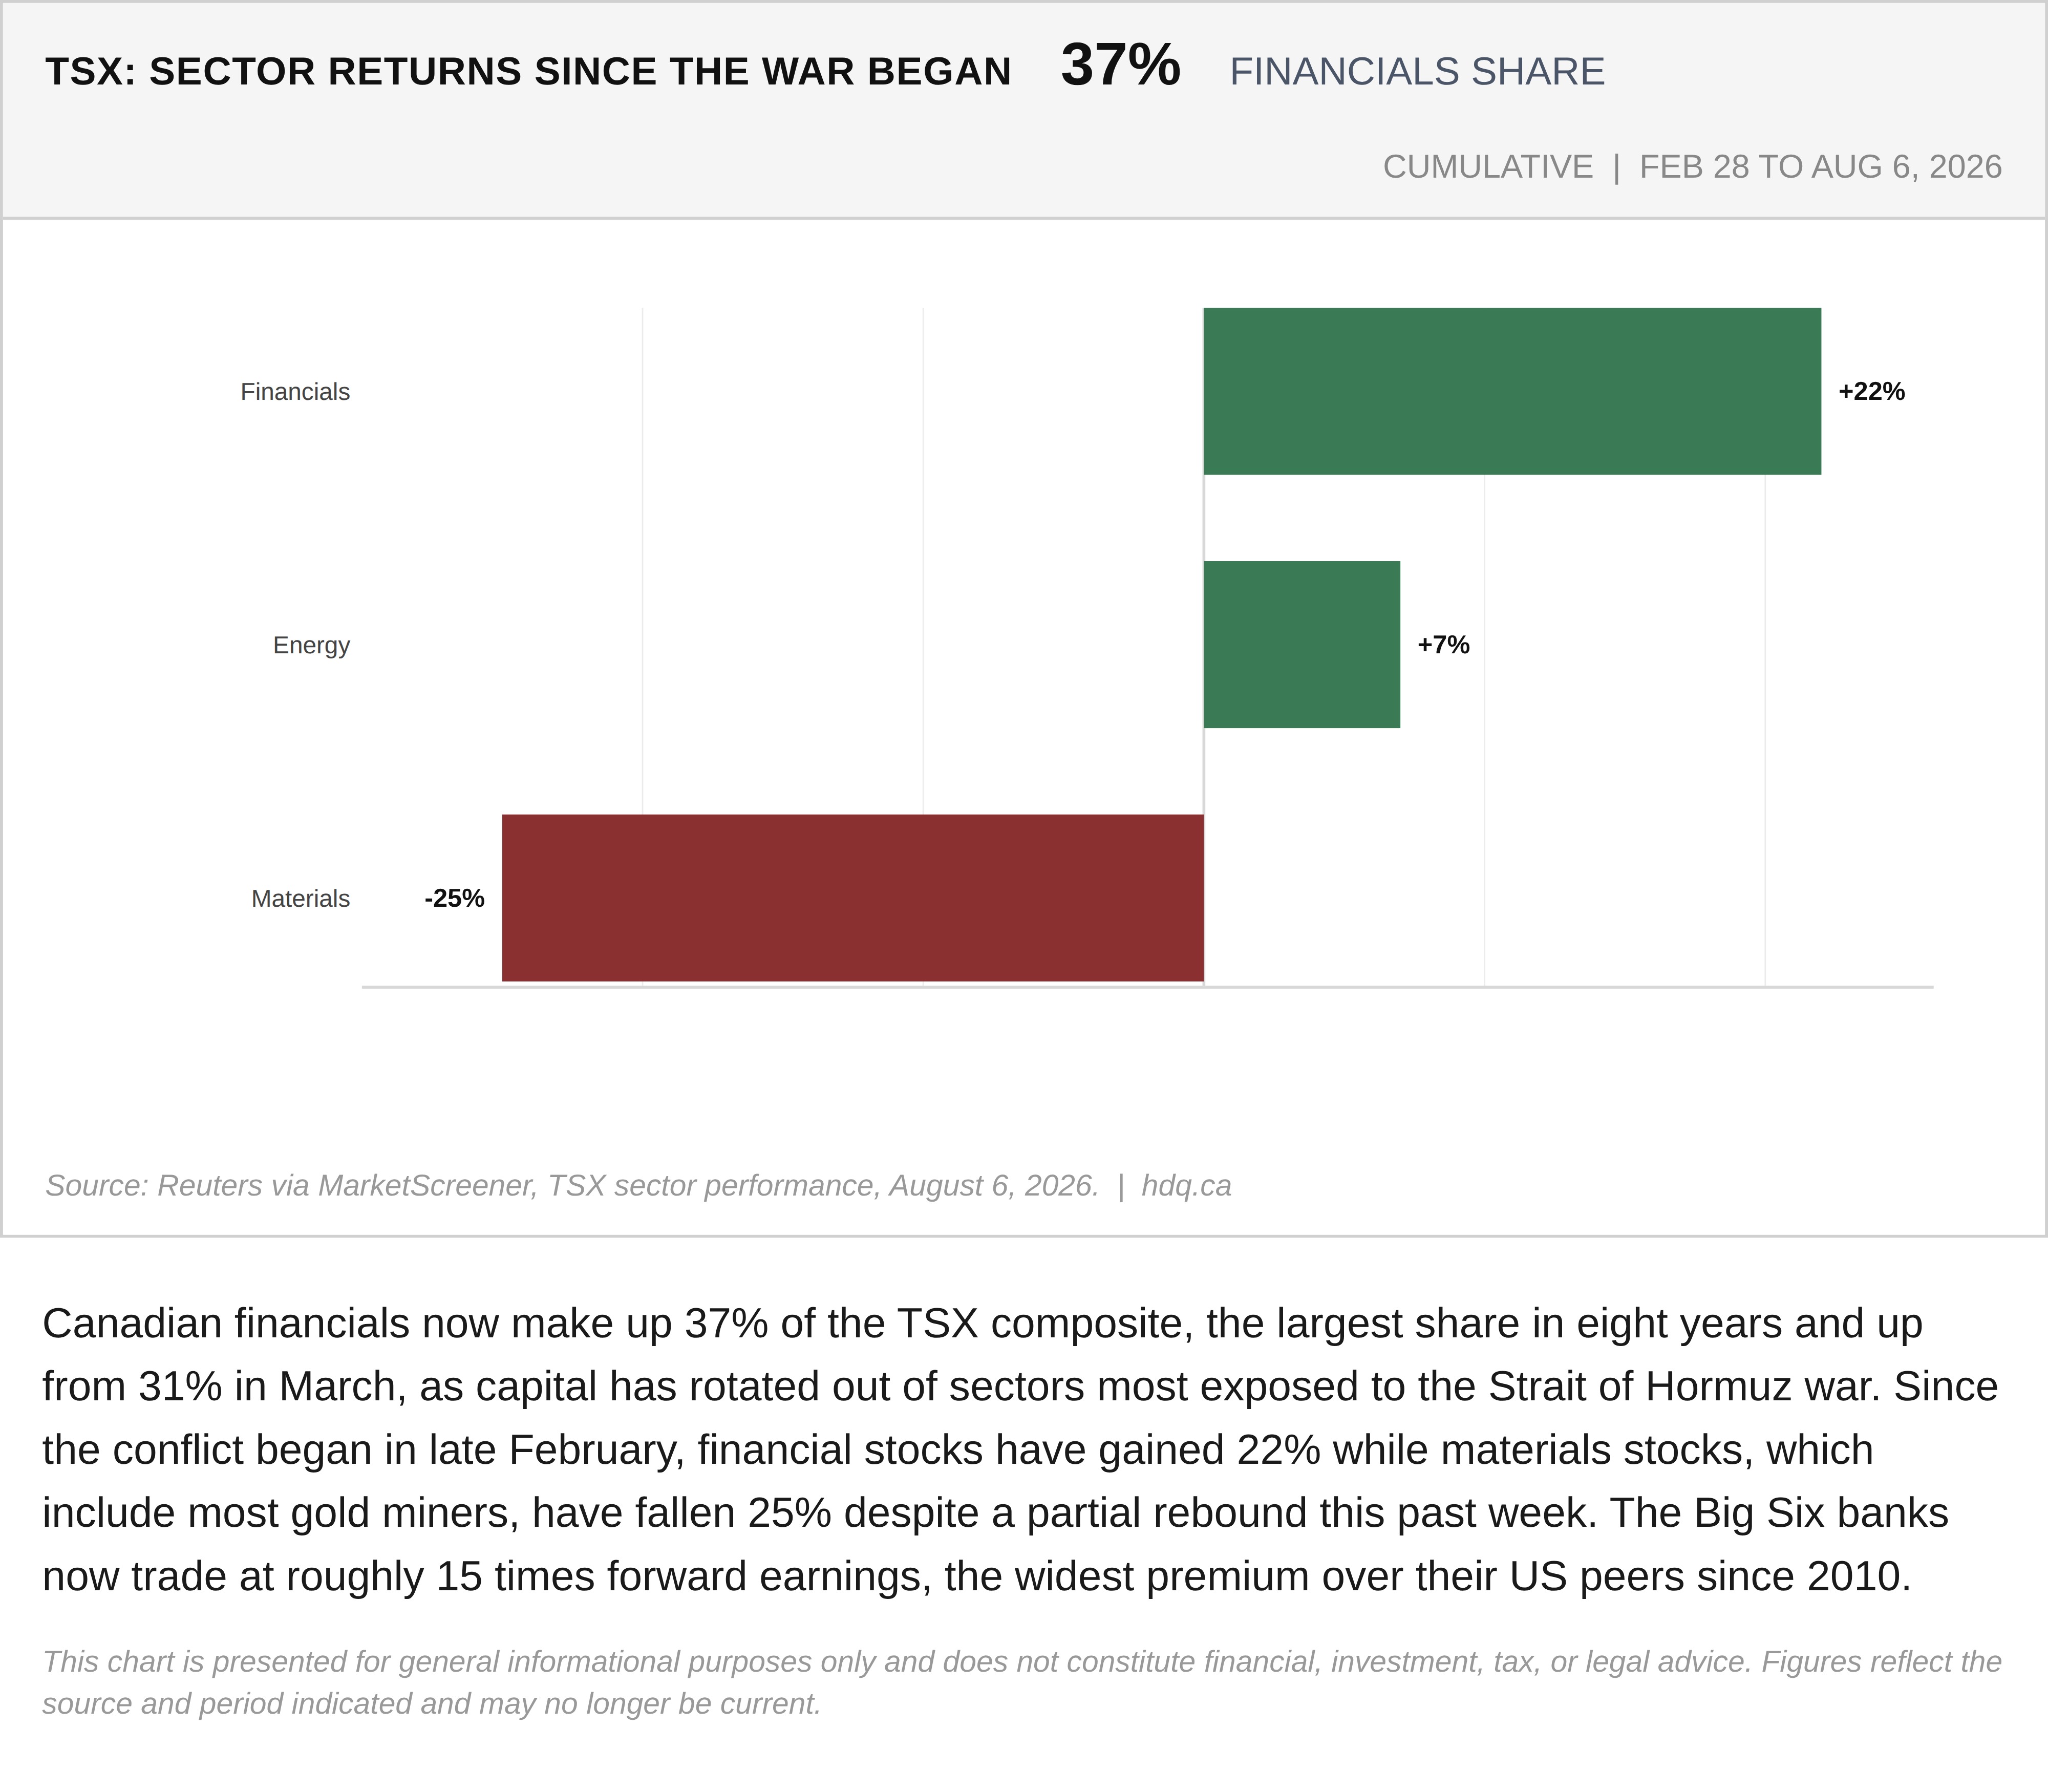
Canadian financials now make up 37% of the TSX composite, the largest share in eight years and up from 31% in March, as capital has rotated out of sectors most exposed to the Strait of Hormuz war. Since the conflict began in late February, financial stocks have gained 22% while materials stocks, which include most gold miners, have fallen 25% despite a partial rebound this past week. The Big Six banks now trade at roughly 15 times forward earnings, the widest premium over their US peers since 2010.
This chart is presented for general informational purposes only and does not constitute financial, investment, tax, or legal advice. Figures reflect the source and period indicated and may no longer be current.
Related charts
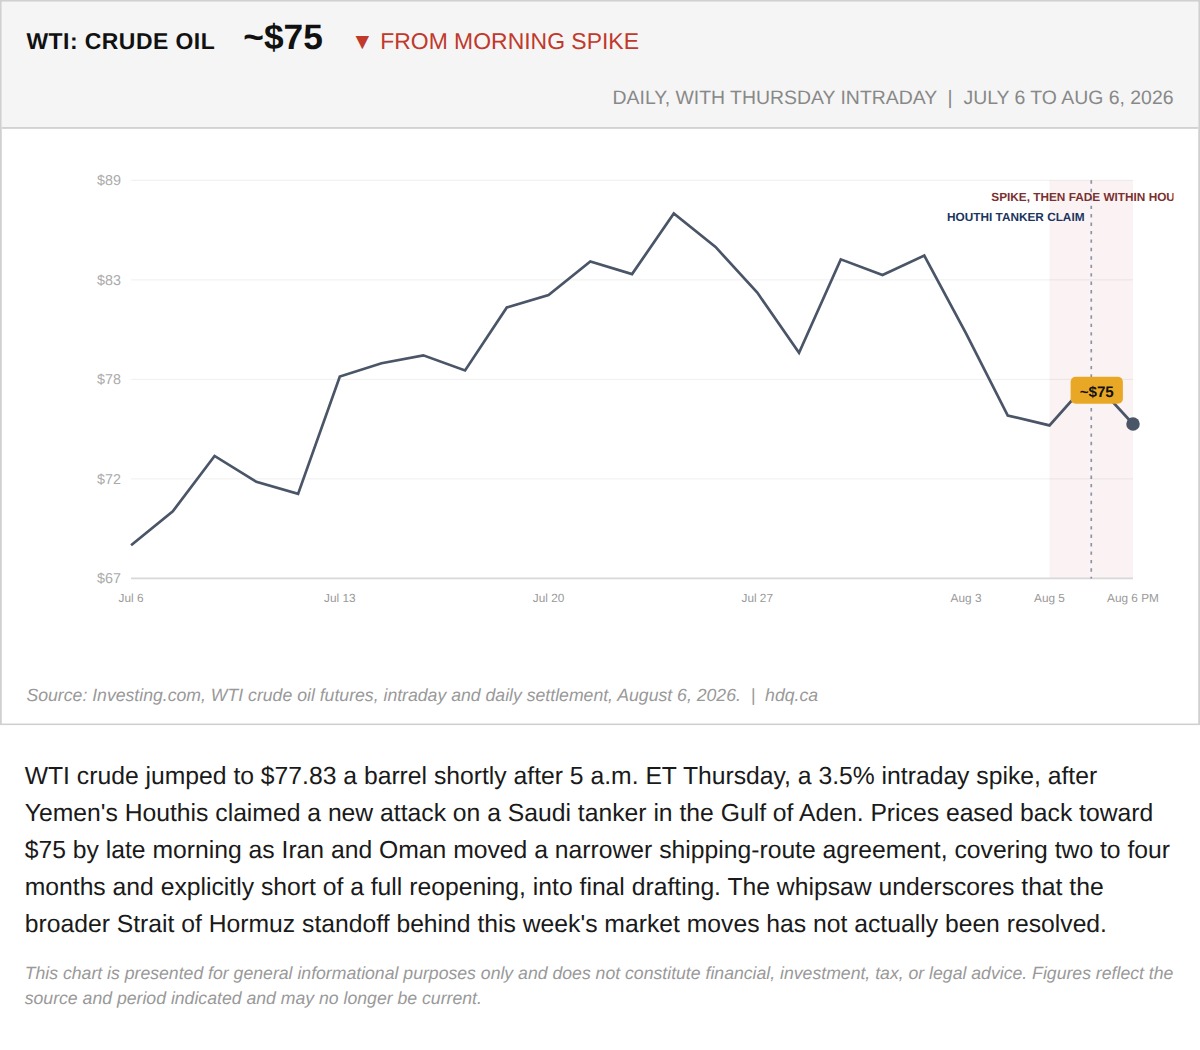
WTI crude jumped to $77.83 a barrel shortly after 5 a.m.
WTI Crude Slips Back to $75 After Thursday's Pre-Dawn Spike
August 6, 2026
View chart & download
The S&P/TSX Composite closed July at 35,226, up 1.06% for the month, a modest headline figure that conceals sharp intra-month swings.
S&P/TSX Composite closes July up 1.06% after a volatile month
July 31, 2026
View chart & download
Brent and WTI crude both surged in July, with WTI ending the month at $85.47, up 23.0%, after round-tripping from a five-month low near $68.74.
WTI and Brent crude surge in July as the Iran ceasefire collapses
July 31, 2026
View chart & download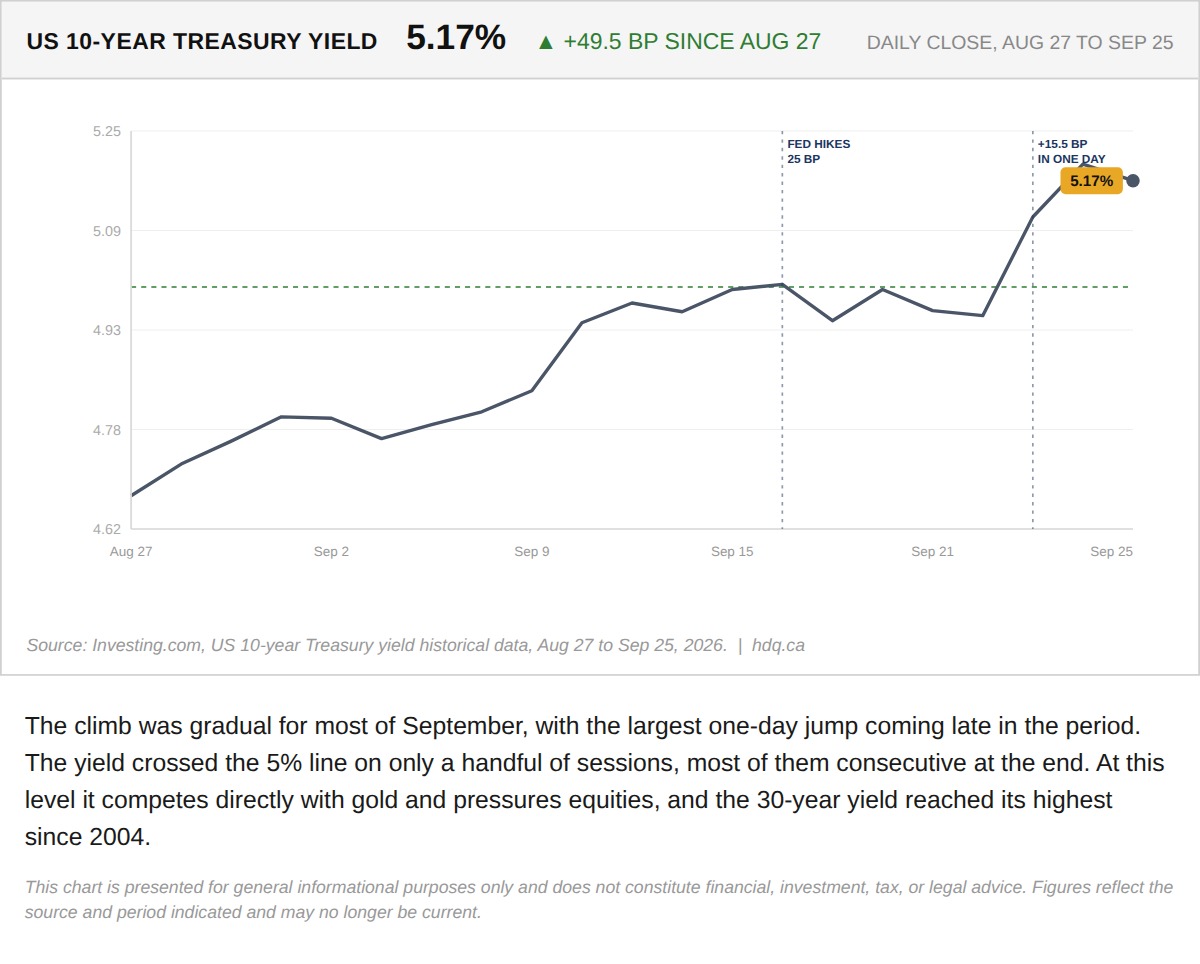
The climb was gradual for most of September, with the largest one-day jump coming late in the period.
US 10-Year Treasury Yield Rises Steadily Through September
September 28, 2026
View chart & download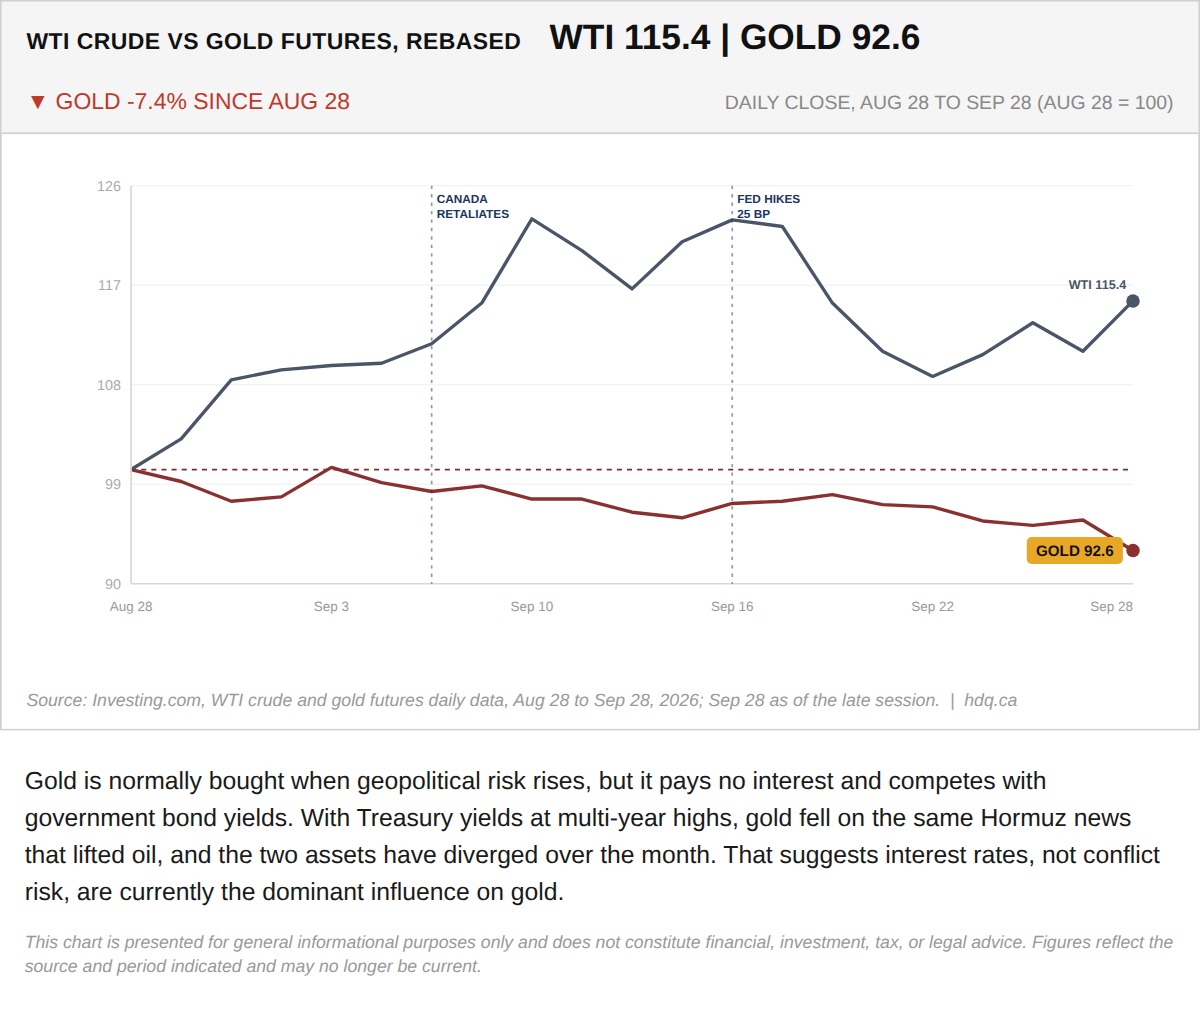
Gold is normally bought when geopolitical risk rises, but it pays no interest and competes with government bond yields.
Gold Falls While Oil Rises as Hormuz Talks Stall
September 28, 2026
View chart & download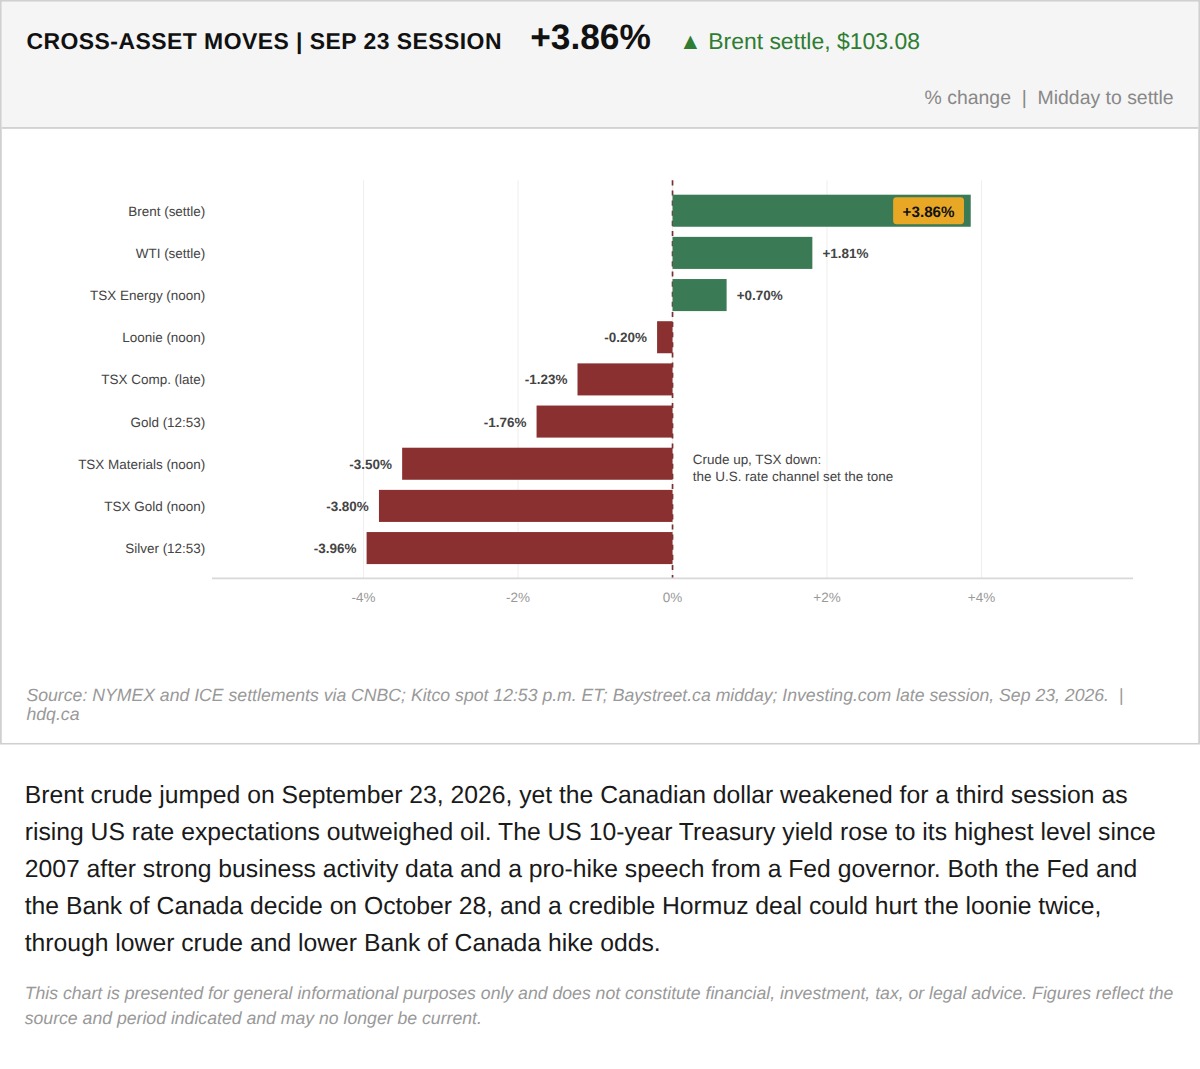
Brent crude jumped on September 23, 2026, yet the Canadian dollar weakened for a third session as rising US rate expectations outweighed oil.
Brent Jumps While the Canadian Dollar and TSX Fall in the September 23 Session
September 23, 2026
View chart & download