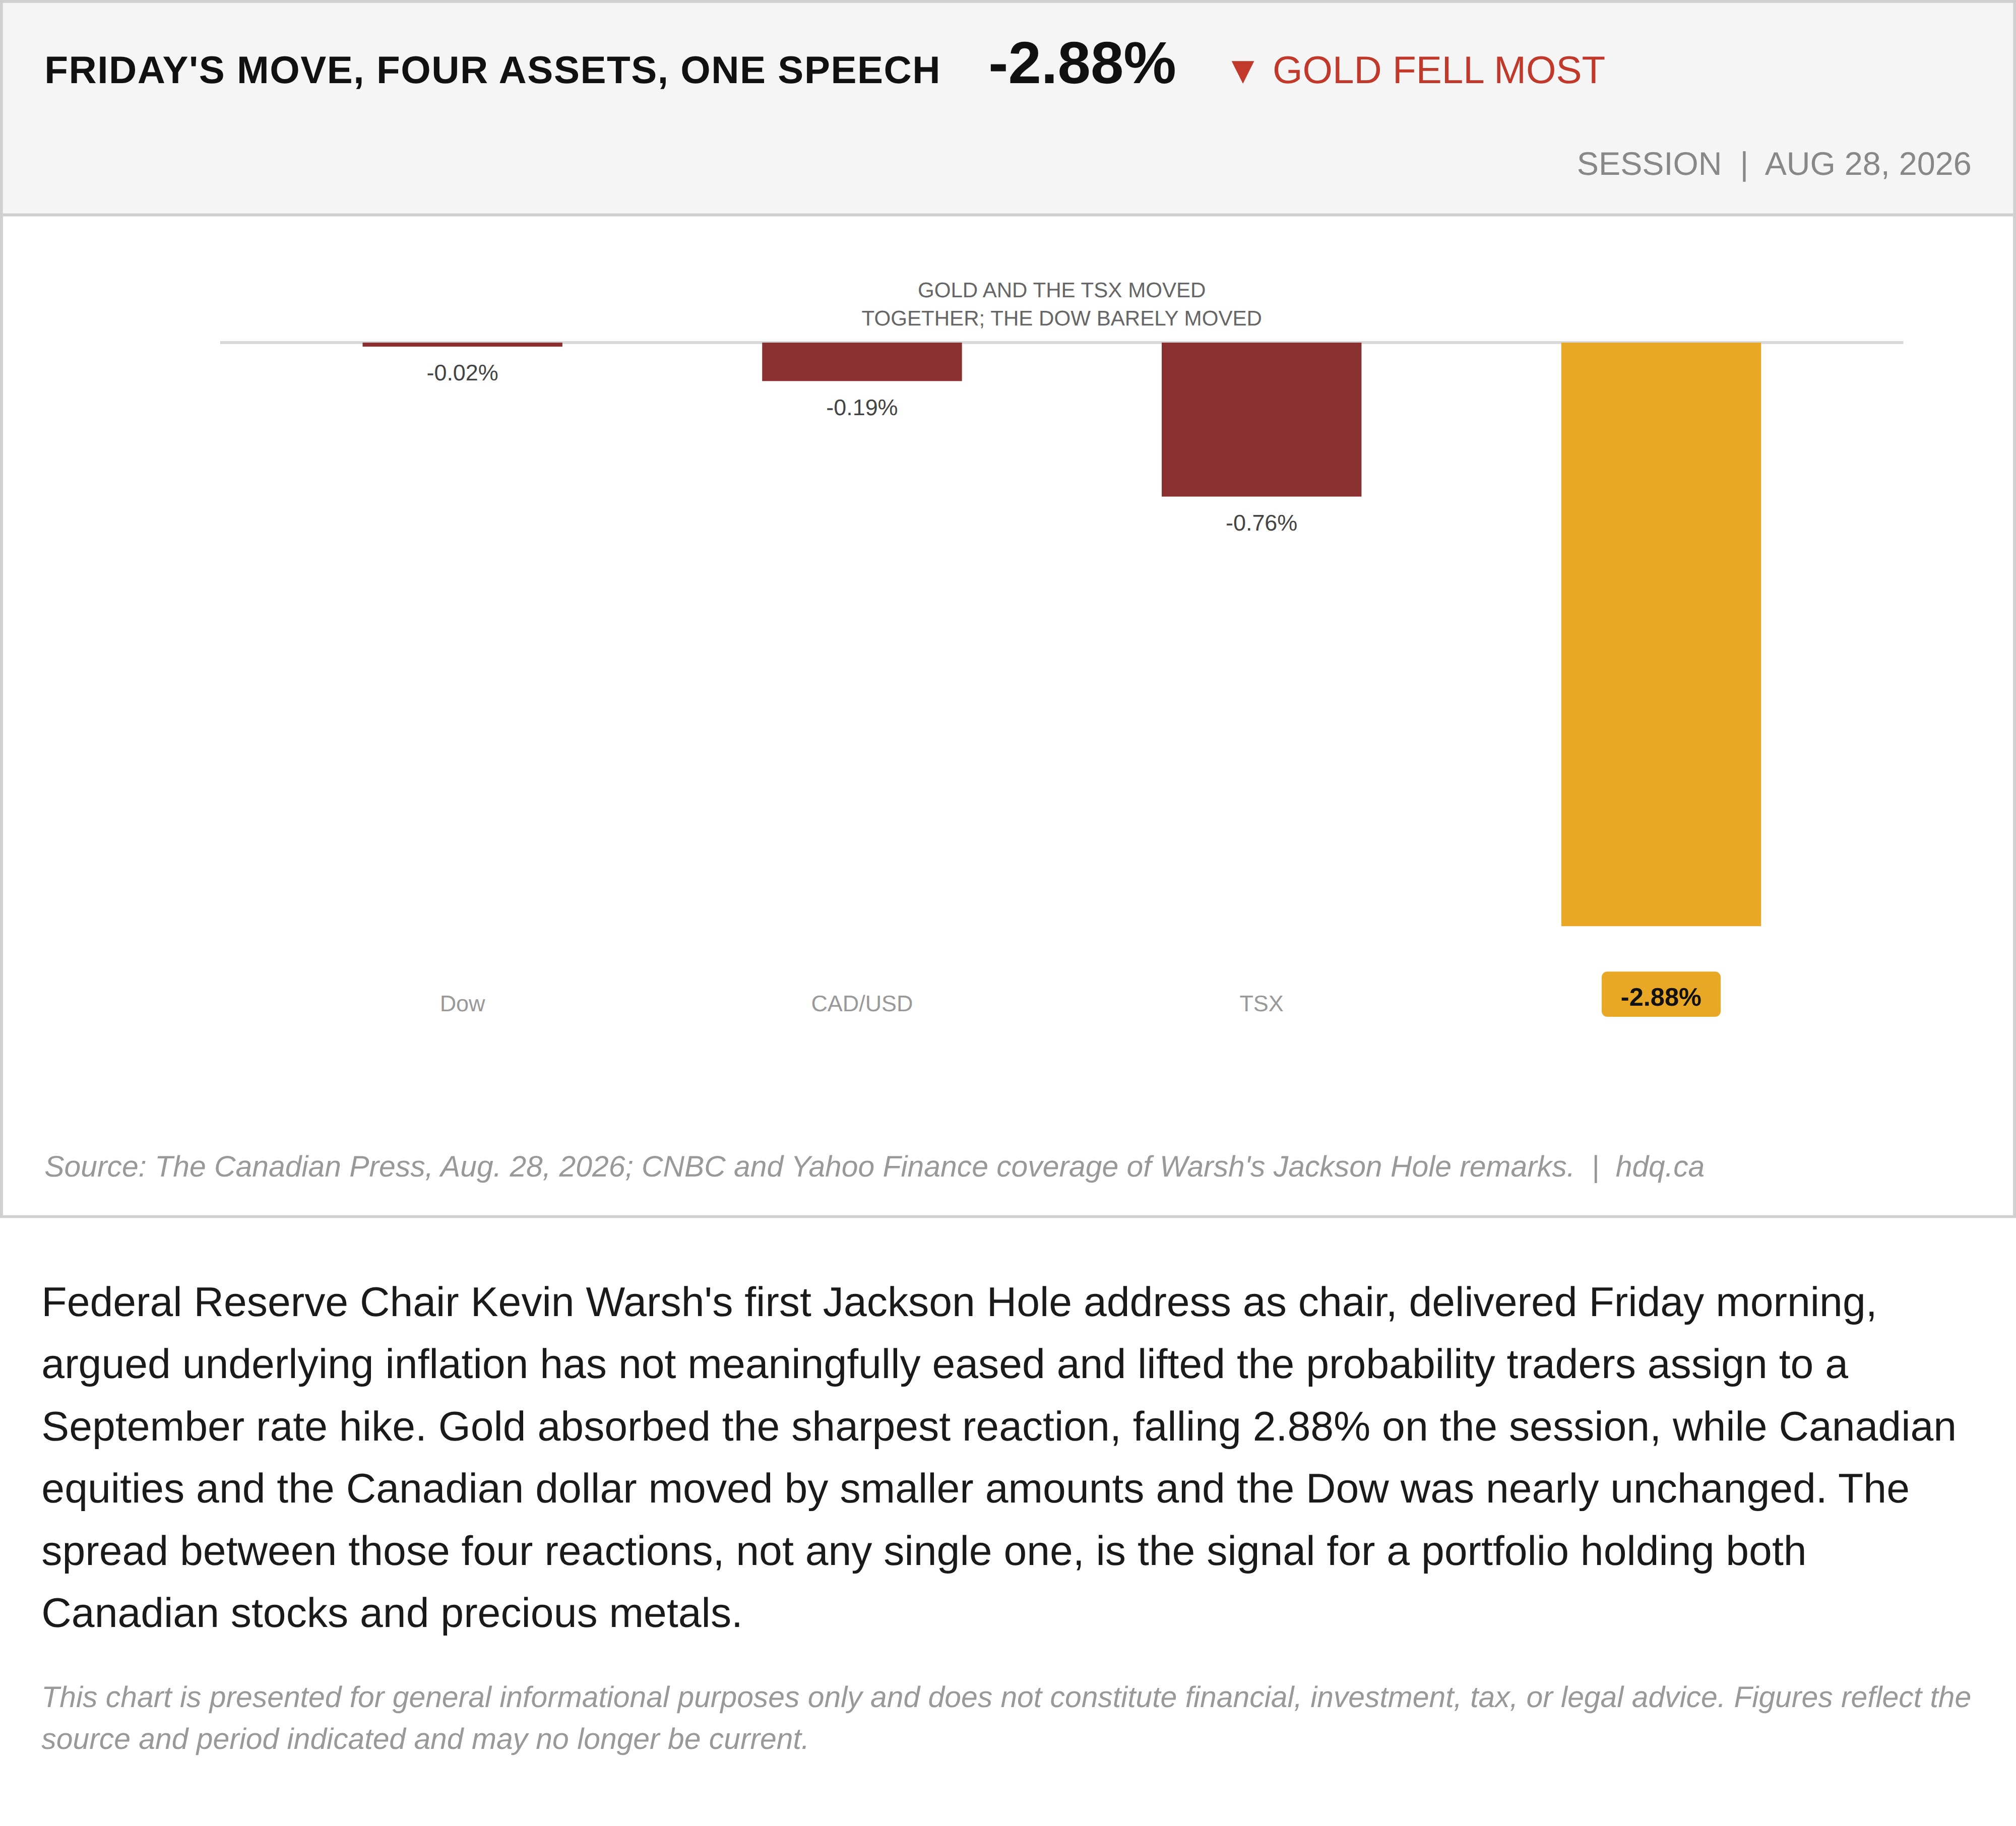
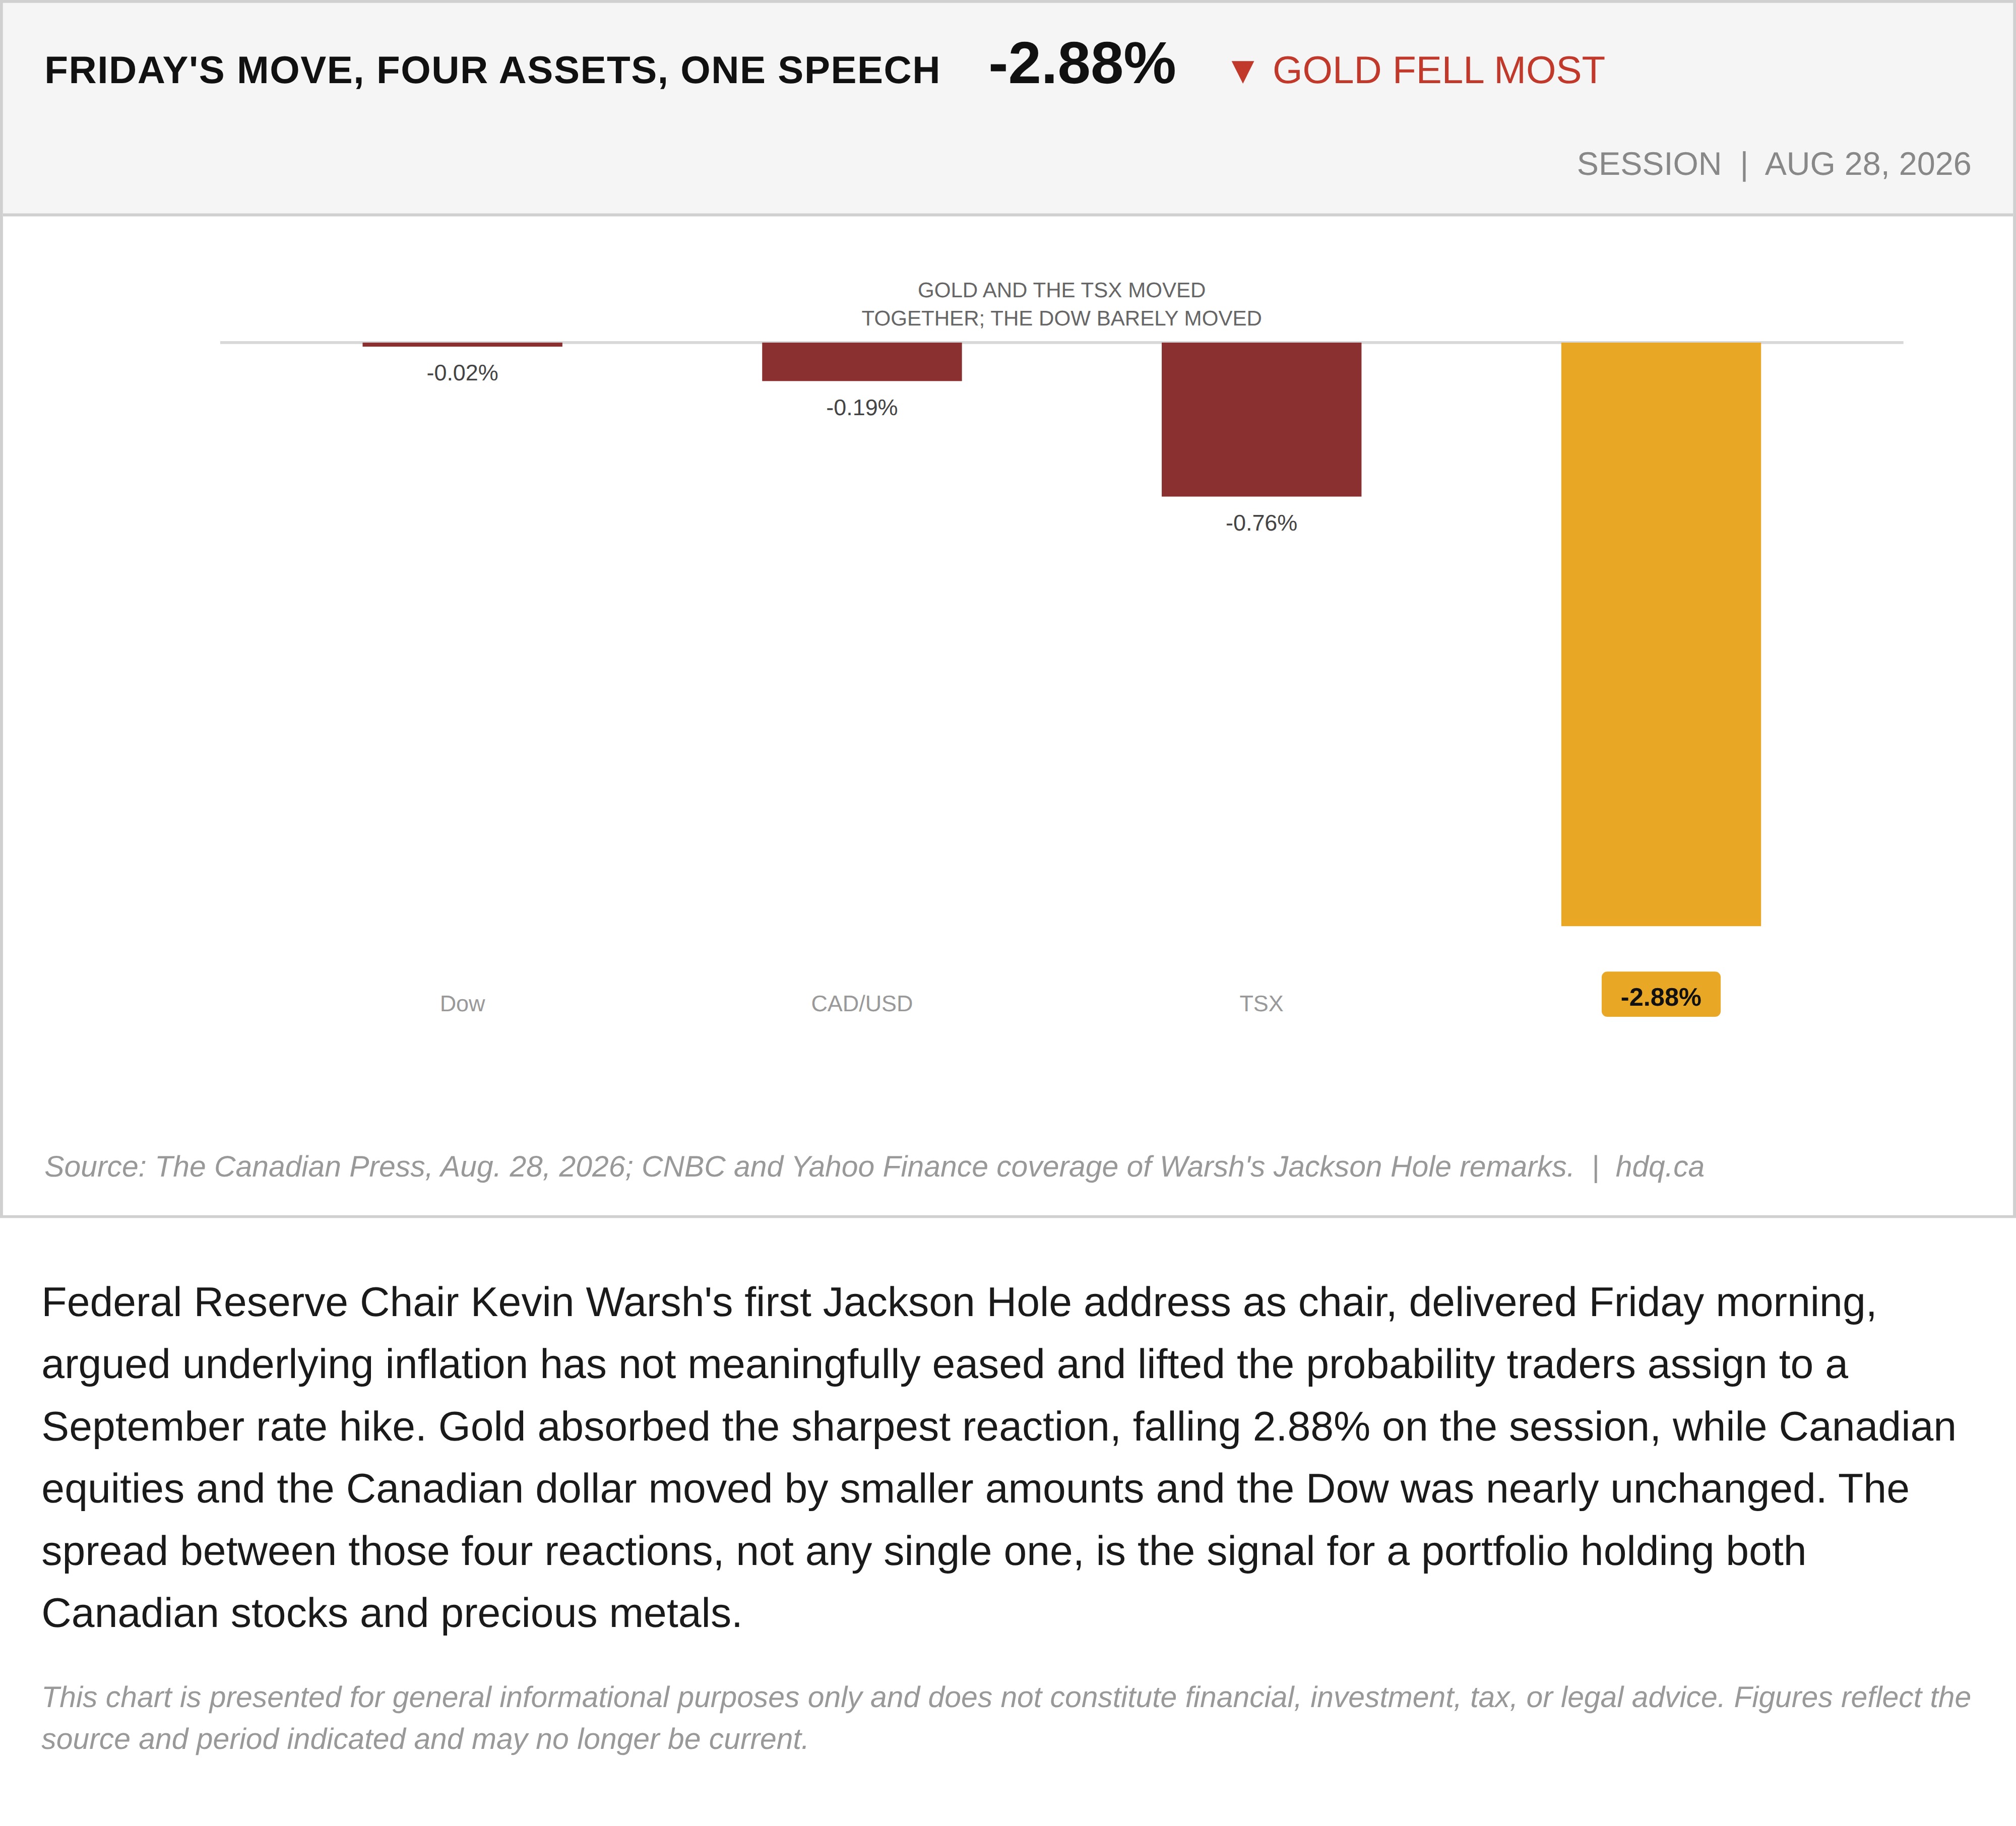
Federal Reserve Chair Kevin Warsh's first Jackson Hole address as chair, delivered Friday morning, argued underlying inflation has not meaningfully eased and lifted the probability traders assign to a September rate hike. Gold absorbed the sharpest reaction, falling 2.88% on the session, while Canadian equities and the Canadian dollar moved by smaller amounts and the Dow was nearly unchanged. The spread between those four reactions, not any single one, is the signal for a portfolio holding both Canadian stocks and precious metals.
This chart is presented for general informational purposes only and does not constitute financial, investment, tax, or legal advice. Figures reflect the source and period indicated and may no longer be current.
Related charts
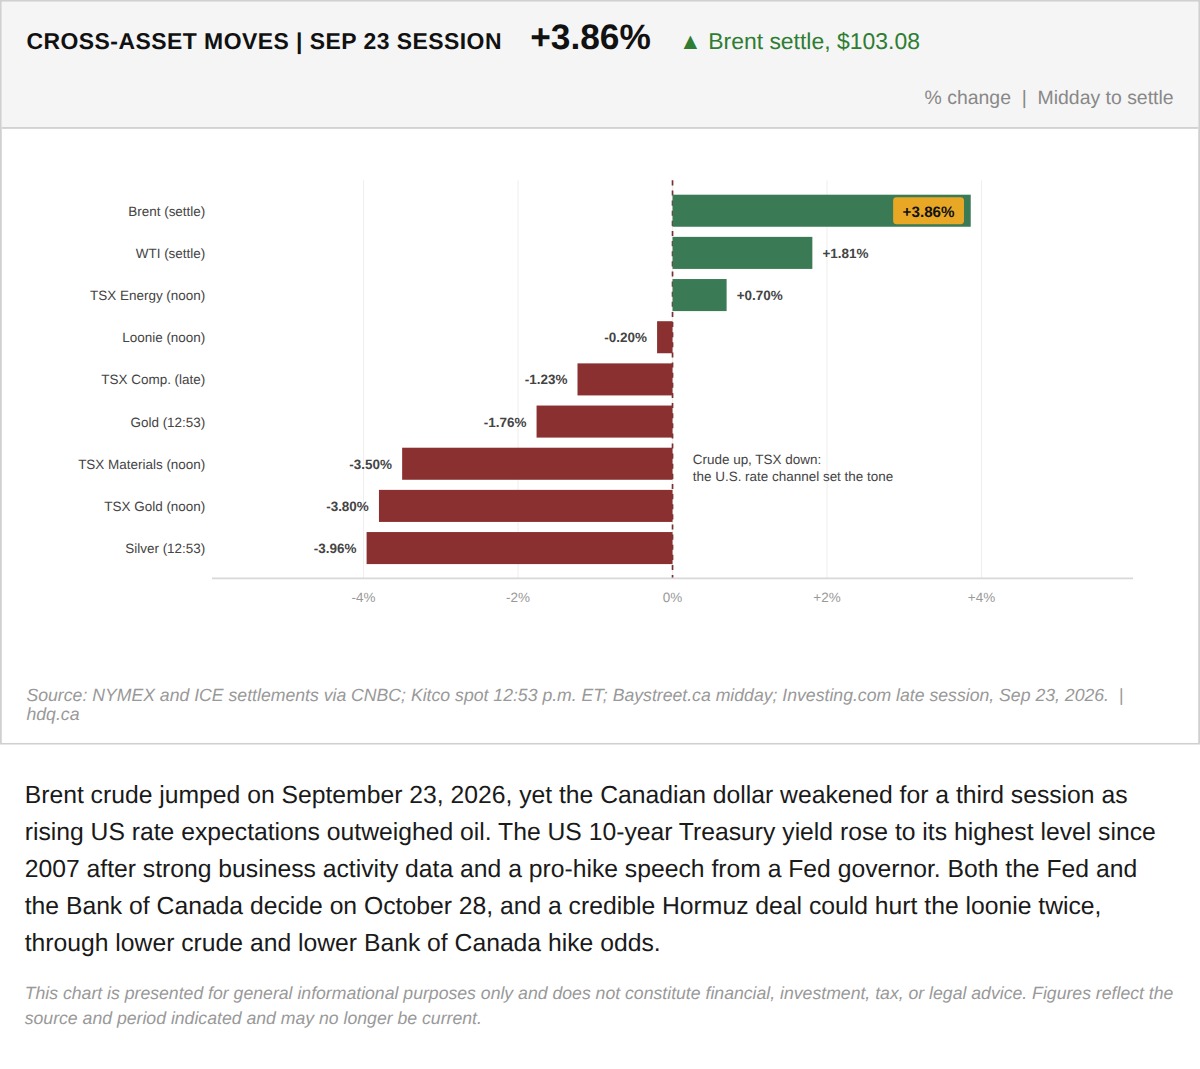
Brent crude jumped on September 23, 2026, yet the Canadian dollar weakened for a third session as rising US rate expectations outweighed oil.
Brent Jumps While the Canadian Dollar and TSX Fall in the September 23 Session
September 23, 2026
View chart & download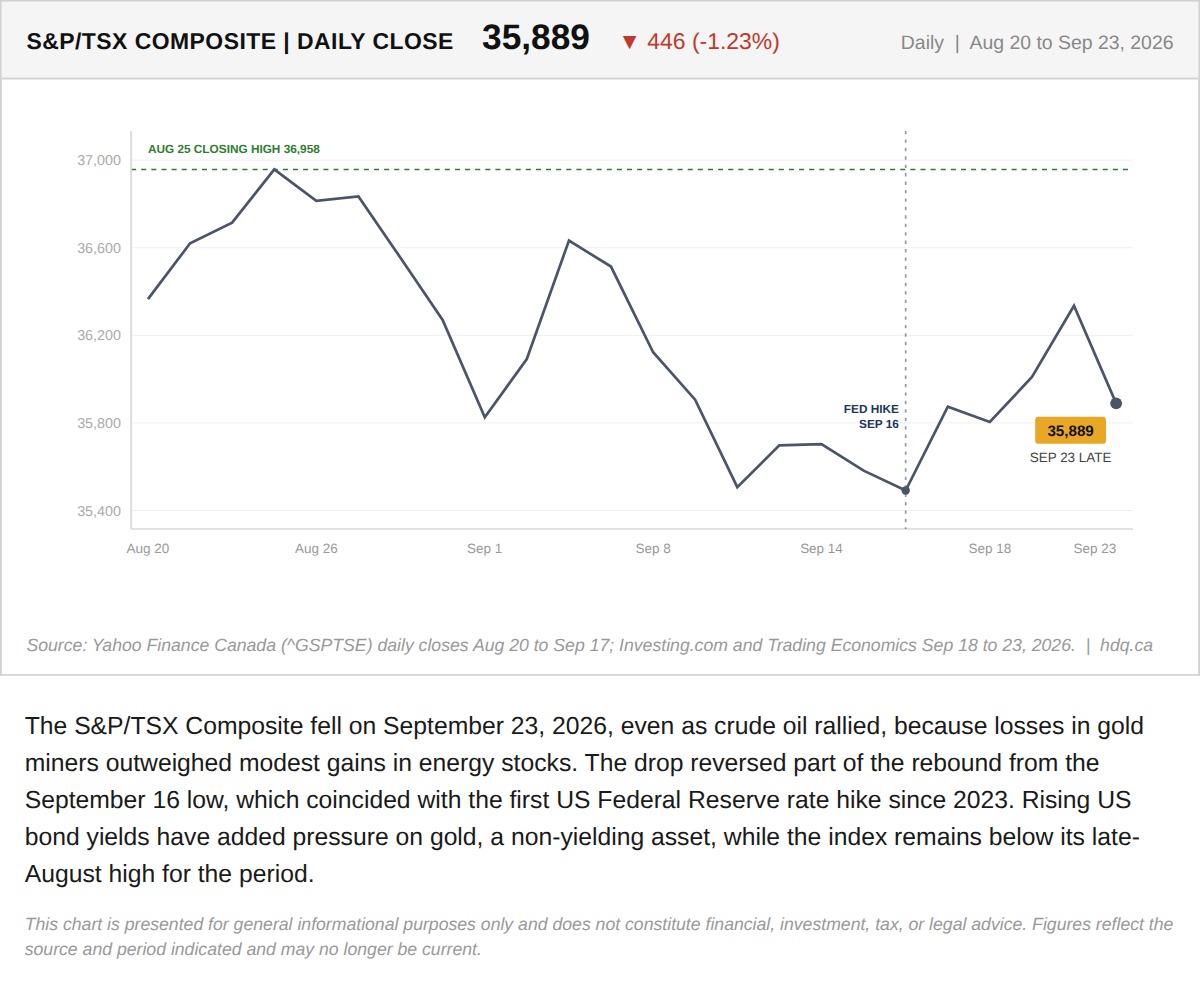
The S&P/TSX Composite fell on September 23, 2026, even as crude oil rallied, because losses in gold miners outweighed modest gains in energy stocks.
TSX Composite Falls Despite an Oil Rally as Gold Stocks Slide
September 23, 2026
View chart & download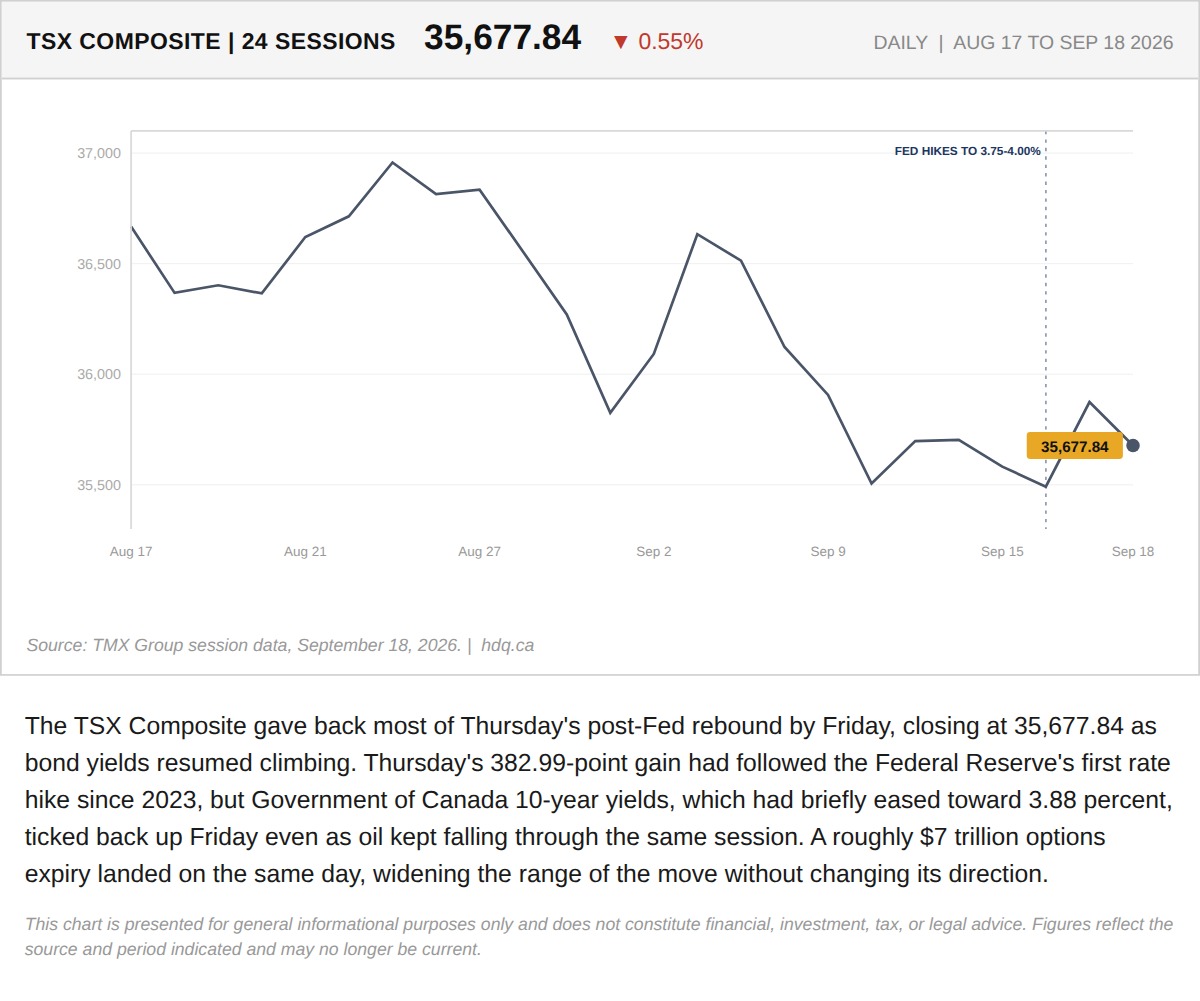
The TSX Composite gave back most of Thursday's post-Fed rebound by Friday, closing at 35,677.84 as bond yields resumed climbing.
TSX Gives Back Post-Fed Rally as Bond Yields Resume Climbing
September 18, 2026
View chart & download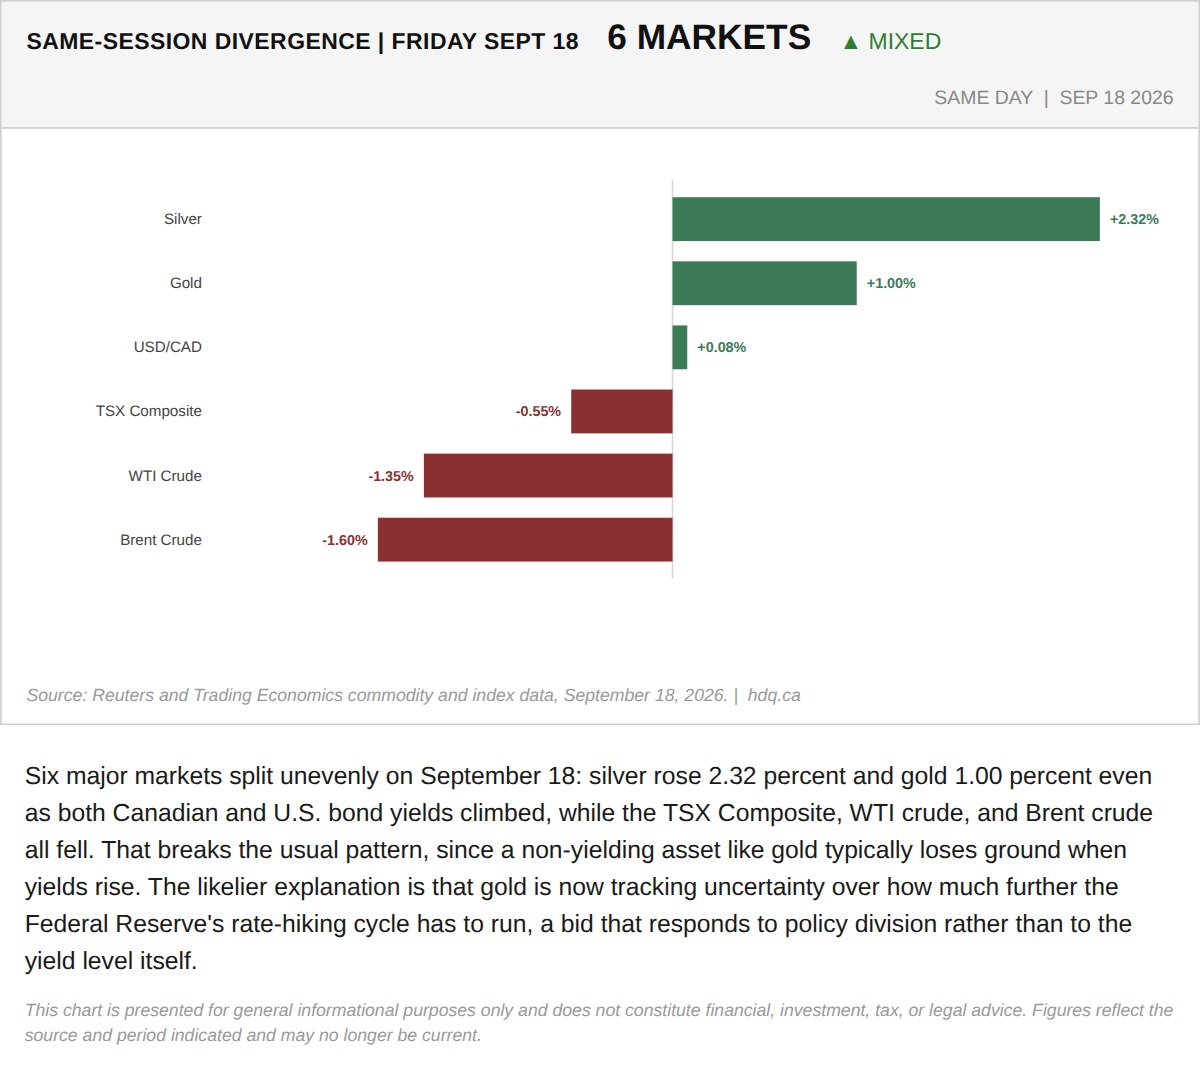
Six major markets split unevenly on September 18: silver rose 2.32 percent and gold 1.00 percent even as both Canadian and U.S.
Gold and Silver Rise With Yields, Breaking the Usual Pattern
September 18, 2026
View chart & download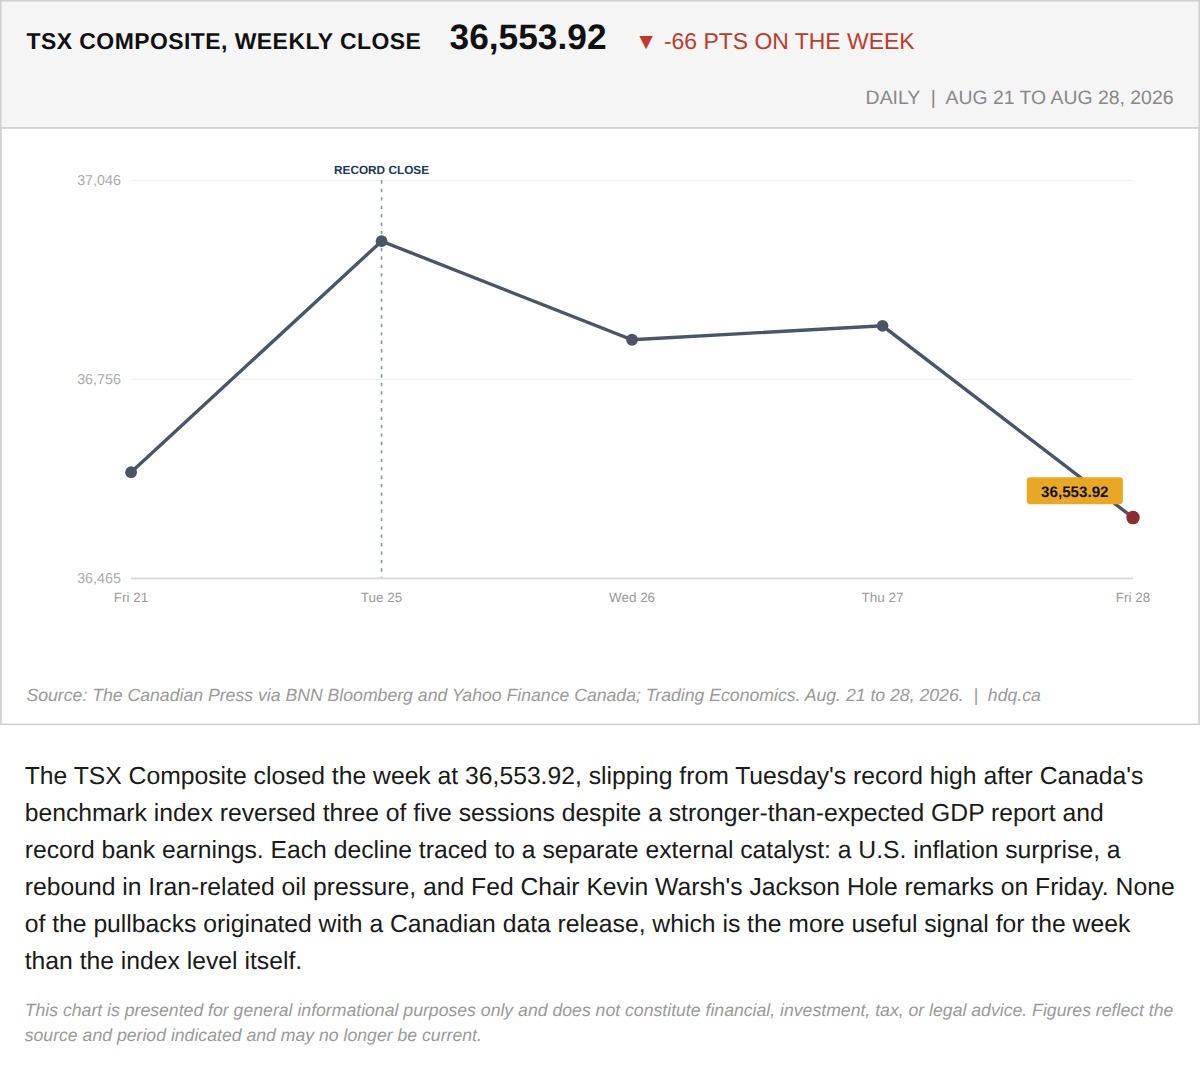
The TSX Composite closed the week at 36,553.92, slipping from Tuesday's record high after Canada's benchmark index reversed three of five…
Canada Had Its Best Economic Week in Years. The TSX Still Closed Lower.
August 29, 2026
View chart & download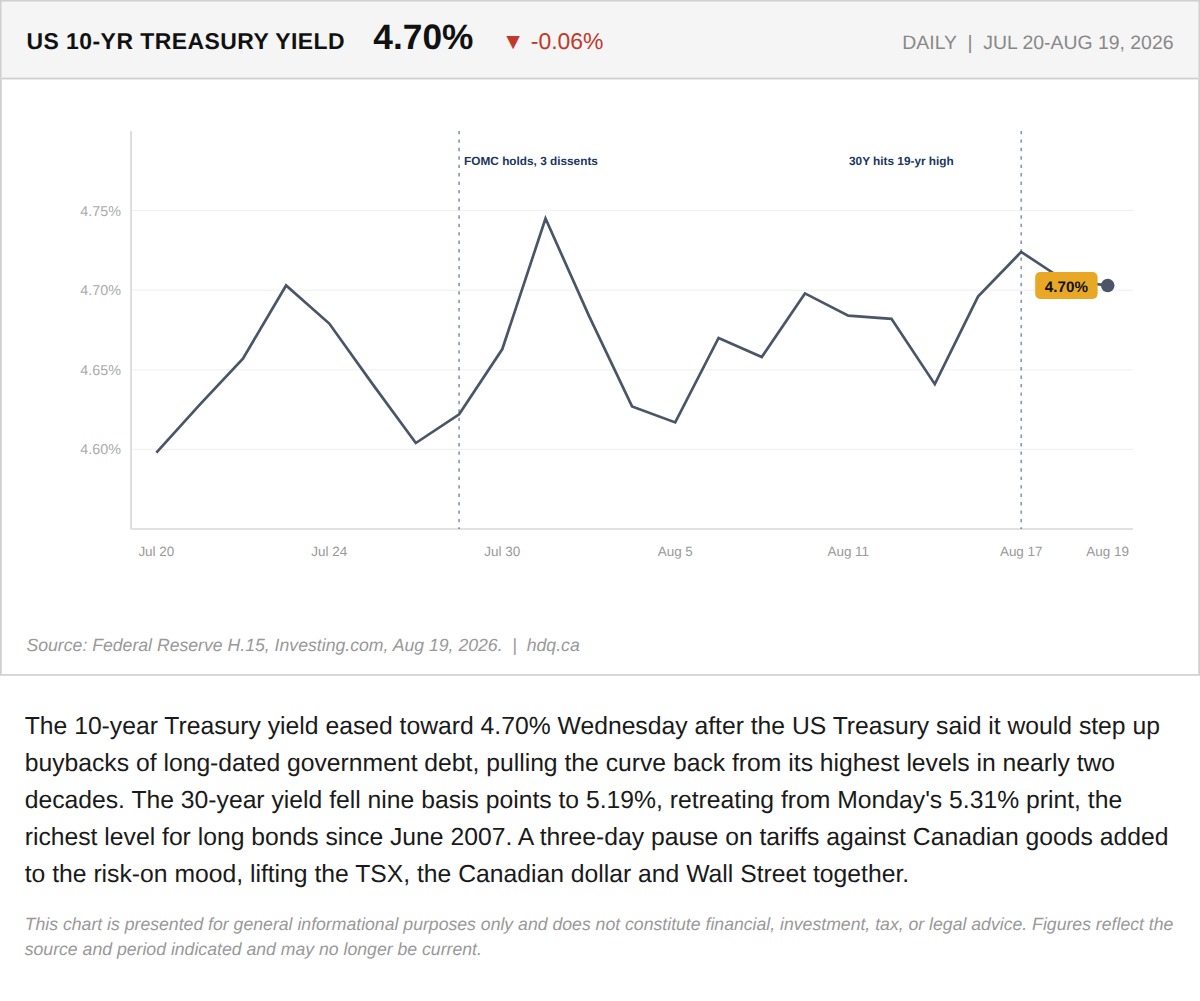
The 10-year Treasury yield eased toward 4.70% Wednesday after the US Treasury said it would step up buybacks of long-dated government debt,…
US 10-Year Treasury Yield Eases After Treasury Buyback Announcement
August 19, 2026
View chart & download